4884
Diffusion tensor distribution imaging of breast tumors: Initial findings1Memorial Sloan Kettering Cancer Center, New York, NY, United States, 2Random Walk Imaging, Lund, Sweden, 3Lund University, Lund, Sweden
Synopsis
Diffusion tensor distribution (DTD) imaging was applied in a pilot study to investigate the potential for breast tumor grading in a clinical setting. The method relies on advanced gradient waveforms to encode the signal with information about cell densities, shapes, and orientations, and quantify tissue composition as a probability distribution in a space with dimensions analogous to the cellular ones. Five patients with ductal carcinoma underwent a <4 min DTD protocol giving voxel-resolved distributions and parameter maps with microstructural information not accessible with conventional methods, thereby encouraging future studies with larger patient groups and comparison with current gold standards.
Introduction
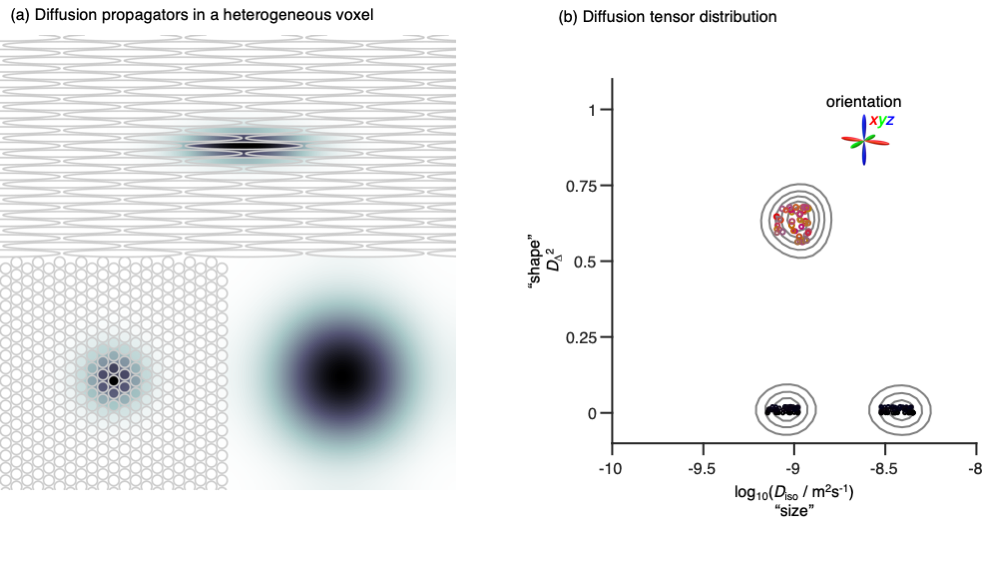
Conventional diffusion MRI gives information about tissue microstructure via the metrics mean diffusivity (MD), mean kurtosis (MK), and fractional anisotropy (FA), which report on, respectively, cell density,1 "tissue complexity",2 and a combination of cell shapes and alignment.3 Compared to both healthy breast tissues and benign lesions, malignant tumors display lower MD and higher MK.4 Somewhat unexpectedly, FA is low throughout breast tissues and lesions,5 indicating that the abundance of elongated structures, such as ducts, lobules, and stroma, have too permeable cell membranes or lack sufficient orientational order to induce water diffusion anisotropy on the length scales of the imaging voxels. Despite great potential for revealing microstructural features, the conventional diffusion MRI metrics are too ambiguous for straightforward interpretation.We have recently shown that encoding and processing strategies from solid-state6 and low-field7 NMR can be translated to a diffusion MRI context,8 yielding diffusion tensor distributions (DTDs)9 with dimensions "size" Diso, "shape" DΔ2, and orientation (θ,φ) corresponding to cell density, shape, and orientation (see Fig 1). While conventional diffusion MRI can be performed with off-the-shelf pulse sequences, our approach requires customised sequences that only recently have become available on most platforms. Here we apply DTD imaging10 on five patients with ductal carcinoma in order to elucidate the microstructural origin of previous conventional results and investigate the potential utility for breast tumor grading.
Methods
This IRB-approved prospective study included 5 patients (mean age 49.8) with suspected lesions. All the patients consented to follow a state-of-the-art breast MRI including the diffusion weighted sequence called random walking imaging (RWI). Five malignant lesions (4 invasive ductal carcinomas and 1 ductal carcinomas in situ) were found. The mean lesion size was 41.8 mm. Histopathology through a biopsy performance was considered the gold standard.MRI measurements were performed on a GE MR750 3T system equipped with a 16 channel breast coil. Images were acquired with a spin echo-prepared EPI sequence with numerically optimised gradient waveforms11,12 using TE=97.8ms, TR=3000ms, FOV= 35x35cm, matrix size=128x128; in-plane resolution=2.7mm, 20 slices with thickness=4mm; for 43 directional and 37 isotropic diffusion encodings at b-values 100, 700, 1400, and 2000 s/mm2, in 43 distinct directions, giving an acquisition time of 3:52.
For every voxel, Monte Carlo data inversion with bootstrapping13 was applied to estimate a set 96 different DTDs consistent with the acquired signal data. The DTDs were converted to parameter maps by binning and calculation of statistical descriptors.10
Results & Discussion
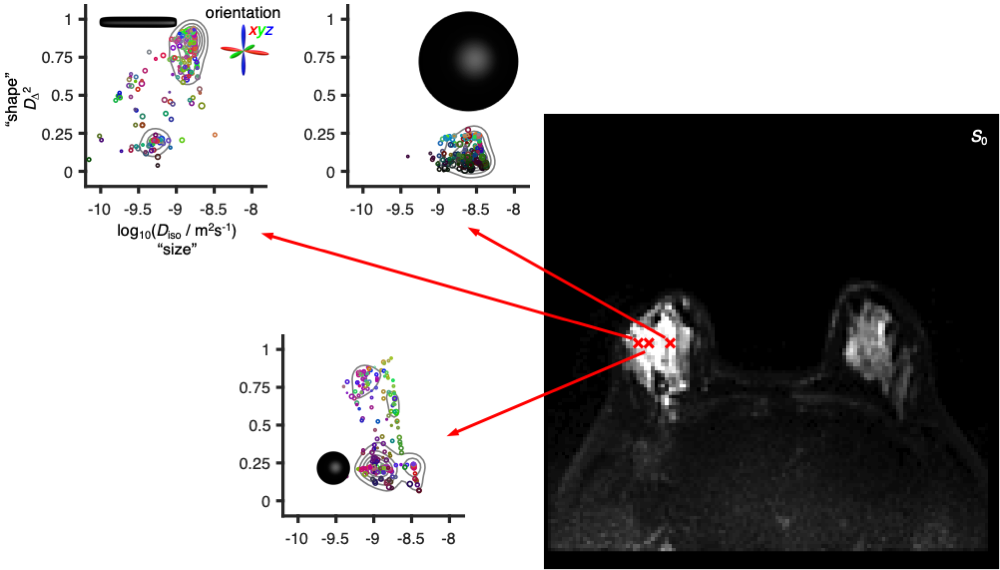
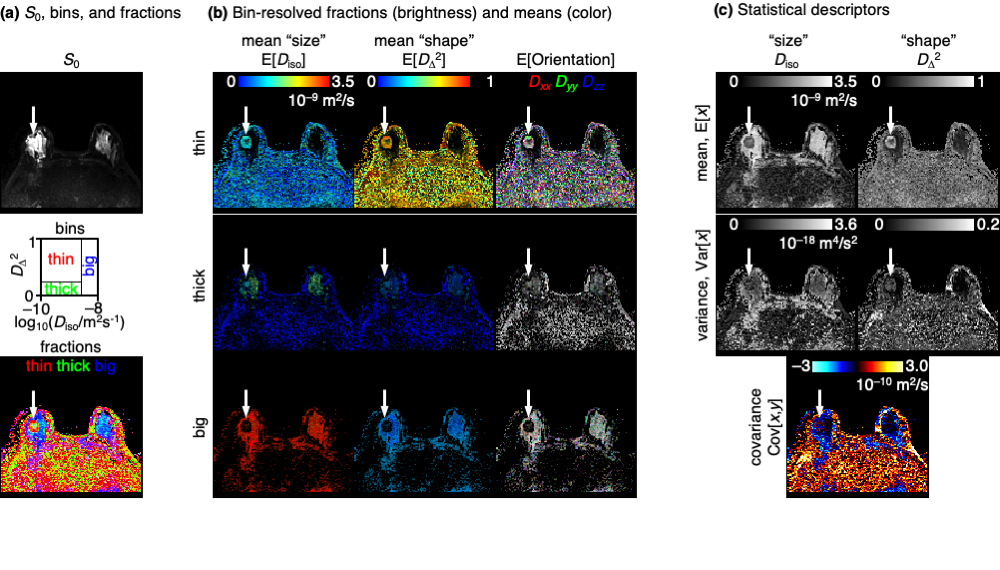
Fig 2 shows DTDs for three selected voxels in a ductal carcinoma patient. Although the voxels have nearly equal intensity in the T2-weighted S0 map, the DTDs are distinctly different, with the right voxel dominated by components with high "size" and low "shape", indicating free water, the middle voxel featuring components with low "size" and high "shape", corresponding to water in elongated cells, and the left voxel having components with low "size" and low "shape" hinting at densely packed isotropic cells (see fig 1).The per-voxel DTDs are converted to 16 parameter maps as shown in Fig 3. The DTD space is divided into bins, with the descriptive labels thin, thick, and big, aiming to capture the distinct components observed in Fig 2. The color-coded fractions map reveal the tumor as a spherical object having a core-and-shell structure with thick components in the interior and thin components at the surface facing the healthy breast tissue dominated by big components. The "sizes", "shapes", and orientations of the thin components in the shell can be discerned from the bin-resolved means maps in Fig 3(b). Of particular note is the low orientational order in the mean orientation map (faint color), consistent with earlier observations of low values of the conventional FA metric which is notorious for convolving the effects of diffusion tensor "shape" and orientation.3,14 Correspondingly, the combination of high "shape" and low orientational order corresponds to high MK in agreement with previous observations.4 The statistical descriptor maps in Fig 3(c) include the mean "size" which is identical to the conventional MD metric and shows low values in the tumor.
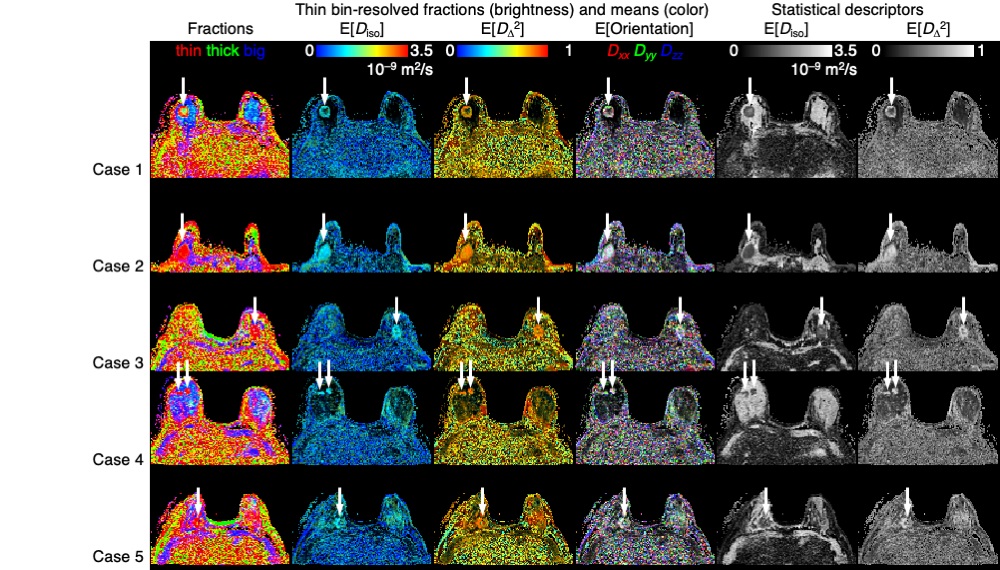
Out of the 16 maps in Fig 3, the six maps in which the tumor is most conspicuous are selected for comparing the five different cases in Fig 4. Consistently, the tumors are all characterised by low "size", high "shape", and low orientational order, which is in agreement with previous results, but adds new insights into the microstructural origins of the observations.
Conclusions
Diffusion tensor distribution imaging was applied as a <4 min acquisition protocol in a clinical setting, giving novel insights into the microstructural origins of previous observations of high MK and low FA in breast tumors. The method relies on advanced gradient waveforms to resolves tissue components based on the "sizes", "shapes", and orientations of their diffusion tensors, and provides scalar metrics with intuitive relations to the underlying tissue and cell structure. The new metrics quantify fundamentally different microstructural properties that are inextricably entangled in conventional diffusion MRI. This pilot study indicates the potential of the new metrics for detailed breast tumor grading, and warrants future studies with larger patient groups and comparison with current gold standards such as histopathology and molecular characterization.15Acknowledgements
This work was financially supported by the NIH/NCI Cancer Center Support Grant (P30 CA008748), the Breast Cancer Research Foundation, Swedish Foundation for Strategic Research (AM13-0090, ITM17-0267) and the Swedish Research Council (2018-03697). KB and DT own shares in Random Walk Imaging AB (Lund, Sweden, http://www.rwi.se/), holding patents related to the described methods.References
1. Cauteren M, Collins D, Hammoud DA, Rustin GJS, Taouli B, Choyke PL. Diffusion-weighted magnetic resonance imaging as a cancer biomarker: Consensus and recommendations. Neoplasia 2009;11:102-125.
2. Van Cauter S, Veraart J, Sijbers J, Peeters RR, Himmelreich U, De Keyzer F, Van Gool SW, Van Calenbergh F, De Vleeschouwer S, Van Hecke W, Sunaert S. Gliomas: Diffusion kurtosis MR imaging in grading. Radiology 2012;263:492-501.
3. Jones DK, Knosche TR, Turner R. White matter integrity, fiber count, and other fallacies: the do's and don'ts of diffusion MRI. Neuroimage 2013;73:239-254.
4. Wu D, Li G, Zhang J, Chang S, Hu J, Dai Y. Characterization of breast tumors using diffusion kurtosis imaging (DKI). PLoS One 2014;9:e113240.
5. Partridge SC, Ziadloo A, Murthy R, White SW, Peacock S, Eby PR, DeMartini WB, Lehman CD. Diffusion tensor MRI: Preliminary anisotropy measures and mapping of breast tumors. J Magn Reson Imaging 2010;31:339-347.
6. Frydman L, Chingas GC, Lee YK, Grandinetti PJ, Eastman MA, Barrall GA, Pines A. Variable-angle correlation spectroscopy in solid-state nuclear magnetic resonance. J Chem Phys 1992;97:4800-4807.
7. Prange M, Song YQ. Quantifying uncertainty in NMR T2 spectra using Monte Carlo inversion. J Magn Reson 2009;196:54-60.
8. Topgaard D. Multidimensional diffusion MRI. J Magn Reson 2017;275:98-113.
9. Jian B, Vemuri BC, Özarslan E, Carney PR, Mareci TH. A novel tensor distribution model for the diffusion-weighted MR signal. Neuroimage 2007;37:164-176.
10. Topgaard D. Diffusion tensor distribution imaging. NMR Biomed 2019;32:e4066.
11. Sjölund J, Szczepankiewicz F, Nilsson M, Topgaard D, Westin C-F, Knutsson H. Constrained optimization of gradient waveforms for generalized diffusion encoding. J Magn Reson 2015;261:157-168.
12. Szczepankiewicz F, Westin CF, Nilsson M. Maxwell-compensated design of asymmetric gradient waveforms for tensor-valued diffusion encoding. Magn Reson Med 2019;82:1424-1437.
13. de Almeida Martins JP, Topgaard D. Multidimensional correlation of nuclear relaxation rates and diffusion tensors for model-free investigations of heterogeneous anisotropic porous materials. Sci Rep 2018;8:2488.
14. Lasič S, Szczepankiewicz F, Eriksson S, Nilsson M, Topgaard D. Microanisotropy imaging: quantification of microscopic diffusion anisotropy and orientational order parameter by diffusion MRI with magic-angle spinning of the q-vector. Front Physics 2014;2:11.
15. Leithner D, Bernard-Davila B, Martinez DF, Horvat JV, Jochelson MS, Marino MA, Avendano D, Ochoa-Albiztegui RE, Sutton EJ, Morris EA, Thakur SB, Pinker K. Radiomic signatures derived from diffusion-weighted imaging for the assessment of breast cancer receptor status and molecular subtypes. Mol Imaging Biol 2019.
Figures