4883
Diffusion fractional anisotropy in peritumoral edema of triple negative breast cancer1Imaging Physics, MD Anderson Cancer Center, Houston, TX, United States, 2Abdominal Imaging, MD Anderson Cancer Center, Houston, TX, United States, 3Cancer Systems Imaging, MD Anderson Cancer Center, Houston, TX, United States, 4Breast Imaging, MD Anderson Cancer Center, Houston, TX, United States, 5Investigational Cancer Therapeutics, MD Anderson Cancer Center, Houston, TX, United States, 6Breast Medical Oncology, MD Anderson Cancer Center, Houston, TX, United States
Synopsis
Diffusion fractional anisotropy and ADC were compared between tumors, peritumoral edema, and fibroglandular tissue in triple negative breast cancer. Fractional anisotropy in the peritumoral edema of triple negative breast cancer did not correlate strongly with ADC and may offer additional characterization of peritumoral edema.
INTRODUCTION
Fractional anisotropy (FA) by Diffusion Tensor Imaging (DTI) provides a measure of the orientational difference of water diffusion in tissues and has been successfully used as a marker for the axonal structural integrity in the brain. In the breast, FA provides potentially a new contrast between fibroglandular tissue (FGT) and tumor1 and has been reported as useful for applications in breast cancer medicine2,3. We hypothesize that FA may also be useful for characterizing breast cancer peritumoral edema (PE), which is an inflammatory region surrounding an aggressively growing tumor and of great interest in determining the recurrence or invasiveness in breast cancer. In this study, we aimed to compare FA and ADC in tumor, PE, and FGT of triple negative breast cancer (TNBC).METHODS
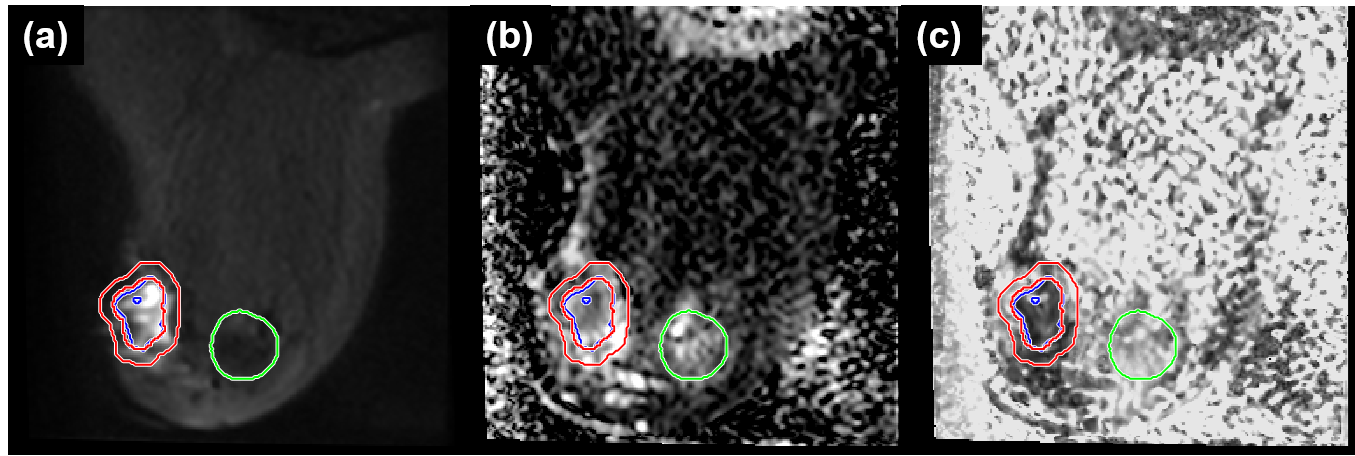
Twenty-one therapy-naïve patients with biopsy-confirmed TNBC were enrolled in an IRB-approved prospective study. All patients underwent pre-treatment MRI on a 3.0T GE MR750w scanner (Waukesha, Wisconsin). The MRI scans included T2W and dynamic contrast enhanced (DCE) sequences as well as a DTI sequence. The DTI sequence utilized FOCUS4 excitation with a single-shot echo planar imaging (ssEPI) readout and the following scan parameters: TR/TE = 4000/65 msec, matrix size = 80×80, FOV = 16x16 cm, slice thickness = 5 mm, slice gap = 0, NEX = 4, b-values = 0, 600 s/mm2, diffusion encoding directions = 20. ADC and FA maps were calculated using vendor-provided software and assumed mono-exponential diffusion.Regions of interest (ROI’s) were contoured on the largest cross section of tumors by an experienced breast radiologist (Fig. 1). Care was taken to exclude areas of necrosis or clip artifact. After the tumor contour, the tumor ROI edges were dilated by 5 mm to create a second ROI that includes PE. Areas of fat were excluded from this ROI. Finally, a third ROI was placed over a region of FGT. Median values of ADC and FA were extracted from each region. ADC and FA were separately compared between the different pairings of the tumor, PE and FGT on a patient-wise basis using the Wilcoxon signed-rank test. Correlation between ADC and FA was assessed for tumor, PE, FGT, and PE/FGT ratios using Spearman’s correlation. P-values below 0.05 were considered statistically significant.
RESULTS
On a patient-wise basis, tumor ADC was significantly lower than that of PE or FGT (pWSR = 0.0001 and 0.022, respectively). Additionally, there was a near significant trend of higher ADC in PE as compared to FGT (pWSR = 0.065, Fig. 2a). Tumor FA was significantly lower than the FA of PE or FGT (pWSR = 0.0003 and 0.0042, respectively). However, there was no significant difference of FA between PE and FGT (pWSR=0.49, Fig. 2b). The average of median ADC (x 10-3) for all patients were as follows: ADCtumor = 1.24+/- 0.18, ADCPE = 1.61 +/- 0.32, ADCFGT = 1.50+/-0.43. The average FA for all patients were FAtumor = 0.243+/- 0.044, FAPE = 0.314 +/- 0.064, FAFGT = 0.313+/-0.107.ADC and FA showed a negligible correlation for tumors (ρ = -0.14, Fig. 3a), and only a moderate negative correlation for PE and FGT (ρ = -0.65 and -0.69, respectively, Fig. 3b, c). Ratios between PE and FGT of ADC and FA showed only a moderate negative correlation (ρ = -0.60, Fig. 3d). Patients with PE/FGT ADC lower than unity tended to have PE/FGT FA greater than unity.
DISCUSSION
The FA values of tumors and FGT in our study are consistent with those reported in literature1. Comparisons of FA between PE and FGT were variable across patients, while the ADC of PE was in general higher than the ADC of FGT. Interestingly, only a moderate correlation was seen between PE/FGT ratios of ADC and FA. For patients whose PE ADC was lower than the FGT ADC, FA was higher in PE than FGT. Because of this, FA may provide additional or different characterization of PE compared to ADC.Acknowledgements
No acknowledgement found.References
1. Partridge SC, Ziadloo A, Murthy R,et al. Diffusion tensor MRI: preliminary anisotropy measures and mapping of breast tumors. Journal of magnetic resonance imaging : JMRI 2010;31(2):339-347.
2. Jiang R, Ma Z, Dong H, et al. Diffusion tensor imaging of breast lesions: evaluation of apparent diffusion coefficient and fractional anisotropy and tissue cellularity. The British journal of radiology 2016;89(1064):20160076.
3. Furman-Haran E, Nissan N, Ricart-Selma V, et al. Quantitative evaluation of breast cancer response to neoadjuvant chemotherapy by diffusion tensor imaging: Initial results. Journal of magnetic resonance imaging : JMRI 2018;47(4):1080-1090.
4. Saritas EU, Cunningham CH, Lee JH,
et al. DWI of the spinal cord with reduced FOV single-shot EPI. Magnetic
resonance in medicine 2008;60(2):468-473.
Figures