4881
Breast tumor response on dynamic contrast-enhanced MRI after single dose neoadjuvant partial breast irradiation
Maureen Groot Koerkamp1, Jeanine Vasmel1, Stefano Mandija1,2, Marielle Philippens1, Ramona Charaghvandi3, Maaike Moman4, Wouter Veldhuis4, Celien Vreuls5, Paul van Diest5, Arjen Witkamp6, Ronald Koelemij7, Annemiek Doeksen7, Thijs van Dalen8, Elsken van der Wall9, Helena Verkooijen10, Jan Lagendijk1, Bram van Asselen1, Desiree van den Bongard1, and Anette Houweling1
1Radiotherapy, UMC Utrecht, Utrecht, Netherlands, 2Computational Imaging Group for MR diagnostic & therapy, UMC Utrecht, Utrecht, Netherlands, 3Radiotherapy, Radboudumc, Nijmegen, Netherlands, 4Radiology, UMC Utrecht, Utrecht, Netherlands, 5Pathology, UMC Utrecht, Utrecht, Netherlands, 6Surgical Oncology, UMC Utrecht, Utrecht, Netherlands, 7Surgery, St. Antonius, Utrecht, Netherlands, 8Surgery, Diakonessenhuis, Utrecht, Netherlands, 9Medical Oncology, UMC Utrecht, Utrecht, Netherlands, 10Epidemiology, UMC Utrecht, Utrecht, Netherlands
1Radiotherapy, UMC Utrecht, Utrecht, Netherlands, 2Computational Imaging Group for MR diagnostic & therapy, UMC Utrecht, Utrecht, Netherlands, 3Radiotherapy, Radboudumc, Nijmegen, Netherlands, 4Radiology, UMC Utrecht, Utrecht, Netherlands, 5Pathology, UMC Utrecht, Utrecht, Netherlands, 6Surgical Oncology, UMC Utrecht, Utrecht, Netherlands, 7Surgery, St. Antonius, Utrecht, Netherlands, 8Surgery, Diakonessenhuis, Utrecht, Netherlands, 9Medical Oncology, UMC Utrecht, Utrecht, Netherlands, 10Epidemiology, UMC Utrecht, Utrecht, Netherlands
Synopsis
Radiologist assessment and quantitative dynamic contrast-enhanced (DCE) MRI analysis were used to determine if changes in these parameters could predict pathologic complete response to single ablative dose neoadjuvant partial breast irradiation. 3.0T DCE MRI scans in prone position were obtained pre-radiotherapy (RT), and 1 week, 2, 4, 6, and, if applicable, 8 months post-RT. Quantitative analysis showed an increase of relative enhancement 1 week after RT followed by a decrease at later time points which indicates acute tissue response and tumor regression, respectively. Both radiologist assessment (n=36) and quantitative analysis (n=27) could not predict pathologic response.
Introduction
Dynamic contrast-enhanced (DCE) MRI is clinically used to assess response to neoadjuvant systemic treatment. In this study, we evaluated if changes in DCE MRI acquired after single ablative dose neoadjuvant partial breast irradiation (NA-PBI) could predict pathologic response.Methods
MRI scans were obtained from 36 low-risk breast cancer patients participating in a single dose NA-PBI trial. Patients received single dose NA-PBI with 20Gy to the gross tumor volume (GTV) and 15Gy to the clinical target volume (GTV+2cm margin). NA-PBI was followed by breast conserving surgery (BCS) after an interval of 6 or 8 months. Pathologic response was then assessed according to EUSOMA criteria1. Patients were divided in two groups: pathologic complete response (pCR; n=15) and no pCR (n=21).Patients underwent 3.0T MRI scans (Ingenia, Philips, Best, The Netherlands) in prone position pre-radiotherapy (RT), 1 week post-RT, and 2, 4, 6, and, if applicable, 8 months post-RT for clinical follow-up before BCS. The protocol included two DCE series: a high-spatial/low-temporal resolution series (hereafter defined as ”slow”: 1 pre- and 5 post-contrast-injection images, acquired voxel size: 1.0x1.0x1.8mm3, 1.35 minute intervals post-contrast) and a low-spatial/high-temporal resolution series (“fast”: 17 images, 2.6x2.6x6.0mm3, 5 seconds interval). The latter was acquired between the pre- and the first post-contrast-injection image of the slow series (Fig. 1).
Radiologist assessment
Breast radiologists assessed radiologic response on MRI (e.g. DCE, DWI) according to clinical practice in neoadjuvant systemic treatment. The positive predictive value (PPV, probability that radiologic complete response predicts pCR) and negative predictive value (NPV, the probability that absence of radiologic complete response predicts residual disease) were calculated for the last MRI before BCS.
Quantitative assessment
The GTV was manually delineated on the pre-RT DCE MRI. Rigid registration using Elastix2,3 was performed to rigidly transform the delineation of the GTV on the pre-RT MRI to the post-RT MRIs. Patients were included in the analysis when transformation of the pre-RT delineation was visually acceptable on at least 3 post-RT MRIs. Rigid registration was also used to correct for intra-scan motion in both the slow and fast series. GTV delineations were expanded with a 1-voxel margin to account for delineation and registration inaccuracies.
The relative enhancement (RE) for the slow and fast series was determined as $$$RE(t) = \frac{SI(t)-SI(0)}{SI(0)}*100\%$$$; where SI is the signal intensity per voxel, t=0 is the pre-contrast-injection image and t>0 are the post-contrast-injection images.
Within the GTV, we determined the percentage of voxels with >50% RE, the wash-in (90th percentile RE within the GTV at the first post-contrast-injection slow image and at 1 minute post-contrast-injection in the fast series) and the area under the curve for 90th percentile post-contrast curves (AUCslow and AUCfast) (Fig. 1). Additionally, the distribution of enhancement curve types describing the contrast wash-out4 (RE difference between first and last post-contrast-injection slow images) was evaluated for voxels with >50% RE. Wash-out was divided in three types indicating the probability of malignancy: type 1 (≥+10% RE) – low, type 2 (-10% to +10% RE) – intermediate, and type 3 (≤-10% RE) – high probability of malignancy. Median and interquartile range values were computed and compared across subjects.
Results
Radiologist assessment (n=36) showed a PPV of 67% and an NPV of 76% at the last MRI before BCS. The quantitative relative enhancement parameters (n=27) showed an initial increase followed by a decrease at later time points which can also be identified from visible inspection of the MRI scans over time (Fig. 2). The median percentage of voxels with >50% RE increased from 76% pre-RT to 81% at 1 week post-RT and decreased to 47% at 6 and 48% at 8 months post-RT (Fig. 3). Median wash-in decreased from 181% (slow) and 148% (fast) pre-RT to 103% and 75% at 6 and 110% and 108% at 8 months post-RT respectively (Fig. 4). The AUC response showed a similar pattern as the wash-in. A decrease from 13% pre-RT to 3% (at 6 and 8 months post-RT) in percentage of voxels with type 3 wash-out curve was observed (Fig. 5). Quantitative parameters did not differ between pathologic response groups.Discussion
Changes in quantitative parameters describing wash-in and wash-out in DCE MRI were observed after single ablative dose NA-PBI. The slow and fast series showed similar patterns of response. All parameters indicated an increase in relative enhancement in the first week after RT, which can be explained by acute tissue response, i.e. edema, caused by RT. At later time points a decrease in enhancement and a slower wash-out pattern was observed, which indicates tumor regression. Although no differences were observed between pathologic response groups, 1 week post-RT response in the percentage of type 3 wash-out voxels showed a promising pattern for response prediction. Therefore, we would recommend to include an early response evaluation in future research on quantitative response assessment of NA-PBI.Conclusion
Radiologist assessment had a low predictive value for pathologic response and a moderate value for predicting absence of pathologic response. Further quantitative evaluation of DCE MRI showed no differences between pathologic response groups. Therefore, radiologic response on MRI could not predict pathologic response after single dose NA-PBI in this low-risk patient group.Acknowledgements
The authors would like to thank BHM van der Velden, KGA Gilhuijs, JP Wijnen, and ALHMW van Lier for their contributions on methods for image processing, image registration and quantitative analysis of MRI that were used for this study.References
- Perry N, Broeders M, Wolf C de, et al. Executive summary. In: European guidelines for quality assurance in breast cancer screening and diagnosis. Fourth edition, Supplements. European Commission, Office for Official Publications of the European Union, Luxembourg, pp. XIV–XX.
- S. Klein, M. Staring, K. Murphy, et al. elastix: a toolbox for intensity based medical image registration. IEEE Transactions on Medical Imaging. 2010;29(1):196-205.
- D.P. Shamonin, E.E. Bron, B.P.F. Lelieveldt, et al. Fast Parallel Image Registration on CPU and GPU for Diagnostic Classification of Alzheimer’s Disease. Frontiers in Neuroinformatics. 2014;7(50):1-15.
- Degani H, Gusis V, Weinstein D, et al. Mapping pathophysiological features of breast tumors by MRI at high spatial resolution. Nat Med 1997;3(7):780-2.
Figures
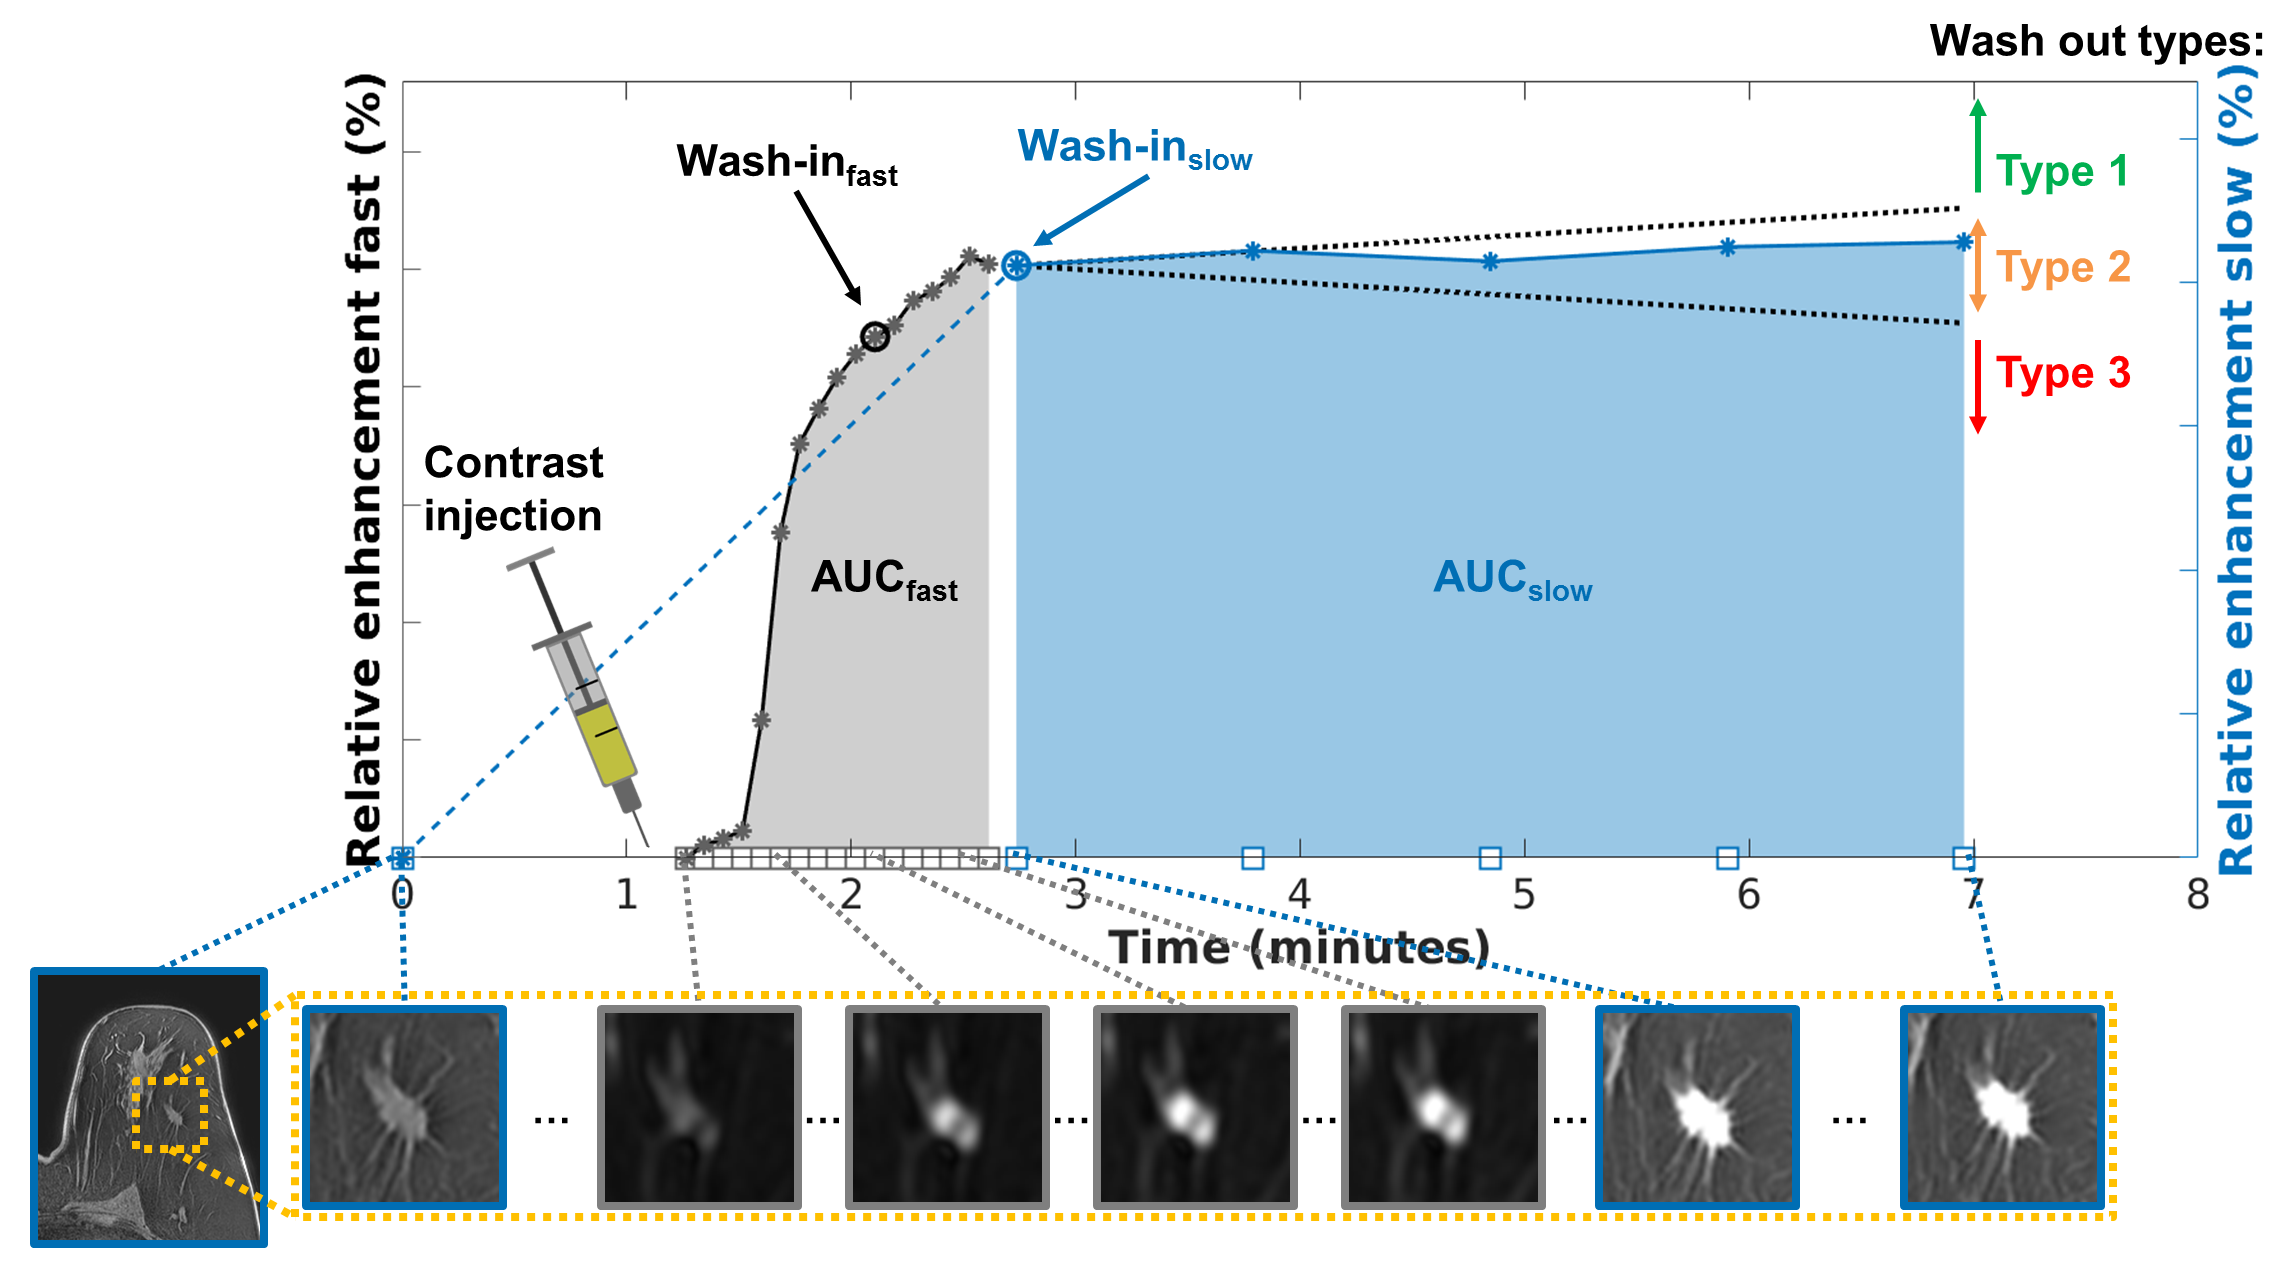
Figure 1. Relative enhancement curves within the GTV that are acquired from the slow dynamic (blue) and fast dynamic (grey) series. Several scans from both series (blue outline: slow, grey outline: fast series) are shown below the graph, the tumor is visible in between the yellow dotted lines. Also parameters that were quantified from these curves are shown: wash-inslow, wash-infast, AUCslow, AUCfast and cut-off boundaries (-10% and +10% relative enhancement) for type 1, 2 or 3 wash-out curve voxel classification.

Figure 2. DCE MRI scans and relative enhancement curves of a representative patient with left-sided breast cancer illustrating a decrease in contrast enhancement over time after RT. The yellow line shows the GTV delineation that was made on the pre-RT DCE MRI scan and transferred to the post-RT scans with a rigid registration. This patient showed no radiologic complete response and no pathologic complete response.

Figure 3. Percentage of GTV voxels showing >50% relative enhancement grouped to pathologic response (median ± IQR). From pre-RT up to 6 months post-RT 8 to 16 scans were assessable per pathologic response group. At 8 months post-RT 6 scans were assessable per pathologic response group.

Figure 4. 90th percentile of contrast wash-in within the GTV (top: slow, bottom: fast) grouped to pathologic response (median ± IQR). From pre-RT up to 6 months post-RT 8 to 17 scans were assessable per pathologic response group. At 8 months post-RT 5 to 6 scans were assessable per pathologic response group.
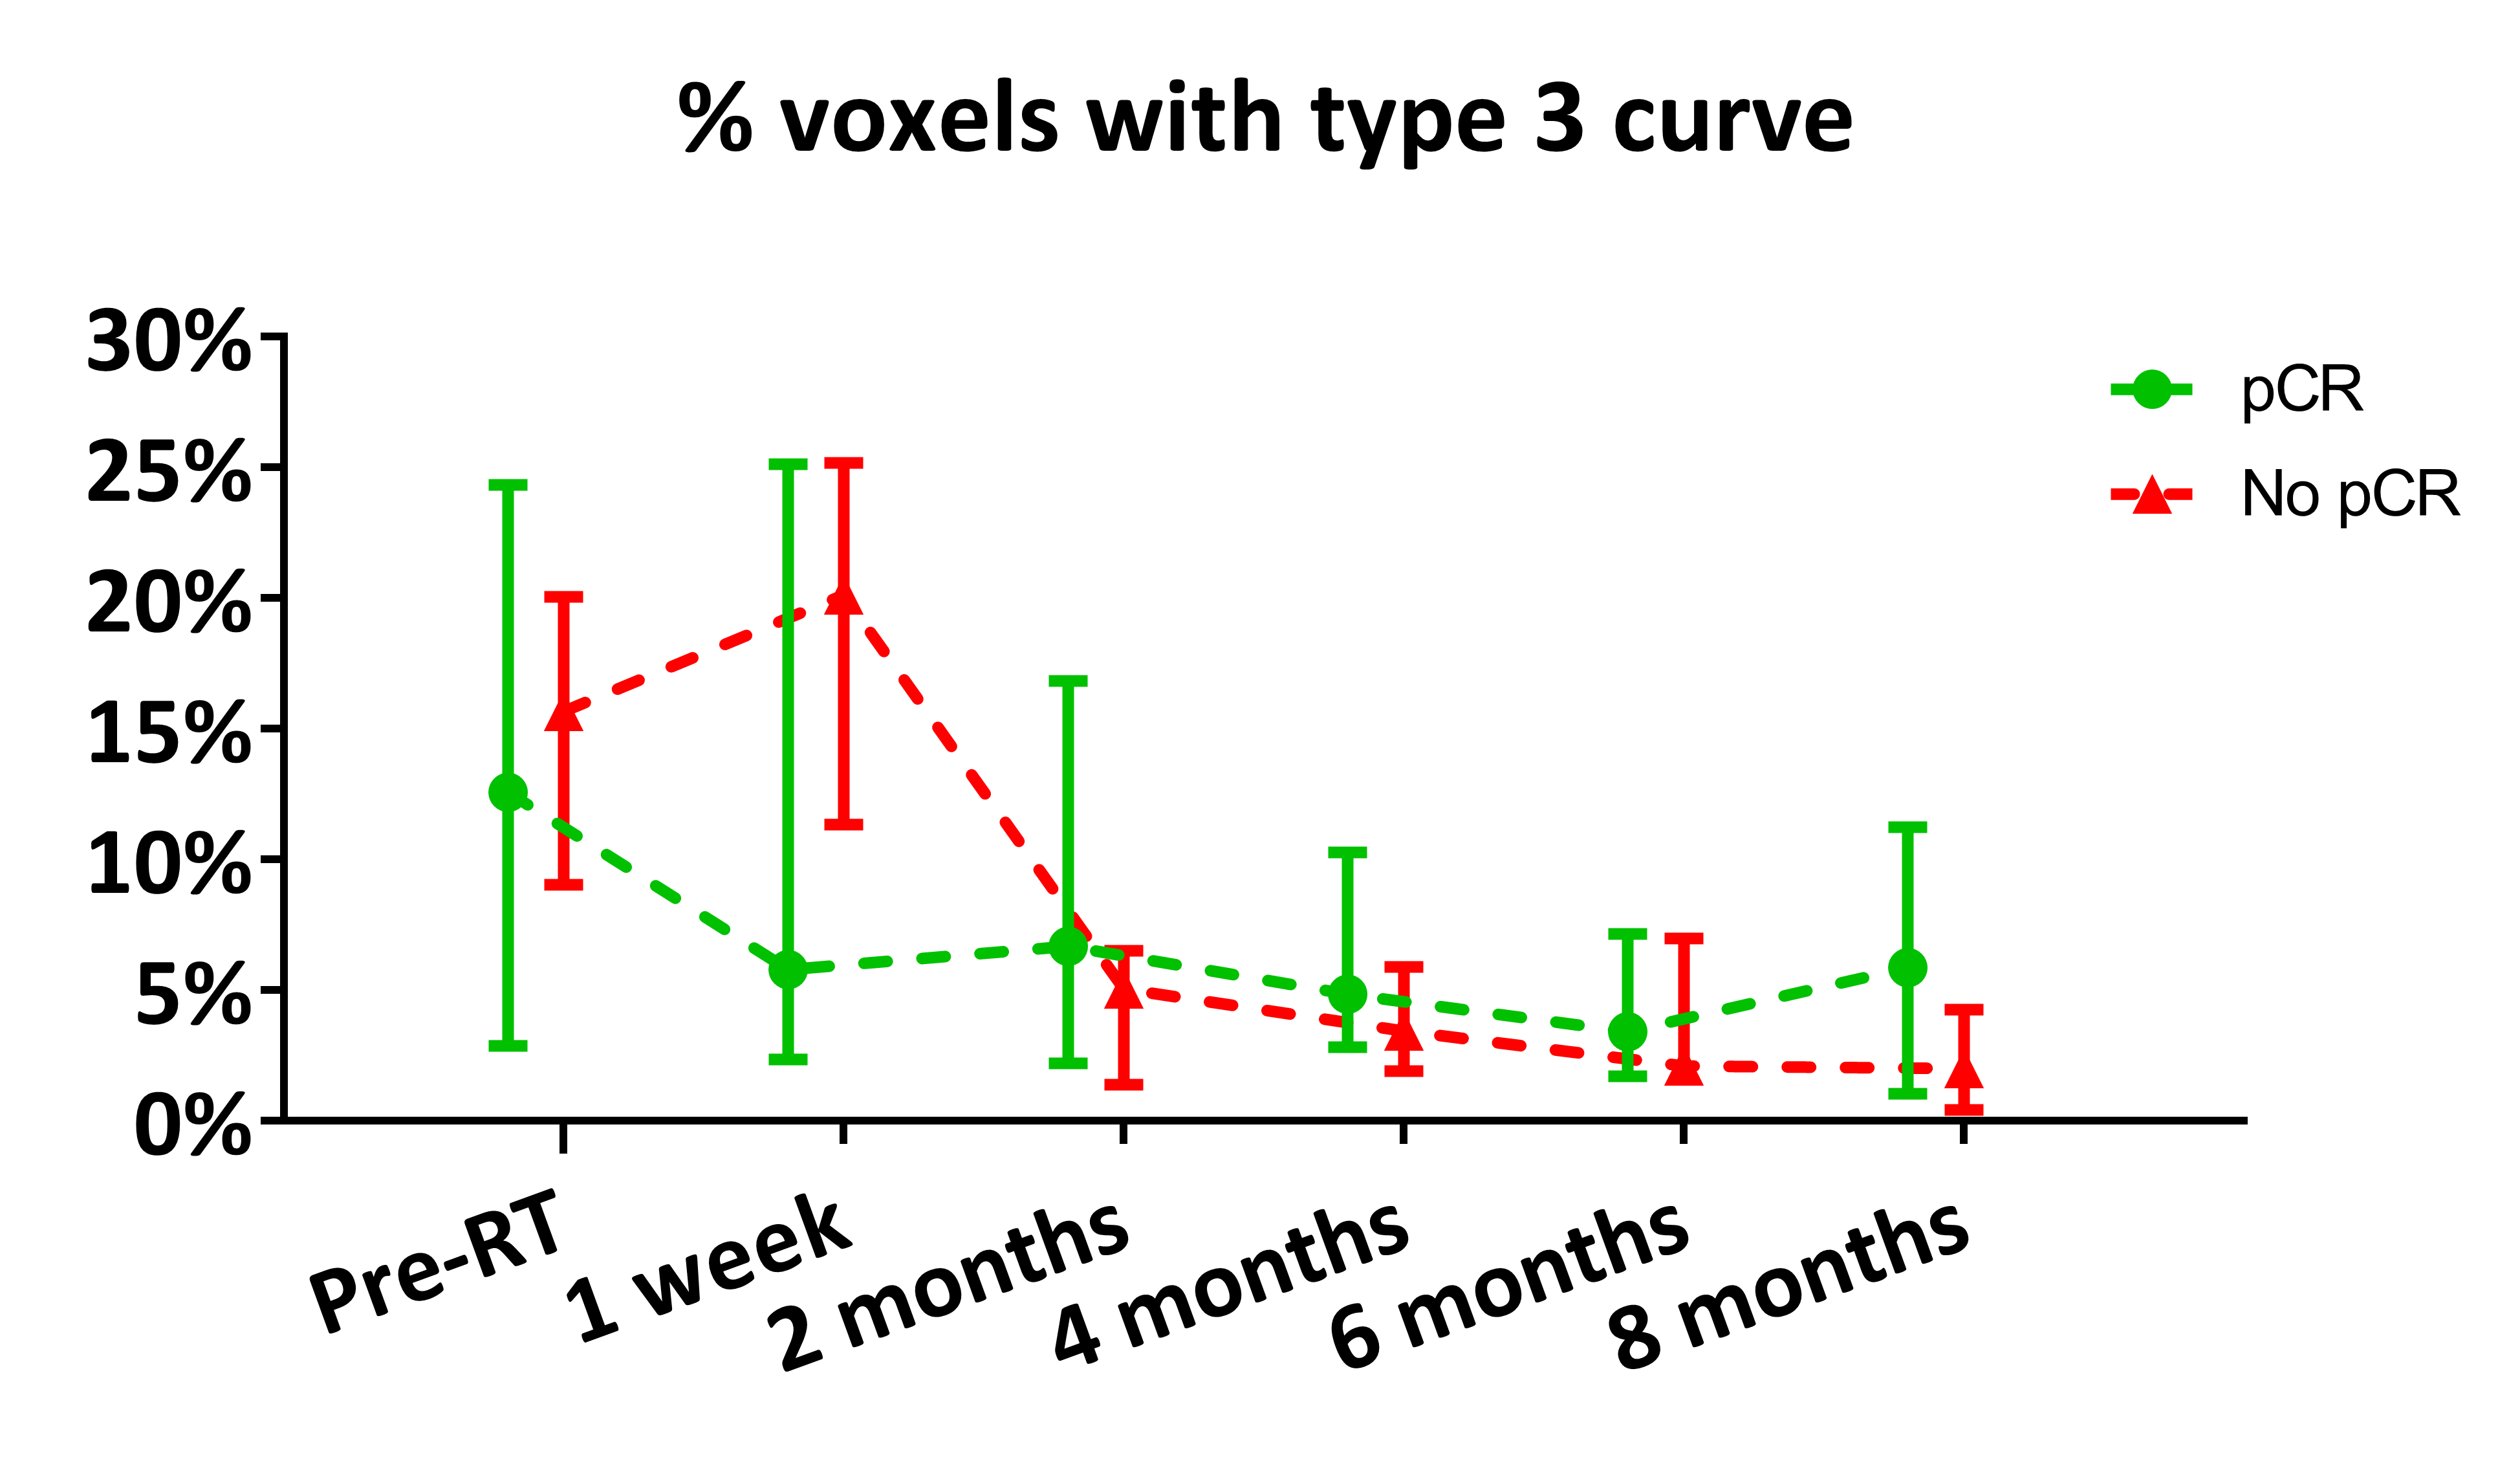
Figure 5. Percentage of GTV voxels with a type 3 wash-out curve (high probability for malignancy) grouped to pathologic response (median ± IQR). From pre-RT up to 6 months post-RT 8 to 17 scans were assessable per pathologic response group. At 8 months post-RT 6 scans were assessable per pathologic response group.