4874
Molecular Effects of Chemotherapeutic Agents on Choline Phospholipid Metabolism of Triple Negative Breast Cancer Cells
Caitlin M Tressler1, Kanchan Sonkar1, Vinay Ayyappan1, Menglin Cheng1, and Kristine Glunde1
1Johns Hopkins University, Baltimore, MD, United States
1Johns Hopkins University, Baltimore, MD, United States
Synopsis
Magnetic resonance spectroscopy (MRS) of breast cancer patients has shown a significant decrease in total choline (tCho) signal in patients responding to chemotherapy.1-4 Despite the clinical development of tCho as an imaging biomarker for response to chemotherapy, little is known about the molecular mechanism driving this observed change. We examined six chemotherapy agents in two triple negative breast cancer (TNBC) cell lines by high resolution (HR) 1H MRS to determine the impact of chemotherapy treatment on choline metabolites. Furthermore, we have begun to probe the impact of these chemotherapy agents on important genes in choline metabolism using quantitative real-time PCR.
Purpose
Despite documentation that tCho can be used as a noninvasive imaging biomarker to determine early response to chemotherapeutic treatment, little is known about why this change is observed and if the response is due to specific chemotherapeutic agents. Furthermore, three different metabolites, including choline (Cho), glycerophosphocholine (GPC), and phosphocholine (PC), make up the tCho signal. While in vivo imaging often lacks the spectral resolution required to separate these peaks in many cases, changes in the individual metabolite levels may also shed some light on the molecular effects of chemotherapy on choline metabolism.Methods
A panel of clinically relevant chemotherapeutic drugs including doxorubicin (DOX), paclitaxel (PLX), vinorelbine (VRL), melphalan (MPL), cisplatin (CPT), and 5-fluorouracil (5-FU) were examined independently in both MDA-MB-231 and SUM159 TNBC cells. Cells were treated for 48 hours at the IC50 of each drug as determined by WST-1 assay. MDA-MB-231 cells were treated with 5 µM DOX, 150 nM CPT, 75 nM MPL, 400 nM 5-FU, 100 nM VRL, and 50 nM PXL for 48 hours prior to analysis. SUM159 cells were treated with 100 nM DOX, 400 nM CPT, 50 nM MPL, 100 nM 5-FU, 10 nM VRL, and 10 nM PXL. DMSO was used as a vehicle control for both cell lines. Metabolites were extracted using dual-phase extraction (methanol:choloform:water = 2:1:1). High-resolution (HR) 1H MRS of the water-soluble extract fraction was performed on a Bruker 750MHz MR spectrometer. Choline containing metabolites were quantified from MR spectra using Bruker Topspin software with TSP as a standard. RNA was extracted from cells that had undergone the same treatment, was reverse transcribed, and SYBR Green based quantitative PCR was used to detect changes in the mRNA levels of a panel of genes directly involved in choline metabolism.Results
IC50 measurements showed substantial differences in the amount of chemotherapeutic drug each cell line tolerated. With the exception of CPT, SUM159 cells were more sensitive to the tested chemotherapeutic agents. In MDA-MB-231, MPL, 5-FU, and CPT all resulted in a significant decrease in tCho signal as compared to vehicle controls (Figure 1). SUM159 did not show any significant changes in tCho signal. The GPC/PC ratio was also examined, as changes may be occurring within choline metabolism, without a significant change in the tCho signal (Figure 2). MDA-MB-231 cells showed significant changes in the GPC/PC ratio with all chemotherapeutics, except 5-FU. SUM159 cells only showed significant changes with VRL and CPT. To understand the molecular mechanisms of these changes in choline metabolite levels, we are currently examining a panel of choline metabolism genes including choline kinase alpha (ChKα), GDPD5, GDPD6, two choline (CHT and SLC22A2) transporters, PLD1, and PLD2. For MDA-MB-231 cells treated with MPL, 5-FU, and CPT, a significant decrease in GDPD6 mRNA was observed (Figure 3). This indicates that GDPD6 may play a role in the observed decrease in tCho signal. Other genes listed above are currently still being evaluated.Discussion
We have observed a significant decrease in tCho with three chemotherapeutic agents, MPL, 5-FU, and CPT, in MDA-MB-231 cells. In almost all clinical cases, chemotherapeutic agents are given as a cocktail. Danished et al. demonstrated that tCho was notably reduced in patients receiving cocktails containing 5-FU and cyclophosphamide4, which is in good agreement with our MDA-MB-231 data. Our study shows that treatment of TNBC cells with CPT, 5-FU and MPL, a cyclophosphamide alternative, may reduce tCho by downregulating GDPD6 expression levels. Further analysis is currently ongoing to determine the broader picture of other enzymes involved in choline metabolism. Another important finding in our study is that the two different TNBC cell lines tested have significantly different responses to several chemotherapeutic agents in terms of drug sensitivity and modulation of their choline metabolism.Conclusions
We have determined that treatment with some chemotherapeutic agents, including 5-FU resulted in a decrease in the tCho signal in TNBC cells. Furthermore, some chemotherapeutic agents that do not cause a significant drop in tCho, can cause a change in the GPC/PC ratio which may also be used to detect early response to treatment. We are currently exploring the molecular mechanisms of these chemotherapy-induced changes in TNBC, which indicate downregulation of GDPD6 as a contributor to the tCho decrease.Acknowledgements
We thank all members of the Division of Cancer Imaging Research in The Russell H. Morgan Department of Radiology and Radiological Science for their help and support.References
1). Bolan PJ. Magnetic resonance imaging clinics of North America 2013, 21(3):625-639. 2). Hyeon-Man B, et al. Radiology 2009, 251(3):653-662. 3). Sina M, et al. Radiology 2004, 233(2):424-431. 4). Danished K, et al. NMR Biomed. 2010; 23: 233–241.Figures
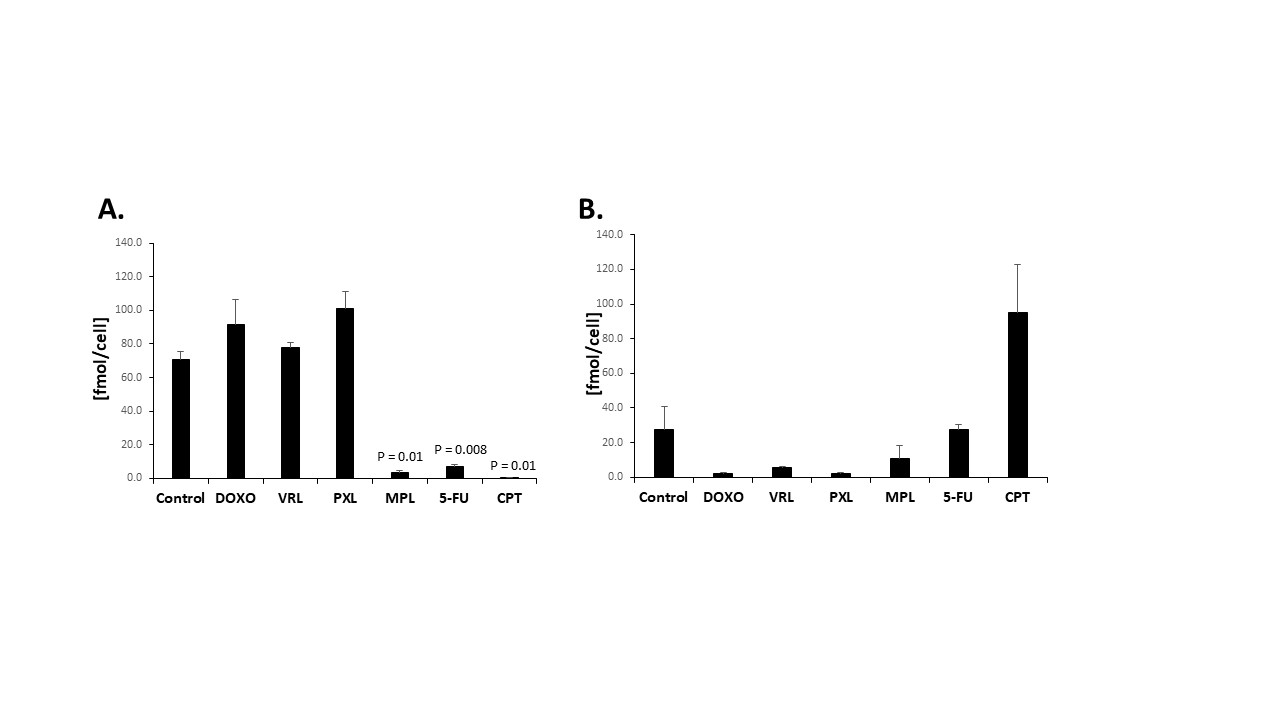
Figure 1: Total choline (tCho)
signal calculated from HR 1H MR
spectra of choline (Cho), glycerophosphocholine
(GPC), and phosphocholine (PC) for triple-negative breast cancer cell lines
MDA-MB-231
(A) and SUM159 (B) after treatment with different chemotherapy drugs for 48
hours. All quantifications represent three biological replicates and error bars
indicate standard deviation. P values were calculated using an unpaired
two-tailed t-test.
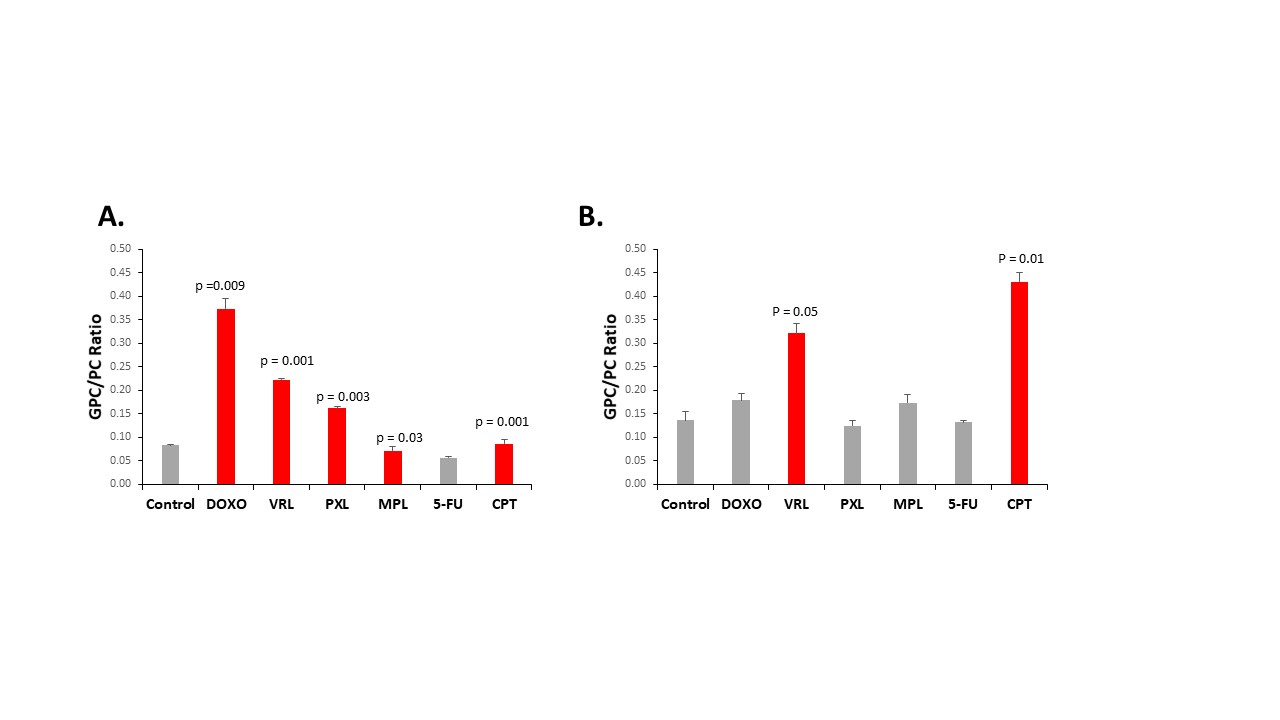
Figure 2: GPC/PC ratio calculated from HR
1H MR spectra for triple-negative
breast cancer cell lines MDA-MB-231 (A) and SUM159 (B) after
treatment with different chemotherapy drugs for 48 hours. All quantifications
represent three biological replicates and error bars indicate standard
deviation. P values were calculated using an unpaired two-tailed t-test.
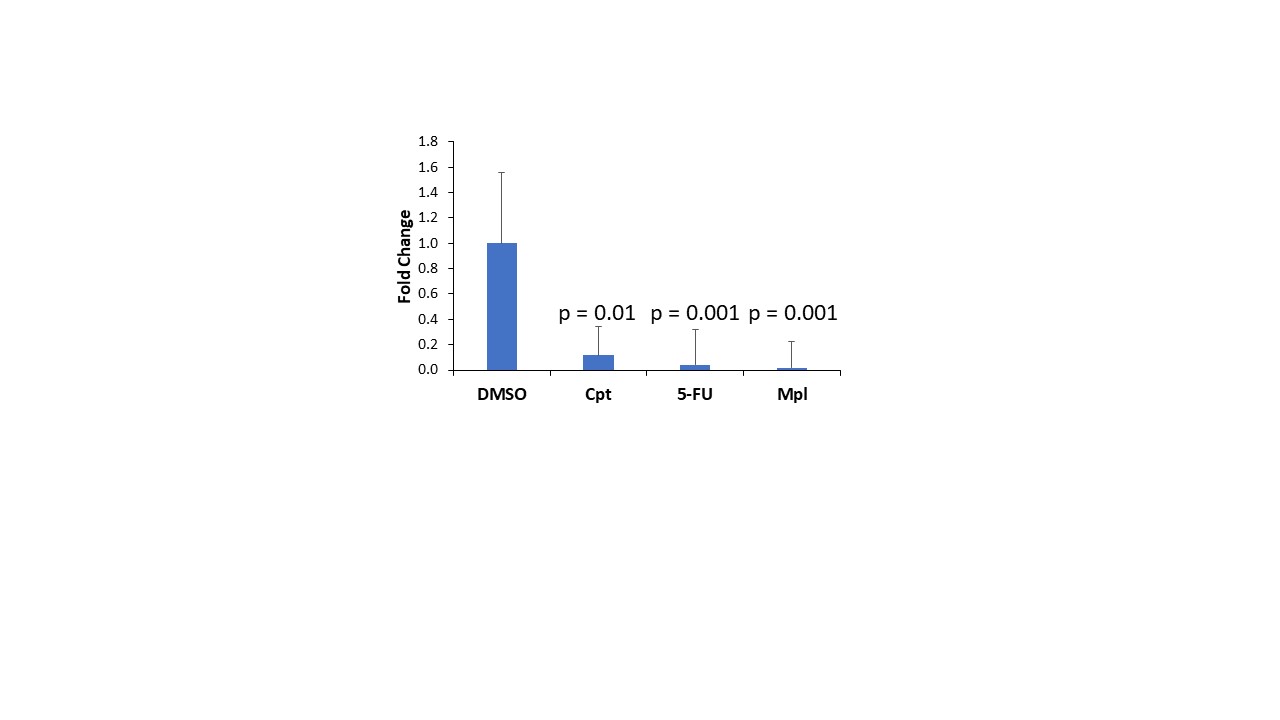
Figure 3: GDPD6 mRNA levels were
significantly decreased in MDA-MB-231 cells treated with chemotherapeutic
agents
which showed significantly reduced tCho. This indicates GDPD6 involvement
in the reduction of choline metabolites due to chemotherapy. All data
represents four biological replicates and two technical replicates. Error bars
represent standard error and p values were calculated using an unpaired
two-tailed t-test.