4871
Lipid composition mapping in whole breast tumour using chemical shift encoded imaging1Aberdeen Biomedical Imaging Centre, University of Aberdeen, Aberdeen, United Kingdom, 2Donders Institute for Brain, Cognition and Behaviour, Radboud University, Nijmegen, Netherlands, 3Breast Unit, Aberdeen Royal Infirmary, Aberdeen, United Kingdom, 4Pathology Department, Aberdeen Royal Infirmary, Aberdeen, United Kingdom
Synopsis
Lipid composition in breast has a major role in breast cancer prevention, with deregulation of lipid metabolism identified in BRCA1/2 genetic mutation carriers. Neoplastic tubule formation can infiltrate adipose tissue in peri-tumoural region, with low tubular differentiation indicating a poorer prognosis. Lipid composition measurement through biochemical extraction is invasive, while conventional chemical shift imaging demands an intolerably long acquisition time. Recent development in gradient-echo (GRE) based imaging allows lipid composition mapping of the whole breast in a clinically acceptable timeframe. We set out to examine the relationship between peri-tumoural lipid composition and tubule formation using GRE-based imaging in breast tumours.
Introduction
Breast cancer is a major societal challenge, and the deregulation of lipid composition in the breast has been suggested as a risk factor1,2. Studies in BRCA1/2 genetic mutation carriers using correlation spectroscopy (COSY) has shown abnormal lipid metabolism in precancer state3. COSY, although providing accurate quantification of lipid composition, is limited to a single spatial location (single voxel) with a lengthy acquisition to collect signals from a full range of correlation times. Recent development in gradient-echo (GRE) based chemical shift-encoded imaging allows lipid composition mapping, utilising the known resonant frequencies of lipids with a theoretical triglyceride molecule structure4-6. We therefore conducted a cross-sectional study to examine the relationship between peri-tumoural lipid composition and tumour tubule formation, an indicator for differentiation from normal breast ducts and lobules, in freshly excised breast tumour.Methods
Twenty patients (9 Score 2 and 11 Score 3 in tubule formation) with invasive breast carcinoma participated in the study. Patients undergoing breast conservation surgery, with a tumour size larger than 10 mm in diameter on mammography, with no previous malignancies, chemotherapy or radiotherapy prior to surgery were eligible. The study was approved by the North West – Greater Manchester East Research Ethics Committee (REC Reference: 16/NW/0221), and signed written informed consents were obtained from all the participants prior to the study (Figure 1).Specimen Preparation
Upon tumour excision, the tissue specimen was immediately transported from operating theatre to Aberdeen Biomedical Imaging Centre in a sealed container. The container was filled with 10 % formalin to prevent tissue degradation and the specimen was immobilised by a custom-built holding harness to prevent displacement during scans.
MRI Acquisition
The MRI data for all 20 excised breast tissue specimens were acquired at room temperature on a 3 T whole body clinical MRI scanner (Achieva TX, Philips Healthcare, Best, Netherlands) using a 32-channel receiver coil for high sensitivity detection and a body coil for uniform transmission. Anatomical images were acquired using standard T1-weighted 3D sequence7 with repetition time (TR) of 5.7 ms, echo time (TE) of 2.9 ms, field of view (FOV) of 141 × 141 mm2, matrix size of 256 × 256, 28 slices, slice thickness of 1.1 mm, parallel acquisition acceleration factor of 1.5. 3D multi-echo GRE data was acquired with a resolution of 2.2 mm isotropic, first TE of 1.14 ms, echo spacing of 1.14 ms, 16 echoes, TR of 20 ms, flip angle of 6° and 9 signal averages.
Data Processing
Regions of interests (ROI) were drawn on GRE images to define the adipose tissue boundary. A theoretical model4 was used to map the number of double bonds in triglyceride molecules from the magnitude GRE data on a pixel-by-pixel basis, from which the fatty acid components, including mean PUFA, MUFA and SFA4,5, were subsequently derived. Fat fraction, defined as the ratio between fat and the sum of fat and water images, was also computed. Statistical analysis was conducted on fat fraction and fatty acid components using the aforementioned ROI together with the following inclusion criteria: (1) fat fraction must be greater than or equal to 60 % and (2) PUFA/MUFA/SFA must not exceed beyond the range between 0 % and 100 %, thus non-adipose tissue and voxels with low SNR did not contribute to the outliers of the analysis.
Statistical Analysis
All statistical analysis was performed in the SPSS software (Release 23.0, SPSS Inc., Chicago, IL, USA). Shapiro-Wilk test for normality was performed on all the collected data. Student’s t-tests were performed on normally distributed data to assess difference in fatty acid components between Score 2 and 3 tubule formation. The correspondence between fatty acid components against tumour size was examined using Pearson’s correlation. A p value < 0.05 was considered statistically significant.
Results
The patient demographics are summarised in Table 1. A significant lower mean fat fraction (p = 0.0200, Table 2, Figure 2a) was found for Score 3 (mean ± SD: 0.84 ± 0.04) compared to Score 2 (0.87 ± 0.02). A significant lower MUFA (p = 0.0119, Table 2, Figure 2b) was found for Score 3 (0.38 ± 0.02) compared to Score 2 (0.40 ± 0.01). A significantly higher SFA (p = 0.0329, Table 2, Figure 2c) was found for Score 3 (0.51 ± 0.04) compared to Score 2 (0.48 ± 0.02). There was no significant difference in PUFA (p = 0.0986, Table 2, Figure 2d) between Score 2 and Score 3.There were no significant correlations between mean fat fraction (p = 0.1537, Table 2, Figure 3a), MUFA (p = 0.0560, Table 2, Figure 3b), SFA (p = 0.0676, Table 2, Figure 3c) and PUFA (p = 0.0968, Table 2, Figure 3d) against tumour size.
Discussion
There was a change in the lipid composition in peri-tumoural zone associated with tumour development. The neoplastic tubule formation, indicating the deviation from normal breast tissue, is associated with structural changes in the tumour and may affect the lipid composition because of the consumption of specific types of lipids for membrane synthesis.Conclusion
Fat mapping in whole breast tumours provides a novel imaging tool to assess tumour development and metabolism in breast cancer.Acknowledgements
The authors would like to thank Dr Matthew Clemence for clinical scientist support, Ms Bolanle Brikinns for patient recruitment support, Ms Dawn Younie for logistic support. This project was funded by NHS Grampian Endowment Research Fund. Sai Man Cheung’s PhD study was jointly supported by Elphinstone scholarship, Roland Sutton Academic Trust and John Mallard scholarship and is currently funded by Cancer Research UK. Nicholas Senn’s PhD study was supported by BBSRC EASTBIO scholarship.
References
1. Nieman KM, Kenny HA, Penicka CV, et al. Adipocytes promote ovarian cancer metastasis and provide energy for rapid tumor growth. Nat Med. 2011;17(11):1498-1503.
2. Wang YY, Attané C, Milhas D, et al. Mammary adipocytes stimulate breast cancer invasion through metabolic remodeling of tumor cells. JCI Insight. 2017;2(4):1-20.
3. Ramadan S, Arm J, Silcock J, et al. Lipid and Metabolite Deregulation in the Breast Tissue of Women Carrying BRCA1 and BRCA2 Genetic Mutations. Radiology. 2015;275(3):675-682.
4. Bydder M, Girard O, Hamilton G. Mapping the double bonds in triglycerides. Magn Reson Imaging. 2011;29(8):1041-1046.
5. Peterson P, Månsson S. Simultaneous quantification of fat content and fatty acid composition using MR imaging. Magn Reson Med. 2013;69(3):688-697.
6. Bydder M, Hamilton G, de Rochefort L, et al. Sources of systematic error in proton density fat fraction (PDFF) quantification in the liver evaluated from magnitude images with different numbers of echoes. NMR Biomed. 2018;31(1):e3843–10.
7. Thomassin-Naggara I, Trop I, Lalonde L, David J, Péloquin L, Chopier J. Tips and techniques in breast MRI. Diagnostic and Interventional Imaging. 2012;93(11):828-839.
Figures
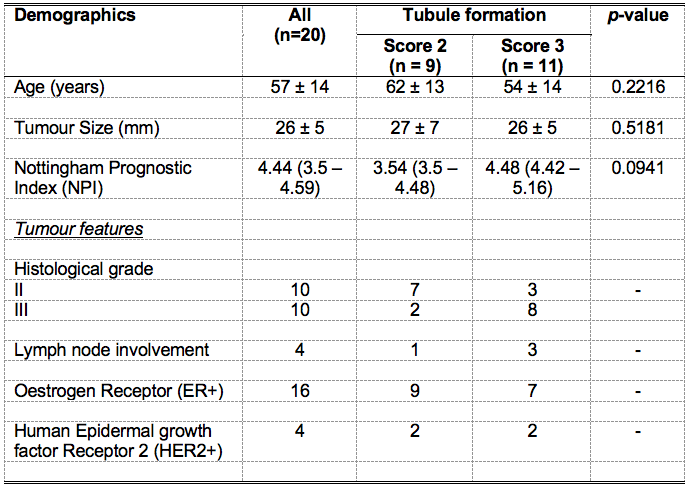
Table 1. Patient demographics.
Descriptive statistics of breast cancer patients with tubule formation Score 2 and 3 are shown for each group and the entire cohort. Values are expressed as mean and standard deviation, except Nottingham Prognostic Index (NPI) whereas median and interquartile range are reported. Pathological entries are expressed as number of positive observations.
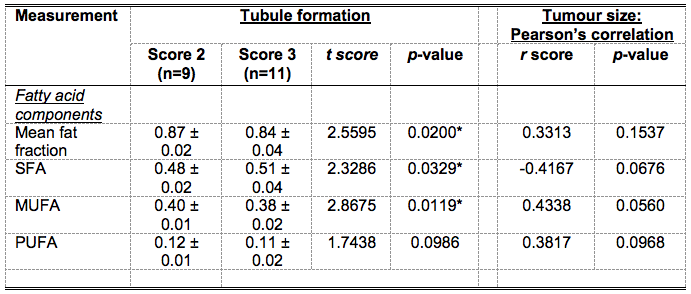
Table 2. A summary of differences in fatty acid components and correlations with tumour size.
Mean fat fraction, saturated fatty acids (SFA), monounsaturated FA (MUFA) and polyunsaturated FA (PUFA) in peri-tumoural adipose tissue were compared between Score 2 and 3 tubule formation. The correlations of fatty acid components with tumour size are also shown. Significant findings are marked by ‘*’.
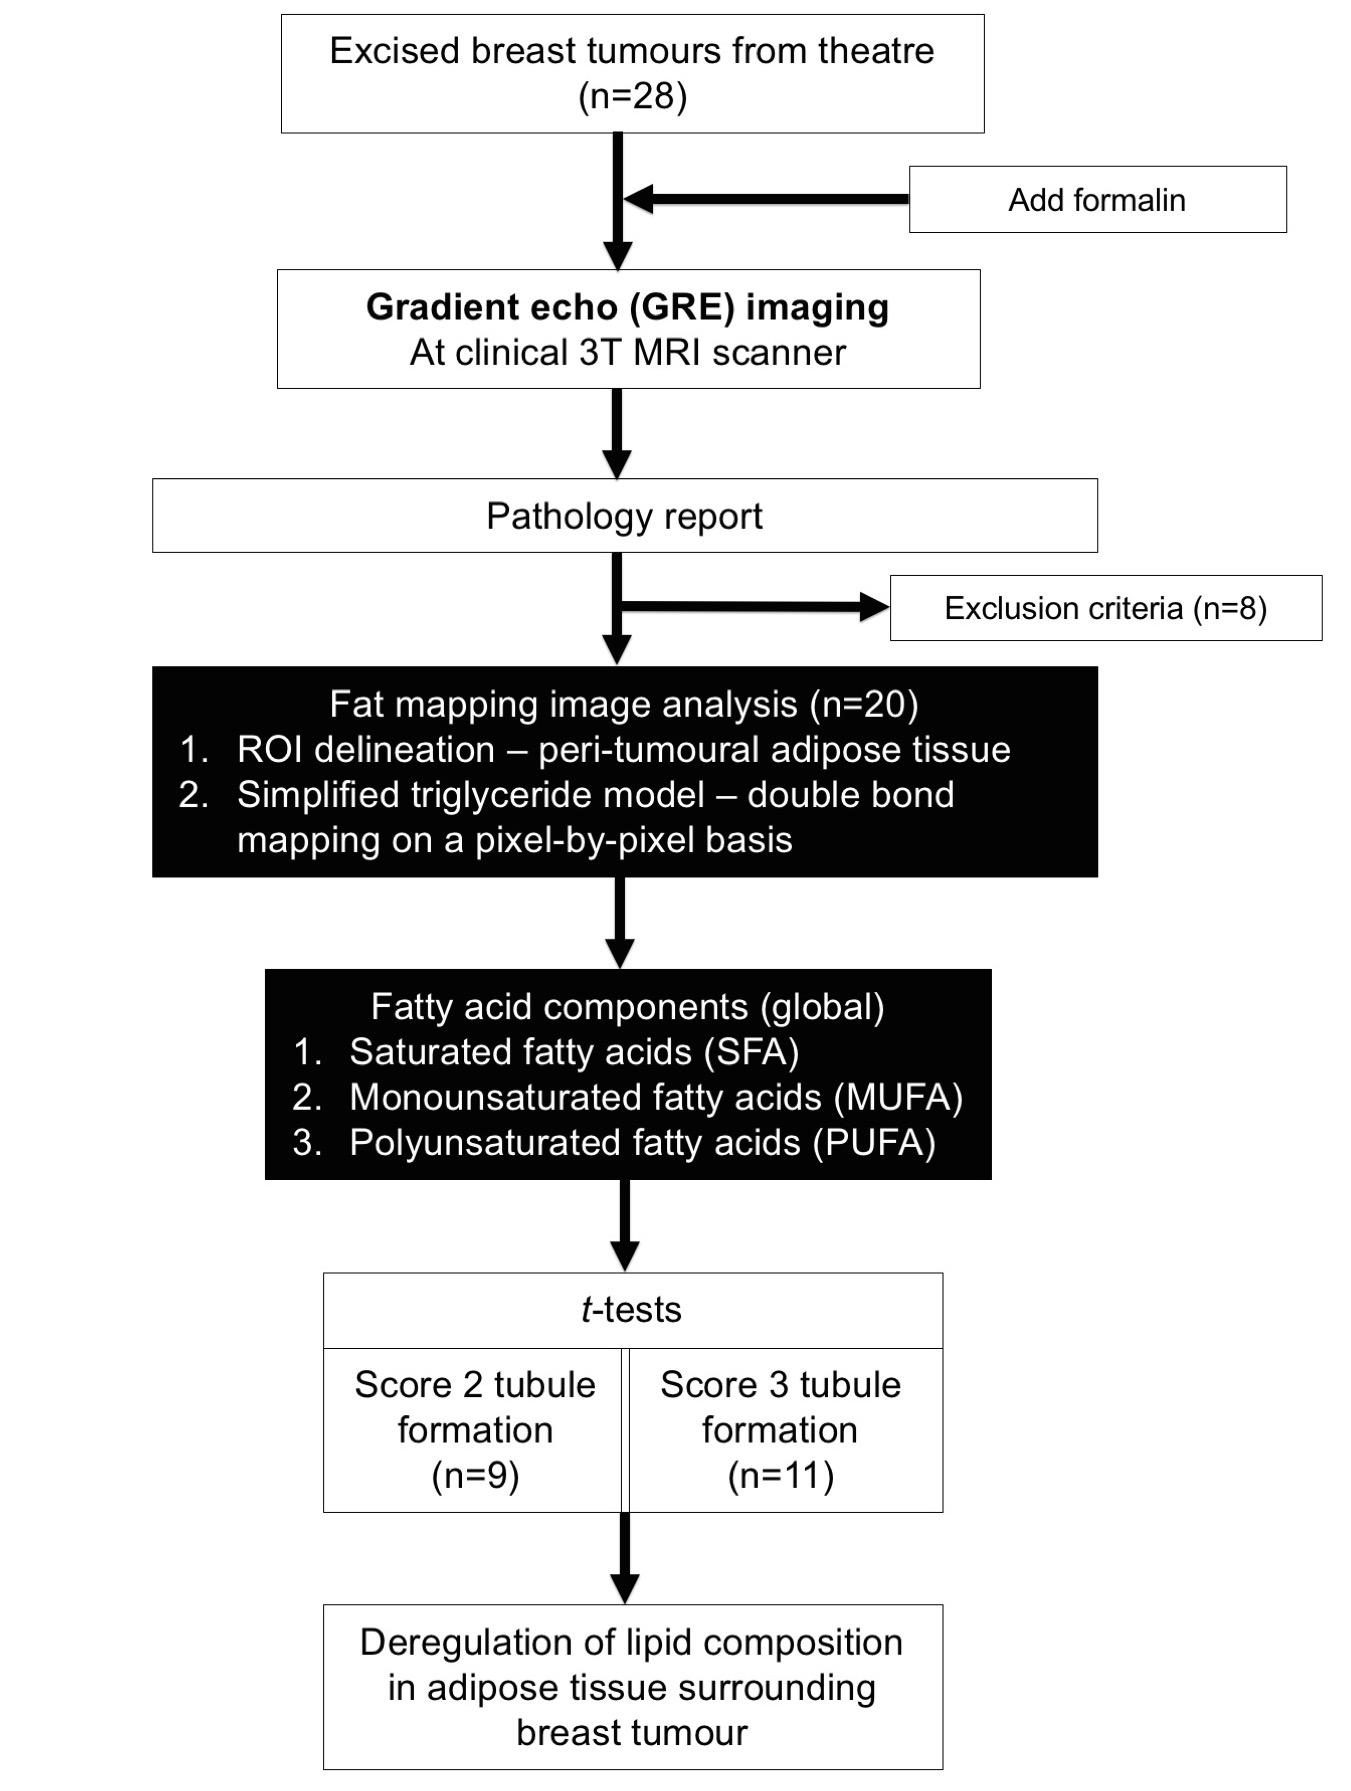
Figure 1. Study design.
A two-group cross-sectional design is shown in a flow chart. Eight of the 28 specimens were excluded from this study due to small tumour size and mixed phenotype. Regions of interests (ROI) were drawn on GRE images to define the adipose tissue boundary. Fat, water and the number of double bonds in triglyceride molecules were estimated from the GRE data, from which the fatty acid components, including SFA, MUFA and PUFA were derived. Statistical comparison was conducted on fat fraction and fatty acid components between Score 2 and 3 tubule formation.
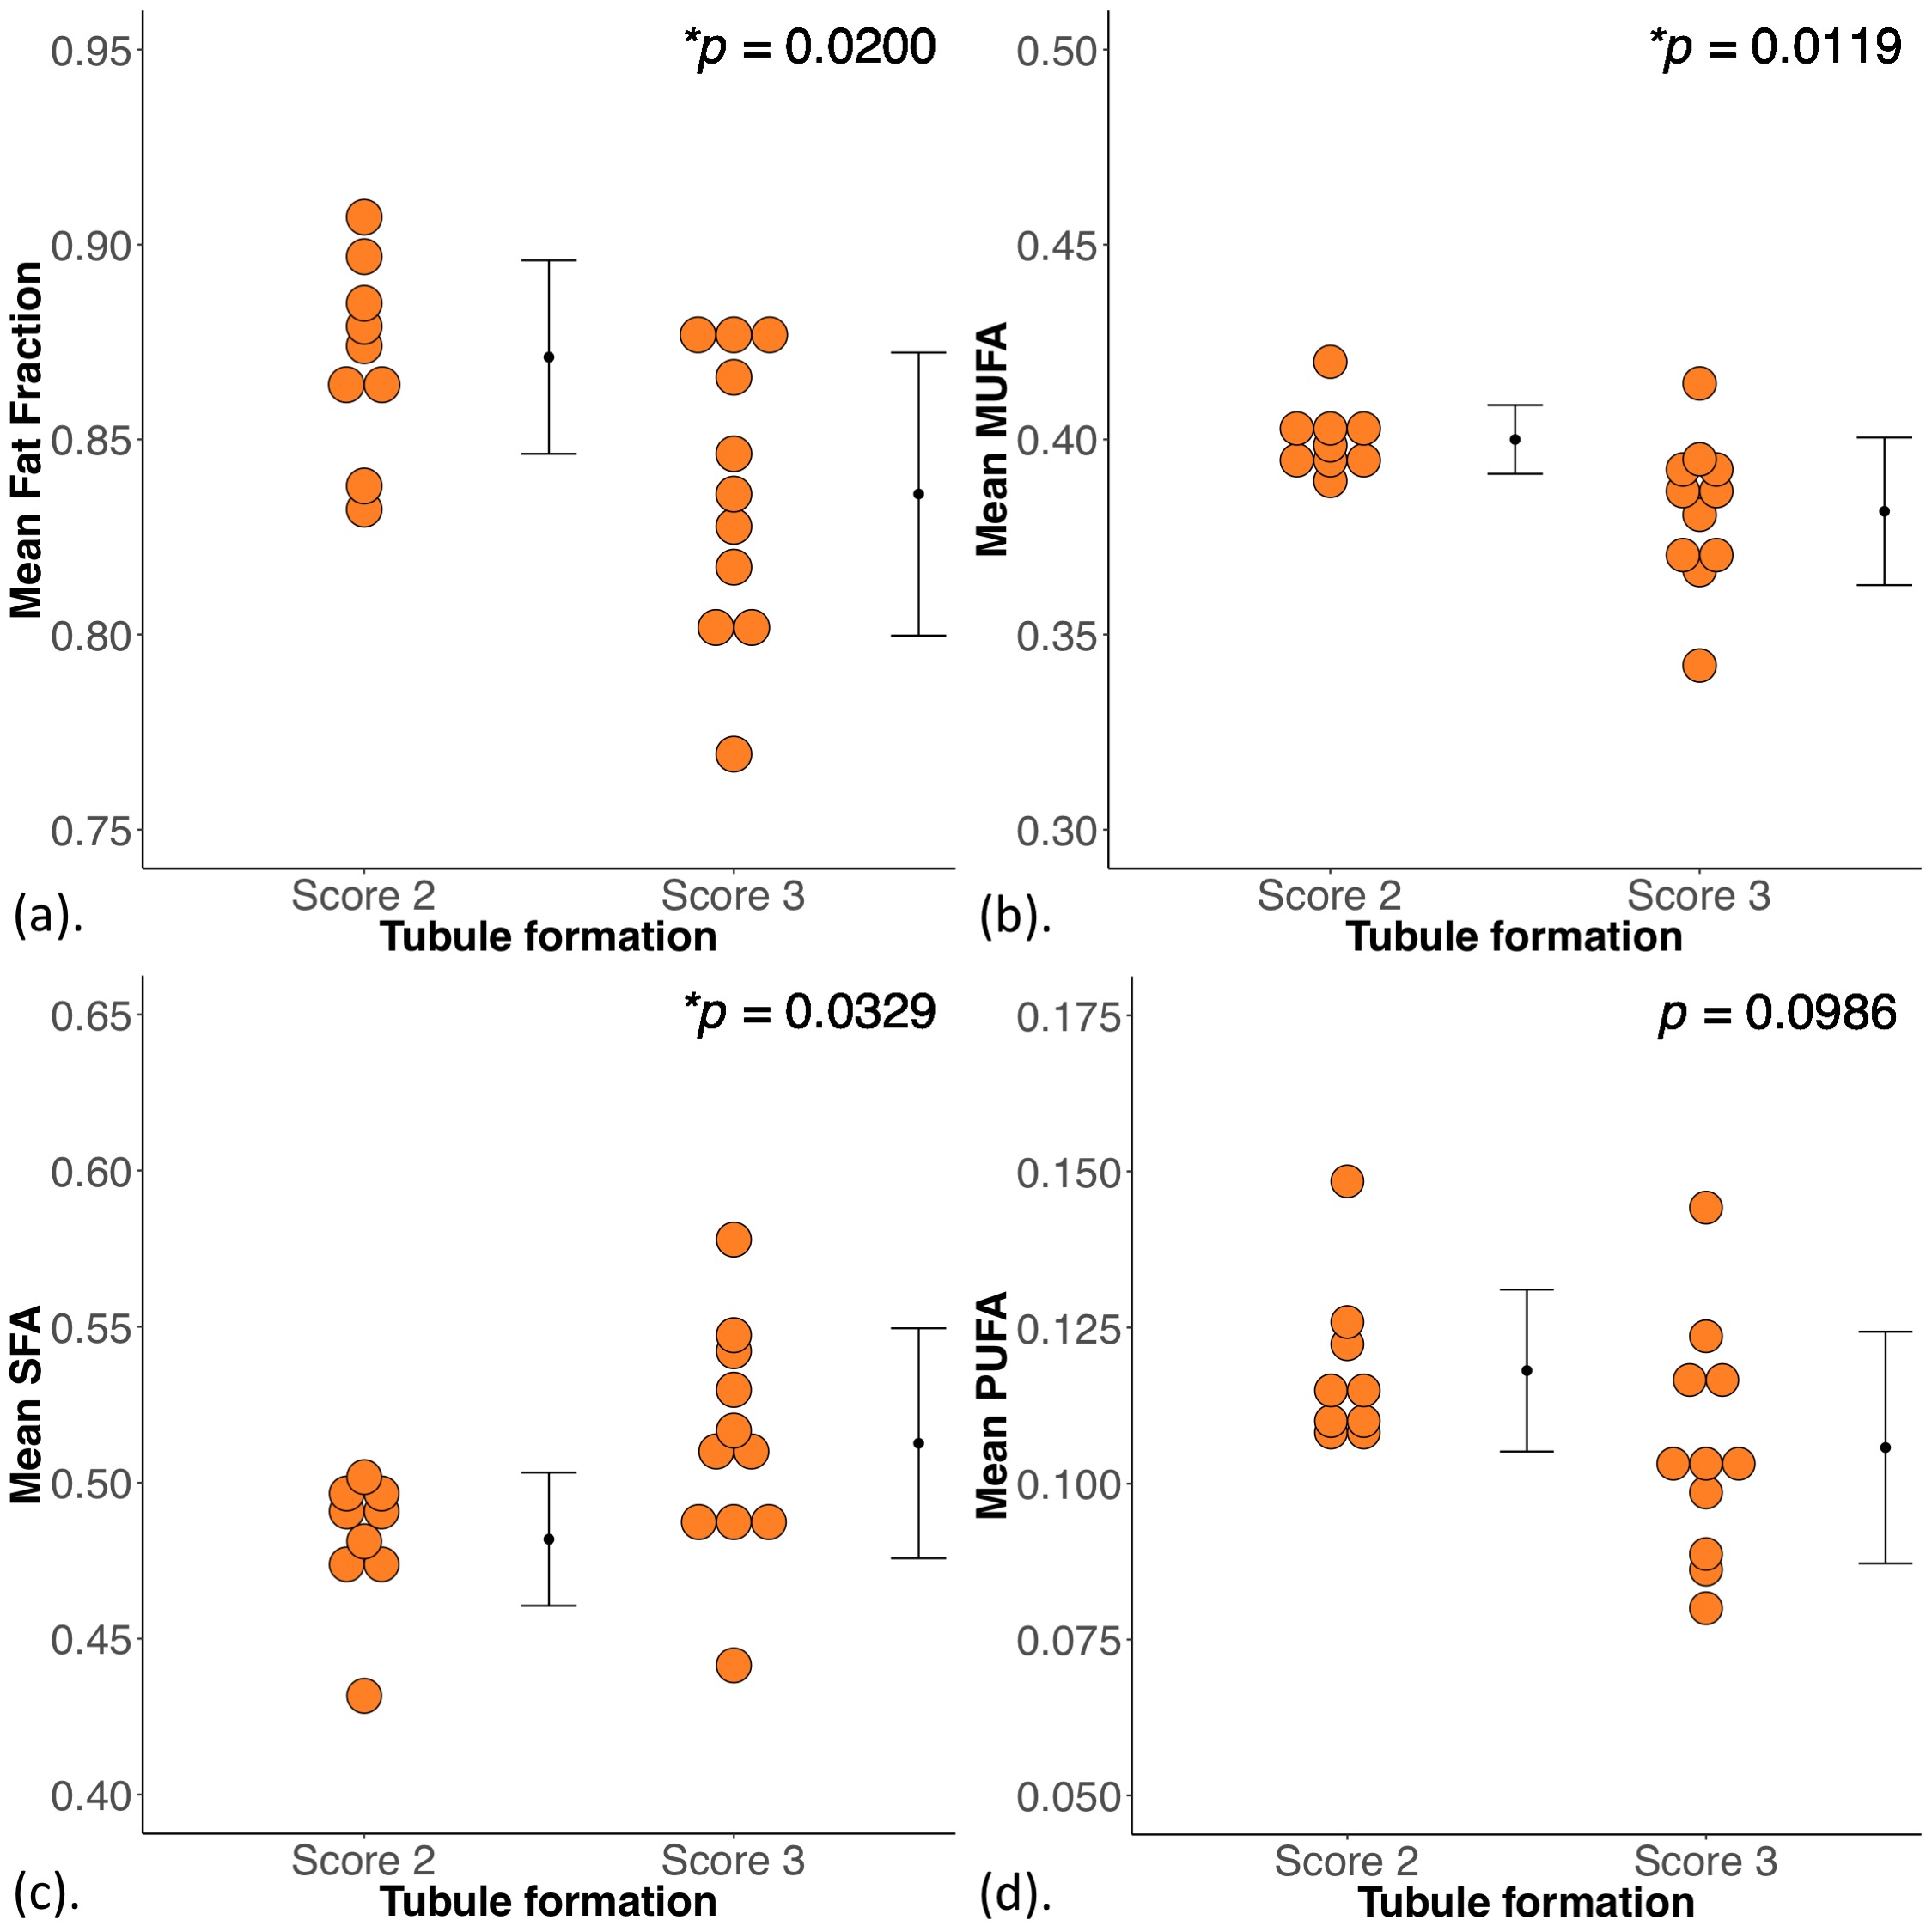
Figure 2. Group differences in mean fat fraction and fatty acid components.
The difference in mean (a) fat fraction, (b) monounsaturated fatty acids (MUFA), (c) saturated FA (SFA) and (d) polyunsaturated FA (PUFA) between breast cancer with Score 2 and 3 tubule formation are shown in dot plots. Each dot represents the global average obtained within adipose tissue around the breast tumour, and the error bar indicates the mean and standard deviation. The t-tests were performed between the groups and p value is shown for each plot. Statistically significant p values are marked by ‘*’.
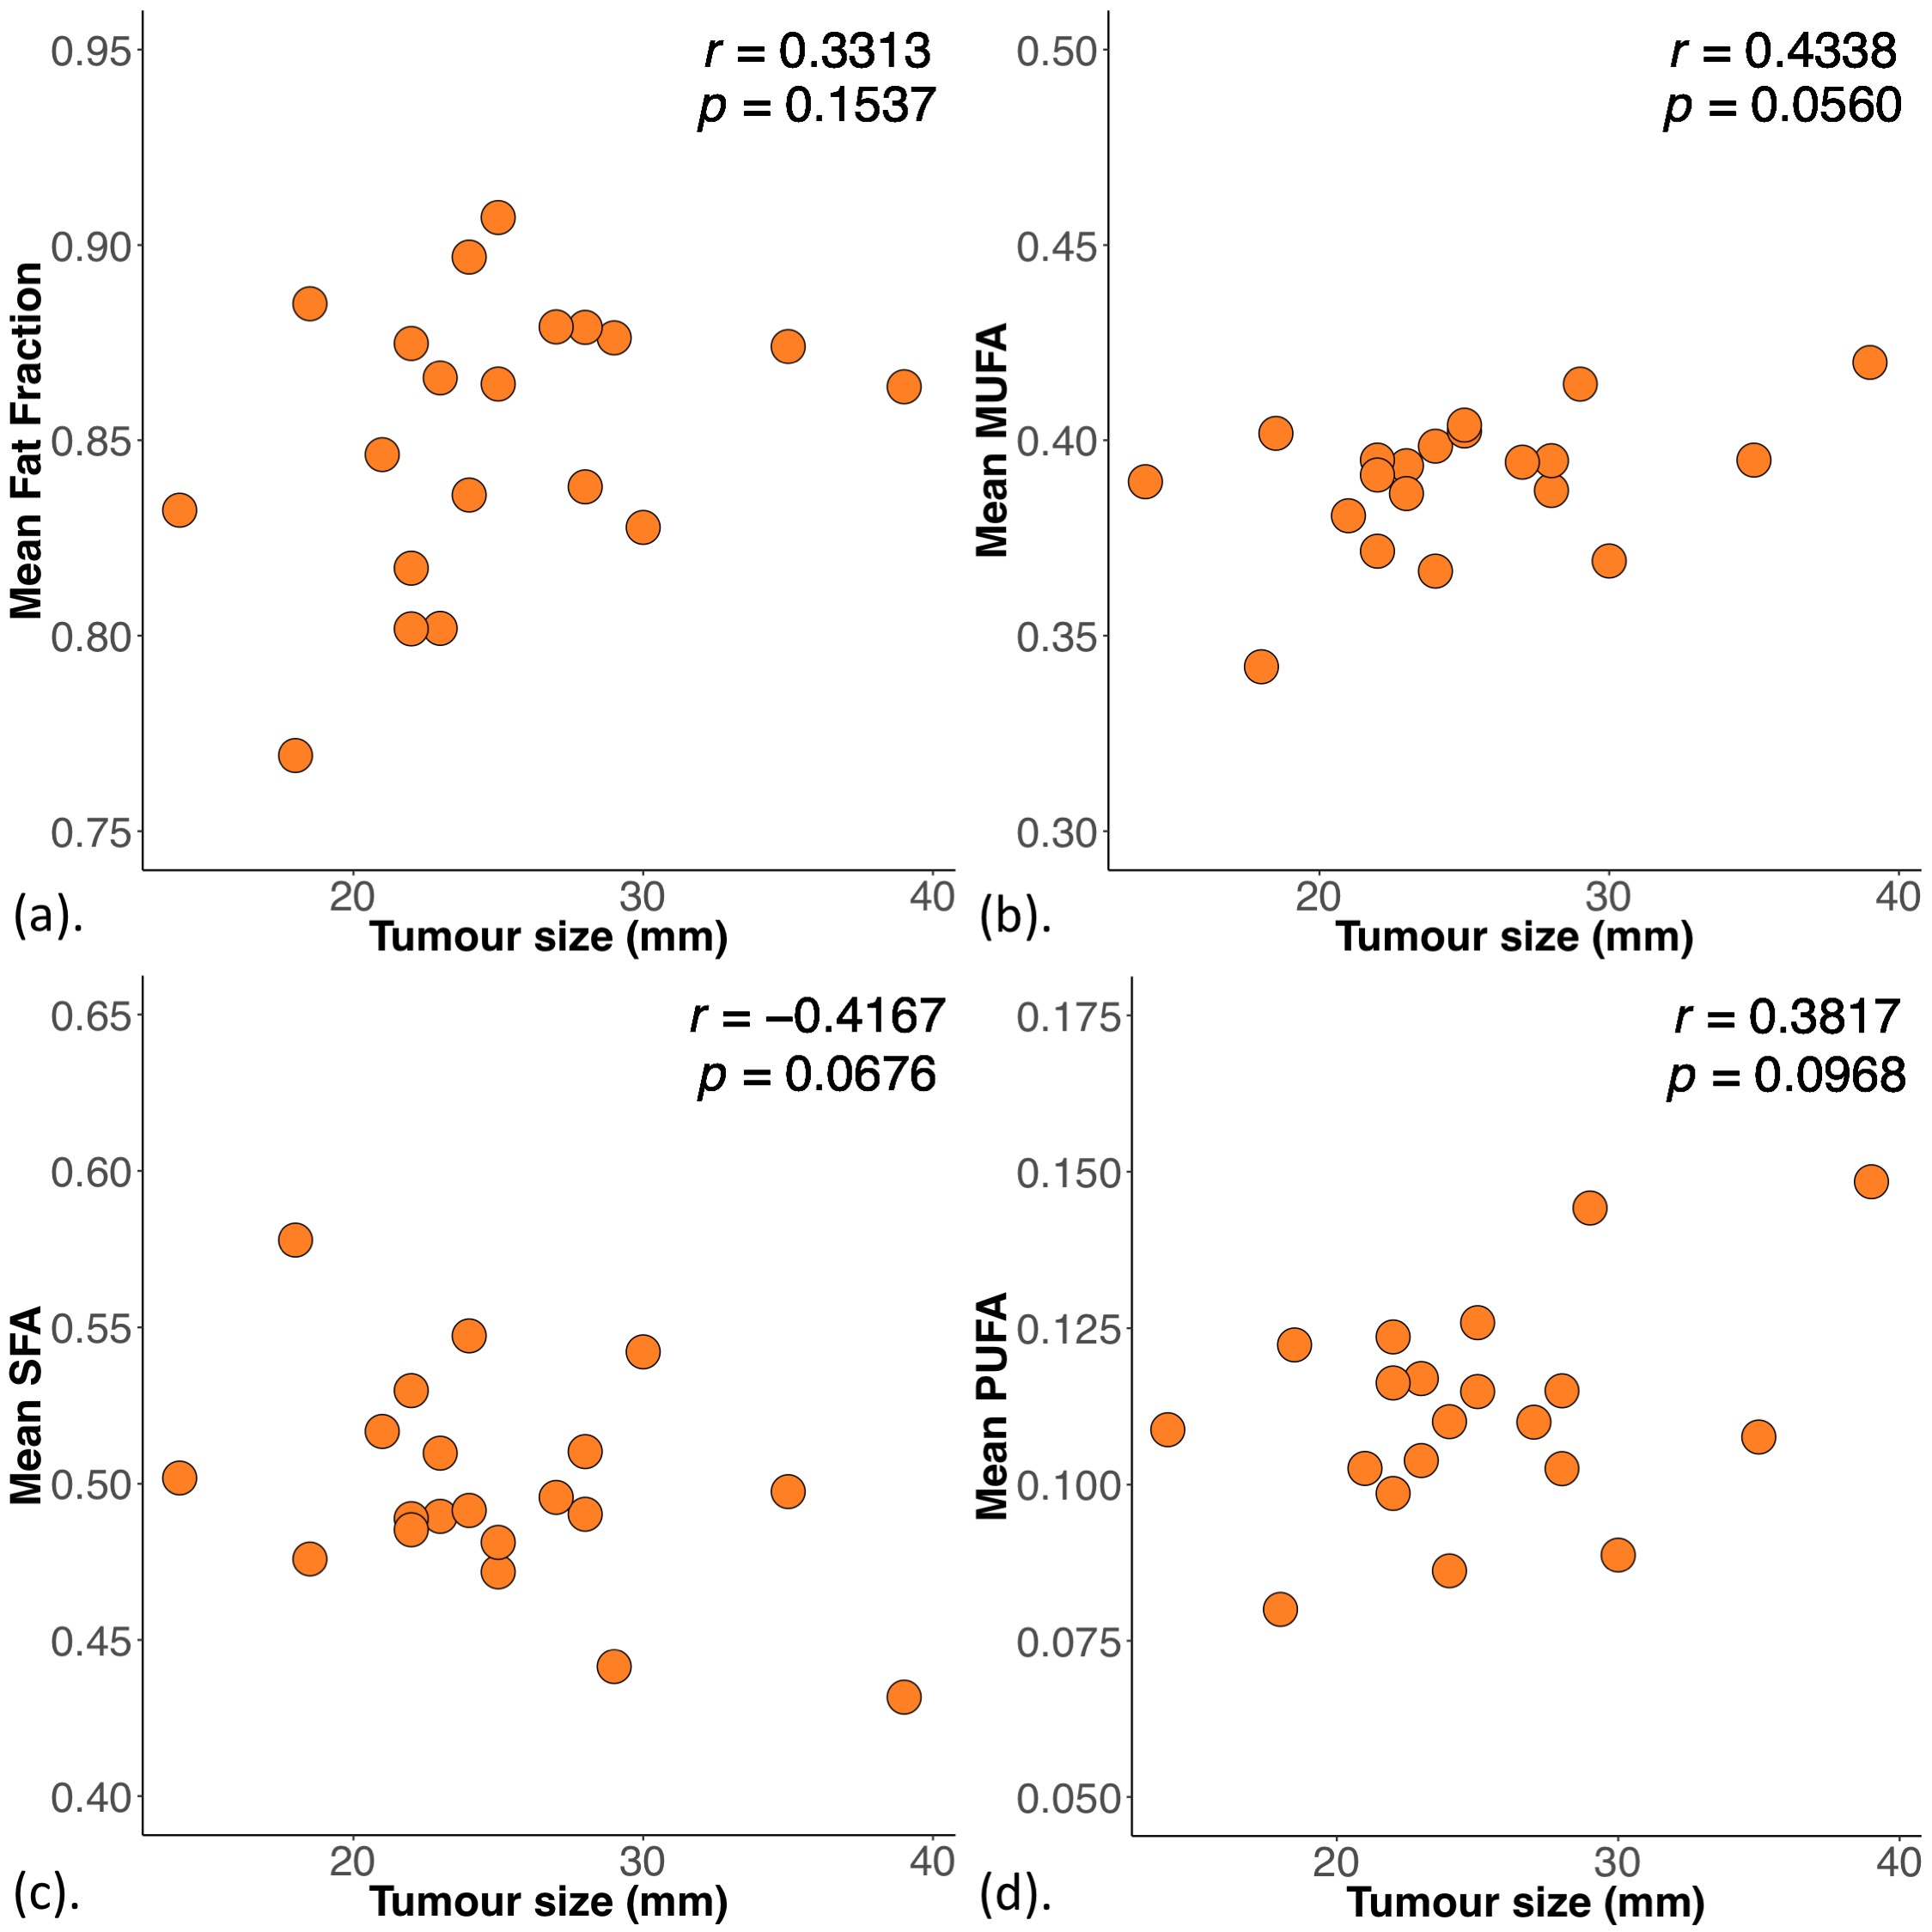
Figure 3. Correlations of mean fat fraction and fatty acid components with tumour size.
The correlation of mean (a) fat fraction, (b) monounsaturated fatty acids (MUFA), (c) saturated FA (SFA) and (d) polyunsaturated FA (PUFA) with tumour size is shown in scatter plots. The corresponding Pearson’s correlation coefficients (r score) and p values are displayed. Statistically significant p values are marked by ‘*’.