4866
T2-mapping of MR imaging for discriminating mucinous adenocarcinoma from nomucinous adenocarcinoma in rectal cancer and compared with diffusion weighted image
yuxi ge1 and weiqiang dou2
1Wuxi Fourth People's Hospital, wuxi, China, 2GE Healthcare, MR Research, Beijing, China
1Wuxi Fourth People's Hospital, wuxi, China, 2GE Healthcare, MR Research, Beijing, China
Synopsis
T2-mapping, as a quantitative and accurate measurement that can be used as a noninvasive biological marker to predict the pathological classification of rectal cancer, may be beneficial to making an individualized treatment strategy before operation of rectal cancer.
abstract
Introduction: Mucinous adenocarcinoma(MA) is associated with worse clinicopathological characteristics and a poorer prognosis than nonmucinous carcinoma (NMA). and in terms of treatment, it was related to worse tumor regression grade and tumor down staging compared with NMA. Therefore, the treatment strategy for MA could be preoperatively differentiated from NMA. T2 mapping technology which can quantitatively measure the T2 relaxation time of tissue has the potential to objectively quantify MA and NMA.The purpose of this study was to evaluate the T2-mapping of MRI that can help differentiate mucinous adenocarcinoma(MA) from nonmucinous adenocarcinoma(NMA) of rectal cancer and compared with diffusion weighted image(DWI).Method: MR imaging with T2-mapping and DWI of 81 patients which were pathologically proven MA (n=11) or NMA (n=70) were included. T2 map and the apparent diffusion coeffcient (ADC) map were automatically postprocessed on a workstation. and selected the image in the T2 mapping to place a region of interest (ROI) at least 10 mm2 on the solid areas (avoiding necrosis and air) of the tumor at the slice with the largest axial diameter of tumor. ADC value of tumor was measured on ADC map with reference to axis T2 weighted image by using the same method. T2 value and ADC value, as well as clinical parameters including sex, age, T staging, were independently measured by two radiologists. Comparisons of T2 value and ADC in patients with different groups were made using the independent-samples t-test or Mann-Whitney U test. The correlations between T2 value and ADC and tumor stage were further evaluated using pearson or spearman correlation analysis. Interobserver agreement was evaluated using the intraclass correlation coeffcient (ICC). The ROC curve is drawn to calculate the diagnostic performance of T2 value and ADC.
Results:Excellent interobserver reproducibility was obtained for the T2 value and ADC parameters with ICCs value were 0.998 and 0.935 respectively. Compared with NMA(Fig. 1), MA (Fig. 2) showed a higher T2 Mapping value (87.9 ± 5.11 ms vs 66.6 ± 6.86 ms) (p = 0.000) and a higher ADC values (2.03×10⁻³mm2/s vs 1.17×10⁻³ mm2/s)(p = 0.000). There was no significant difference in T stage, age and gender between the two groups. The area under the ROC(AUC) of the T2 value and ADC, which showed no statistical significance, were 0.999(95% CI:0.953-1) and 0.979(95% CI:0.920-0.998) respectively. When the cutoff value was 80 on T2 Mapping, Youden Index was the largest with the sensitivity was 100% and the specificity is 97.1%.
Discussion: T2-mapping of MRI, as a stable quantitative sequence, is useful in the differentiation of MA from NMA, and its diagnostic efficiency is as high as ADC. T2-mapping is reported to be widely used in the diagnosis of cardiovascular1 and joint diseases2. It is the first time that T2 value was applied to rectal cancer to distinguish different pathological types. Compared with the measurement of ADC value that needs to be compared with T2 weighted image, T2 mapping measurement can directly outline ROI because of the high isotropic resolution. T2-mapping, as a quantitative and accurate measurement that can be used as a noninvasive biological marker to predict the pathological classification of rectal cancer, may be beneficial to making an individualized treatment strategy before operation of rectal cancer. Conclusion: T2-mapping of MRI, as a stable quantitative sequence, is useful in the differentiation of MA from NMA, and its diagnostic efficiency is as high as ADC.
Acknowledgements
Thanks for the MR Research of GE Healthcare for the support of MR technology in this paper.References
1. Shao J, Zhou Z, Nguyen KL, et al. Accurate, precise, simultaneous myocardial T1 and T2 mapping using a radial sequence with inversion recovery and T2 preparation. NMR Biomed. 2019;32(11):e4165.
2. Lefebvre G , Bergère A, Rafei M E , et al. T2 Mapping of the Sacroiliac Joints With 3-T MRI: A Preliminary Study. American Journal of Roentgenology, 2017:1-6.
Figures
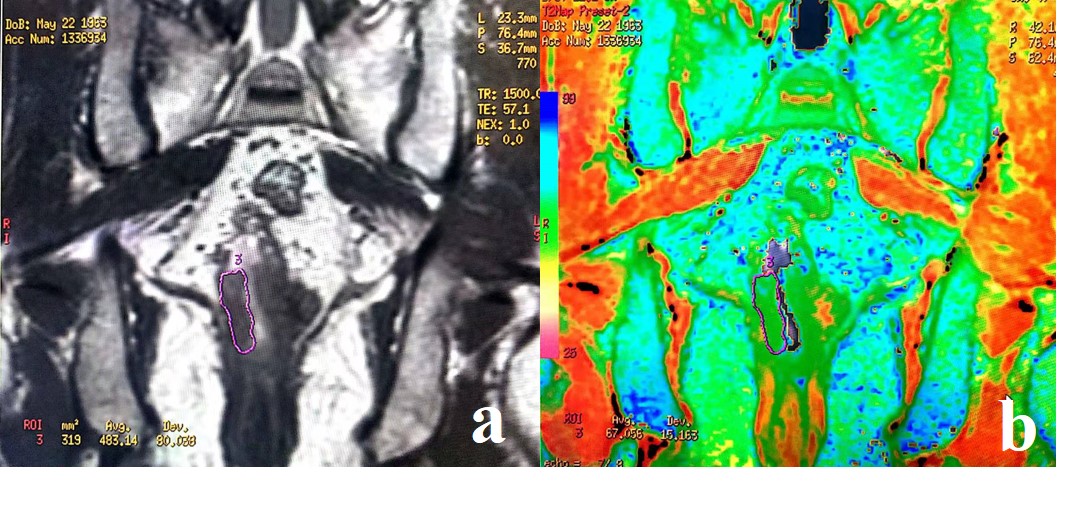
Coronal T2 weighted image (a), and T2 map (b) of
rectum from a 63-year-old male with nomucinous adenocarcinoma; The tumor in the low level of the rectum was
shown on T2 weighted image (a) with a T2 value of was 67 ms
(b).
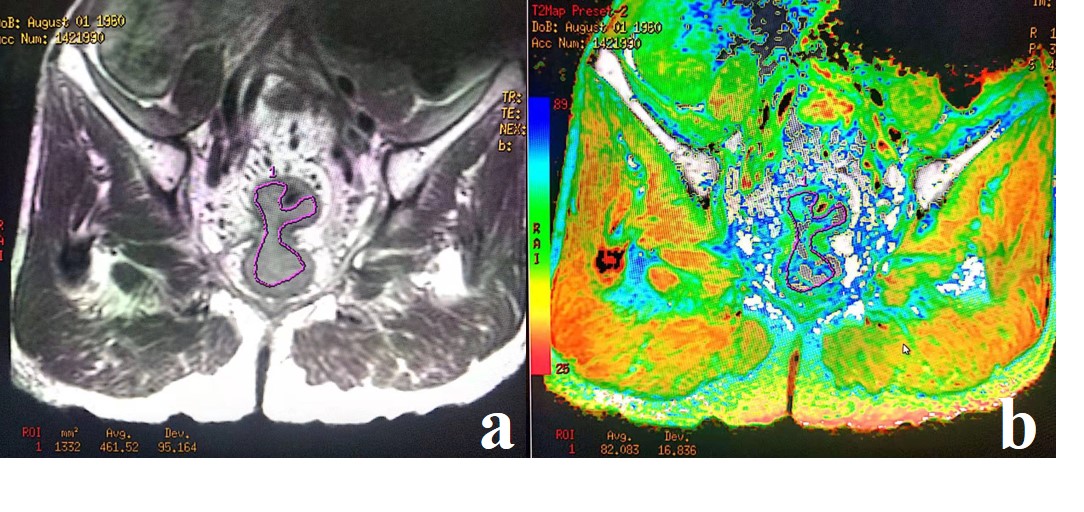
Coronal T2 weighted image (a), and T2 map (b) of
rectum from a 57-year-old male with mucinous adenocarcinoma; The tumor in the middle
level of the rectum was shown on T2 weighted image (a) with a T2 value of was 82
ms (b).
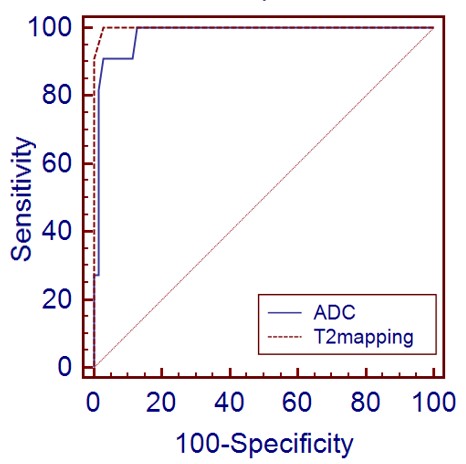
Receiver operating characteristic curves for the
diagnostic performance in the diagnosis of mucinous adenocarcinoma for T2-mapping
and DWI. The areas under the curve(AUC) for ADC was 0.979 and the AUC for
T2-mapping was 0.999.