4863
Optimisation of whole-body diffusion weighted MRI for imaging patients with metastatic melanoma treated with immunotherapy1Division of Radiotherapy and Imaging, The Institute of Cancer Research, London, United Kingdom, 2Department of Radiology, The Royal Marsden NHS Foundation Trust, London, United Kingdom, 3Renal and Melanoma Unit, The Royal Marsden NHS Foundation Trust, London, United Kingdom
Synopsis
Whole body MRI, including diffusion weighted imaging, has potential to unravel complex response patterns in patients with metastatic melanoma receiving immunotherapy. To minimise the effect of noise on resultant apparent diffusion coefficient (ADC) maps, images should be acquired using optimal b-values. These values have been calculated from MRI scans of 11 patients, with 99 metastases. The optimal pair of b-values is found to be 50 and 1250 s/mm2. A significant difference is reported between the distributions of the ADC values before and after treatment with immunotherapy. This provides preliminary evidence that ADC could provide a biomarker of response to immunotherapy.
Background
Immunotherapy has changed the landscape of metastatic melanoma treatment improving survival1. Due to the mechanism of action, atypical response patterns have been described including disease shrinkage after initial increase in tumour burden and shrinkage after appearance of new lesions; the reported incidence of ‘pseudoprogression’ is up to 10%2. Conventional size-based response criteria such as RECIST 1.13 can lead to premature termination of treatment.Whole-body MRI (WB-MRI) includes morphological and functional images. Compared with CT this offers increased sensitivity for disease detection at sites such as brain, connective tissues, bones, liver and peritoneum. The inclusion of diffusion-weighted imaging (DWI), also has the potential to provide a more accurate assessment of treatment response4. The DWI technique enables the calculation of the apparent diffusion coefficient (ADC), which reflects tissue microarchitecture including tissue cell density, hence giving an indication of changes on a cellular scale. Calculation of ADC is affected by the inherently low signal-to-noise-ratio (SNR) of DWI; therefore, it is important to optimise b-values to minimise the effects of noise.
Purpose
In order to develop a WB-MRI protocol for patients with metastatic melanoma undergoing treatment, the main aim of this study is to establish optimal b-values for calculating ADC of metastatic disease and to establish the distribution of ADC.Methods
Patients:This was a retrospective single-institution study with local institutional review board approval. Eleven patients with previously treated metastatic melanoma underwent MRI including DWI: 4 patients had baseline and post-immunotherapy scans; 6 patients had baseline scans only; one patient had a single post-treatment scan.
Imaging:
Images were acquired using 1.5T and 3T Siemens scanners (Aera, Avanto and Skyra) with 8 patients scanned at 1.5T and 3 patients scanned at 3T. Of these patients, 5 were scanned with whole body coverage and 6 with abdominal and pelvic coverage. Axial DWI was obtained with b-values = 50,600,900 s/mm2 for 5 patients, b-values = 50,600,1050 s/mm2 for 5 patients and b-values = 50,600,900,1050 s/mm2 for one patient. ADC maps were calculated from these images using a mono-exponential decay model.
Analysis:
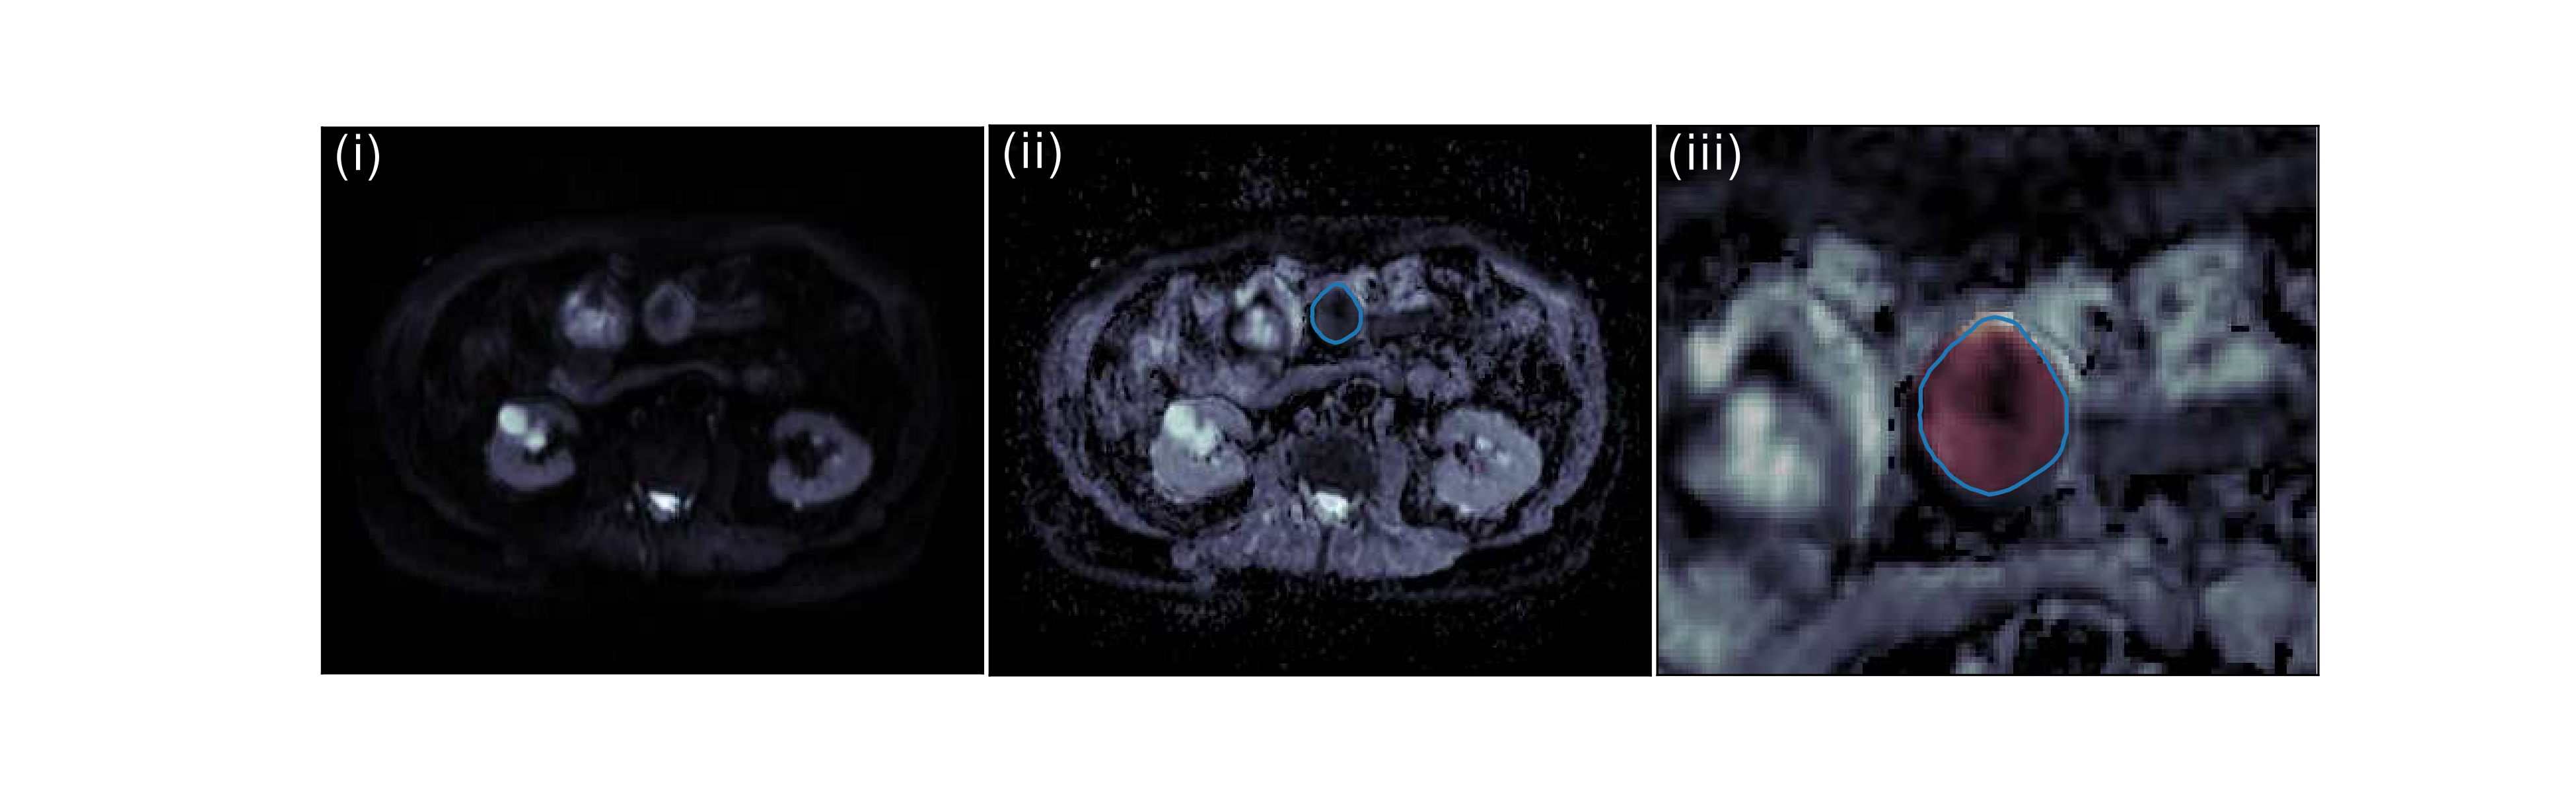
A minimum tumour diameter of 1 cm was chosen for regions of interest (ROIs) to avoid partial volume effects. ROIs were drawn around the tumour on the central slice on b = 50 s/mm2 images and a mask was created from this and applied to the ADC map to extract the corresponding ADC values of each voxel in the tumour, as shown in Figure 1. It is possible to show that two b-values should be acquired with an optimal separation, bopt, which can be found by solving5, 6 :
$$b_{opt}D_{0} ≈ 1.25$$
where D0 represents the ADC of the tissue. An optimal low b-value is 0 s/mm2 but many authors choose 50 s/mm2 to reduce unwanted flow artefacts7, and the number of signal averages for low/high b-values should have ratio 1:3.
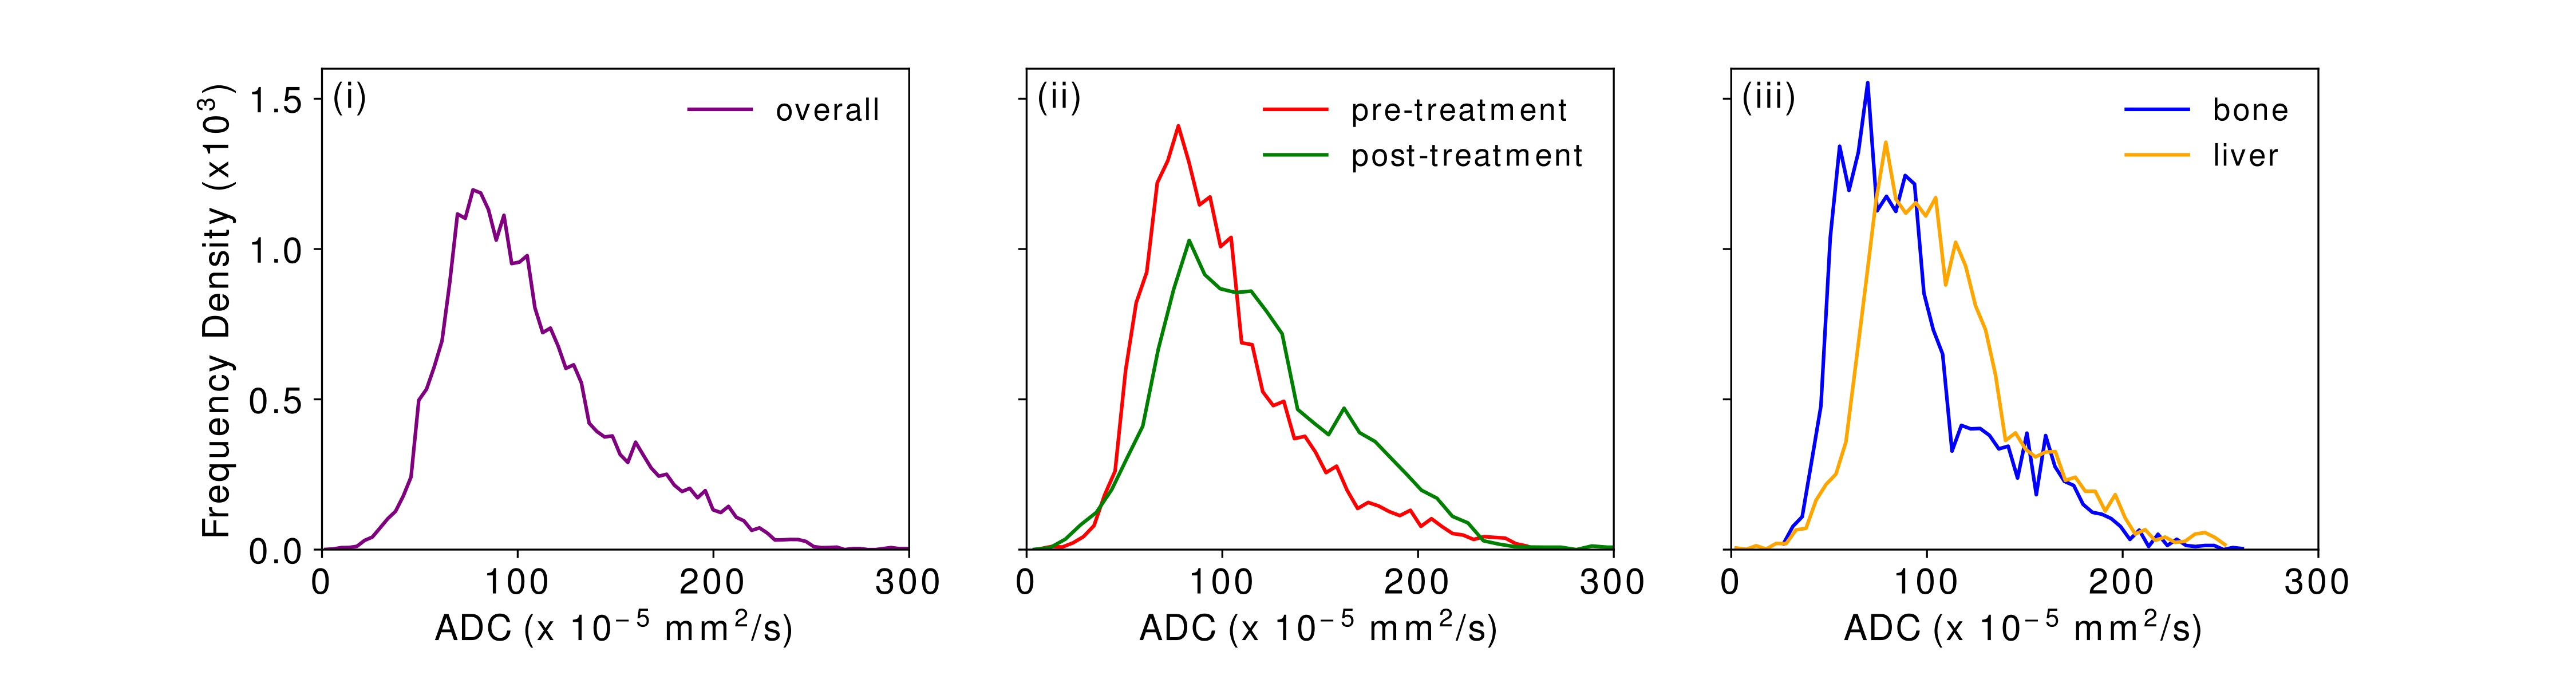
The distribution of ADC estimates was assessed for (i) all tumours combined, (ii) according to whether the scan was acquired as a baseline or post-treatment, and (iii) according to tumour location. The distributions were weighted by 1/L, where L is the number of voxels in the tumour, in order to remove bias towards larger tumours.
An independent t-test was performed on mean tumour ADC values from the baseline and post-treatment scans, not assuming equal variance in the two distributions.
Results and Discussion
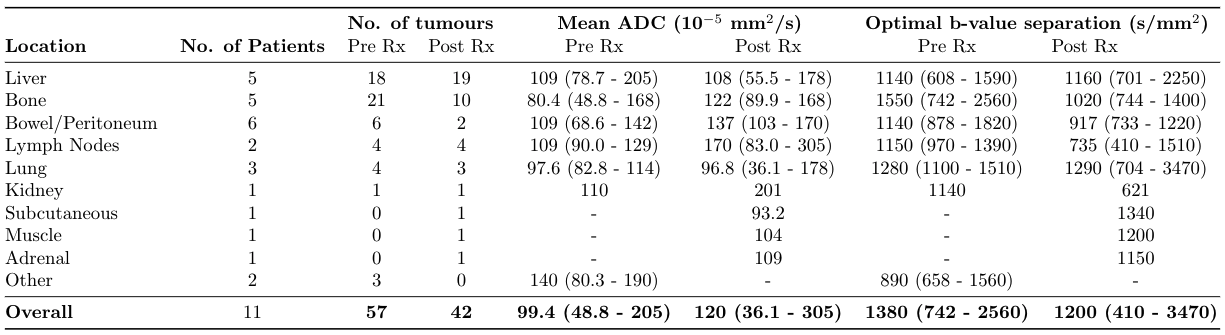
The mean ADC values and associated optimal b-value separations are presented in Table 1. There is a large range of values for all locations of metastases and the mean bopt for both baseline and post-treatment are high, indicating generally lower ADC values in this tumour type than observed in many other tumour groups8. Based on these results, it is suggested that to calculate the most accurate value of the ADC for metastatic melanoma, the protocol should include a low b-value of 50 s/mm2 and a high b-value of 1250 s/mm2, with the latter having thrice the number of signal averages as the former. An additional acquisition at 600 s/mm2 may be valuable for the assessment of lesions presenting ADCs in the upper quartile.The distribution of ADC values, weighted according to tumour size, are show in Figure 2. Mean ADC was higher in post-treatment tumours compared with pre-treatment (p = 0.02, independent t-test, Figure 2.ii). For single-site distributions (Figure 2.iii), only ADC values derived from tumours in the bone and liver are displayed as sample sizes at the other locations are too small.
Conclusion
An optimal WB-MRI protocol for examination of patients with metastatic melanoma should use the optimal b-values 50 and 1250 s/mm2. The practicalities of achieving robust imaging at b = 1250 s/mm2 in a clinical setting need to be explored. ADC estimates may provide further evidence which suggests that average ADC could provide a potent response biomarker to treatment.Acknowledgements
We acknowledge CRUK and EPSRC support to the Cancer Imaging Centre at ICR and RMH in association with MRC and Department of Health C1060/A10334, C1060/A16464 and NHS funding to the NIHR Biomedical Research Centre and the NIHR Royal Marsden Clinical Research Facility. This report is independent research funded by the National Institute for Health Research. The views expressed in this publication are those of the author(s) and not necessarily those of the NHS, the National Institute for Health Research or the Department of Health.References
[1] Wolchok J, Chiarion-Sileni V, Gonzalez R et al. Overall survival with combined nivolumab and ipilimumab in advanced melanoma. NEJM. 2017;377:1345-1356.
[2] Borcoman E, Nandikolla A, Long G et al. Patterns of response and progression to immunotherapy. Am Soc Clin Oncol. 2018;23:169-178.
[3] Eisenhauer AE, Therasse P, Bogaerts J et al. New response evaluation criteria in solid tumours: revised RECIST guideline (version 1.1). Eu J Cancer. 2009:45:228-247.
[4] Donners R, Blackledge M, Tunariu N et al. Quantitative whole-body diffusion-weighted MR imaging. Magnetic Resonance Imaging Clinics. 2018;26(4):479-494.
[5] Collins D and Blackledge M. Diffusion-Weighted MR Imaging: Techniques and Optimization. Berlin, Heidelberg: Springer, 2010;19-32.
[6] Bito Y, Hirata S and Yamamoto E. Optimum gradient factors for apparent diffusion coefficient measurements. Proc Intl Soc Mag Reson Med. 1995;913.
[7] Koh D, Blackledge M, Padhani A et al. Whole-body diffusion-weighted MRI: tips, tricks, and pitfalls. Am J of Roentgenol. 2012:199(2):252-262.
[8] Winfield J, Tunariu N, Rata M et al. Extracranial soft-tissue
tumors: repeatability of apparent diffusion coefficient estimates from
diffusion-weighted MR imaging. Radiology. 2017;284(1):88-99.
Figures