4861
Parameter Induced Variations in DCE-MRI Analysis: Monitoring Treatment Response for Head and Neck Tumours1Centre for Medical and Radiation Physics, University of Wollongong, Wollongong, Australia, 2Medical Physics, Ingham Institute of Applied Medical Research, Liverpool, Australia, 3Liverpool and Macarthur Cancer Therapy Centres, Liverpool, Australia, 4South Western Sydney Clinical School, University of New South Wales, Liverpool, Australia, 5Townsville Hospital and Health Service, Townsville, Australia, 6Institute of Medical Physics, University of Sydney, Camperdown, Australia
Synopsis
The effect of altering the input parameters into a Pharmacokinetic (PK) model on output parameter values generated was investigated. This included determining the variations induced by using individualized versus population based Arterial Input Function and haematocrit values in the model. This was completed for multiple DCE-MRI scans acquired along the course of radiotherapy treatment for 5 head and neck cancer patients. Qualitatively, most patients had similar trendlines when comparing between each combination of parameter inputs. However quantitatively, the %difference between baseline and subsequent weeks highlighted significant impacts caused by input parameter selection; having implications for applications in treatment response monitoring.
Introduction
Dynamic Contrast Enhanced (DCE) Magnetic Resonance Imaging (MRI) has seen potential for predicting head and neck (H&N) tumour response to a treatment using pharmacokinetic (PK) modelling parameters [1]. PK-perfusion based parameters include the transfer constant from plasma (Ktrans) and tissue volume fraction (Ve). These can be impacted when the tissue and vessels supplying it are affected by disease. The process of perfusion is dependent on the blood Haematocrit (Hct) value and Arterial Input Function (AIF), which describes the rate of contrast agent uptake into a region of interest (ROI) [2]. There exists debate in the literature to whether individualised or population-based Hct or AIF’s should be used for the generation of PK parameters for response monitoring, including for head and neck tumours [1-3]. This study aims to quantify the variations in PK-parameter values generated by implementing these different inputs to the model.Methods
Imaging: 5 patients with diagnosed H&N cancer were imaged using a 3T MRI scanner at various timepoints along treatment: baseline, weeks (W) 2, 5, and 20 (post-3 months); using a 3T Siemens Magnetron Skyra scanner (Siemens Healthineers, Erlangen, Germany). T1-spoiled 3D-GRE Volumetric interpolated breath-hold examination (VIBE) sequences were used to generate T1-Maps in post-processing using the Variable Flip Angle (VFA) method [4] (FA: 2° and 15°) on 3D-Slicer. Common acquisition parameters for the VIBE and dynamic acquisition (TWIST) included: BW=440Hz/pixel, TR/TE=4.09/1.35 ms, FOV=30 cm2, slices = 26 and thickness = 3 mm. The latter scan utilized a Gadovist based contrast agent (0.1ml/kg, injected at a rate of 4 ml/s after the 3rd measurement).Analysis: Primary tumour contours were generated by a clinician on the TWIST images. These were used as the ROI from which the mean (95% confidence interval) for each PK-parameter map were extracted from. Such parameter maps were generated using the Tofts-Kermode Model [5] in 3D-Slicer, and included maps of: Ktrans and Ve. Population AIF’s (PA) were provided by 3D-Slicer while individualized AIF’s (IA) were generated by using the uptake under a 61 mm3 label on the carotid artery. A population Hct (PH) of 0.42 for the patient cohort converged with the literature [3], whilst individualized Hct (IH) values were manually extracted from the patient's blood results (acquired within 3 days of scanning). The PK-parameters were generated using four input parameter combinations: PA-PH, PA-IH, IA-IH, IA-PA. Percentage differences between the baseline and subsequent weeks were normalized to the baseline value to observe the differences in each parameter over the course of the treatment, as would be required for treatment response applications.
Results
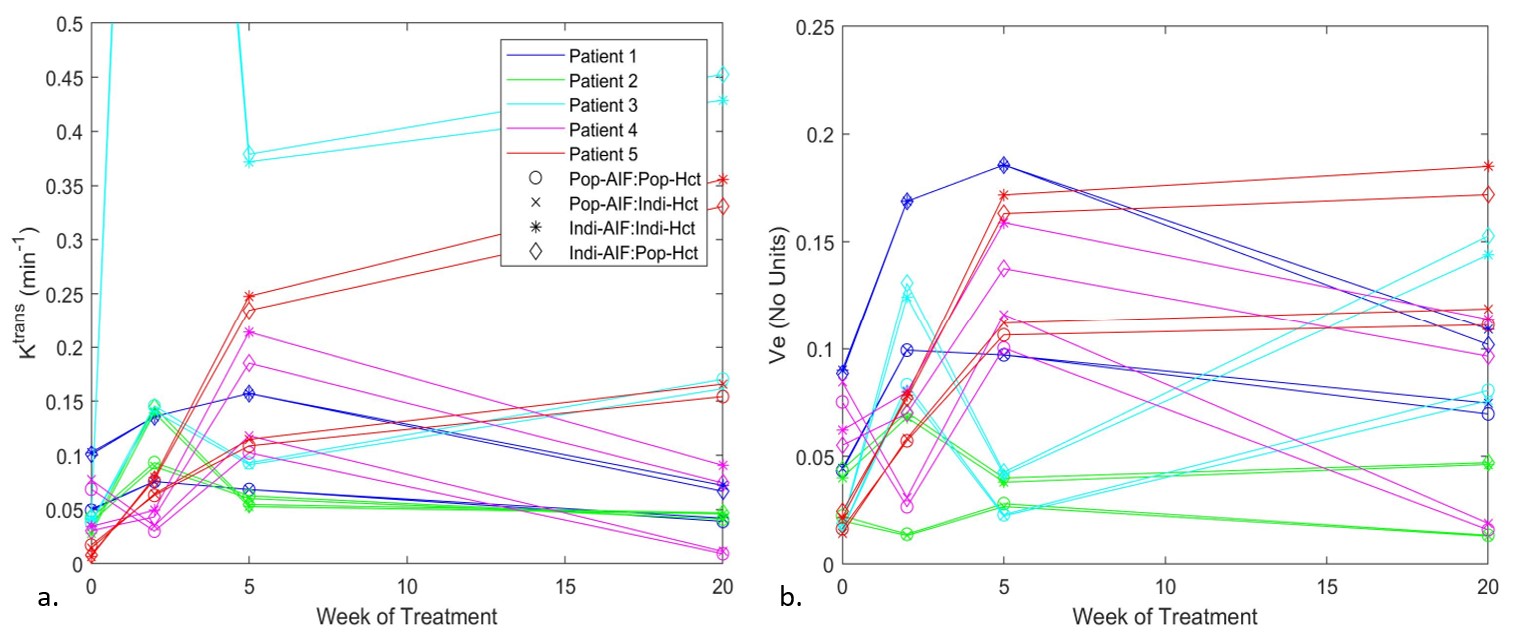
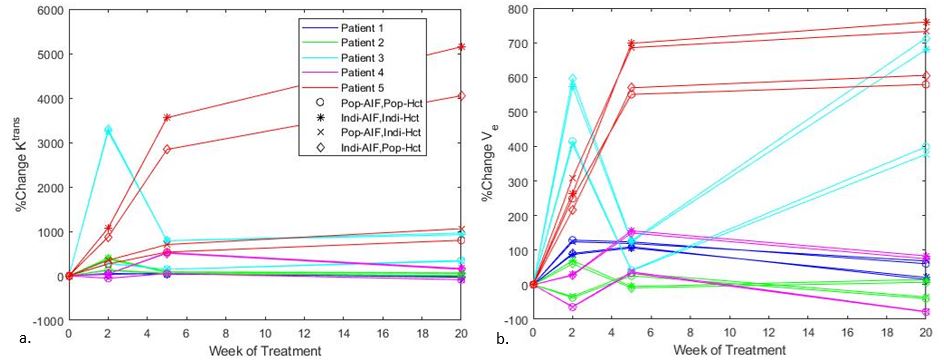
Similar trends for each combination were observed for most patients (Figure 1). The differences become apparent when taking the ratio of the average % difference increase in values (Figure 2) generated for baseline and W20 for [Ve, Ktrans] respectively: IAPH/PAPH= [39%, 500%] and IAIH/PAIH= [32%, 480%]. This suggests IA’s positively scale the parameters, with Ktrans to a greater extent. IH variations increased for later treatment scan outputs also.Discussion
The findings in this study suggest that the input parameters (population versus individualized) of AIF and Hct to a PK-model are significant when quantifying the generated output PK-parameter maps. Although the IA dependency was determined to be a scaled increase of the specific parameters, the PA used for the comparison could alter this finding [3]: Utilizing a PA specific to the patient cohort under investigation should be considered. Further, due to the H&N anatomy, the task of identifying of the main vessel supplying the primary tumour was simplified with the carotid artery displaying a clear uptake in most dynamic acquisitions. This could have contributed to the common trendlines observed and may not hold true for tumours located in other body regions.An observed increase in IH variations as treatment progressed in part was caused by the reduction in IH for patients (baseline - W20: ∆IHavg= - 0.04). Thus, larger differences existed between IH and PH values. The literature in general only utilizes a patient cohort-PH generated from the baseline scan [2, 3]. A further study would involve generating a PH for each week from the patient cohort and comparing to weekly IH measurements for potential increased accuracy.
The 5 patients selected were nominated for this preliminary study since they all had successful scans acquired at the same 4 timepoints over the course of treatment. Rejections from the study included inadequate FA-scans or IH values not being obtained. Other inaccuracies potentially affecting interscan variations were not considered in this study but should be further investigated: including those generated by image distortions (B0-inhomogeneities, and susceptibility). In particular, a future study investigating the B1-inhomogeneity effects on the VFA acquisitions is to be completed to estimate any potential impacts to the T1-Map and hence resultant PK-parameter values generated.
Conclusion
This study highlights the large variations and difficulties which can occur during DCE-MR image post-processing. If consistency in a methodology is followed, relative changes between weeks to predict response is possible. The small patient cohort size however in this study leaves the question for the most suited method of PK-parameter map generation (individualized or population-based inputs) unclear. Further studies with increased time-points and patient numbers are required for validation.Acknowledgements
This work was made possible with access to the 3T MRI scanner at Liverpool Hospital provided by staff in the Cancer Therapy Centre working in collaboration with Ingham Institute for Applied Medical Research (Physics). Further, this research was in part funded by the South Western Sydney Local Health District (SWSLHD) Top-Up Scholarship (2019- Madeline Carr) and Cancer Institute NSW Early Career Fellowship (2019- Michael Jameson).References
- Shulka-Dave et al. BMC Med Phys 2009; 9(4).
- Roberts et al. Proc Int Soc Magn Reson Med 2011; 19.
- Parker et al. Magn Reson Med 2006;56(5): 993-1000.
- Christensen et al. Physical Chemistry 1974;78(19): 1971 – 1977.
- Tofts et al. Magn Reson Med 1991; 17(2): 357-67.
Figures