4858
Texture analyses based on multiple high b-value diffusion-weighted imaging (DWI) for evaluation of tumor heterogeneity in prostate cancer1Department of Radiology, the First Affiliated Hospital of Dalian Medical University, Dalian, China, 2Philips Healthcare, Beijing, China
Synopsis
In the current study, multiple high b-value DWI-based texture analysis was applied to evaluate tumor heterogeneity in prostate cancer patients. Parameters, including MinIntensity, MedianIntensity, MeanValue, and Skewnesswere were significantly different among DWI images with different b values. Therefore, texture analysis based on DWI maps with different b values may serve as a preoperative and non-invasive method for evaluating heterogeneity of prostate cancer.
Purpose
To assess the value of texture features based on multiple high b-value diffusion-weighted imaging (DWI) images for evaluation of tumor heterogeneity in prostate cancer patients.Introduction
Prostate cancer (PCa) is the second most common cancer among males, and it features a high death rate 1. The diffusion-weighted imaging (DWI) might be used as a biomarker for tumor aggressiveness, and various reports have been made on using DWI in evaluating tumor heterogeneity 2. The texture analysis, as a new method of image analyses, can quantify the distribution of signal intensity of voxels within the tumor to reflect tumor heterogeneity 3. We hypothesize that it’s feasible to evaluate tumor heterogeneity in prostate cancer using texture analysis based on multiple high b-value DWI images.Materials and Methods
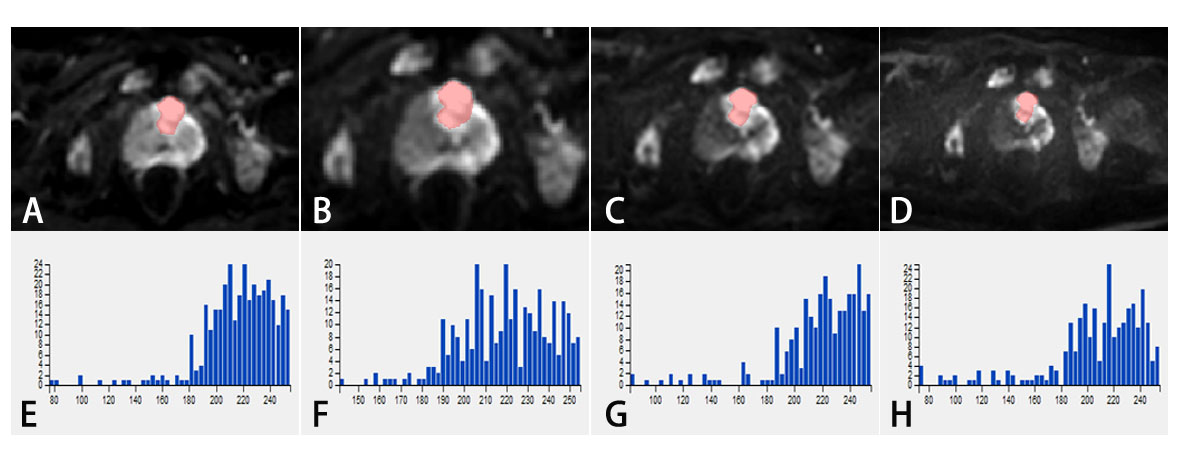
Between May 2019 to September 2019, a total of 17 consecutive patients who were pathologically confirmed as prostate cancer. All patients underwent a preoperative MR examination on a 3.0 T MRI system (Ingenia CX, Philips Healthcare, the Netherlands), including routine liver scans (T1WI, T2WI, and dynamic contrast-enhanced MR imaging) and additional multiple high b-value DWI scans (b values = 0, 20, 50, 100, 150, 200, 400, 800, 1200, 2000, and 3000 s/mm2). Texture analysis was performed using Omni-Kinetics software (GE Healthcare). A radiologist (with 5 years of experience in abdominal radiology), who was blinded to the clinical and histopathological information, reviewed the MR images and manually outlined the regions of interest (ROIs) at the maximum slice of the lesion on axial DWI images with b values of 800, 1200, 2000 and 3000, respectively (shown in Figure 1). All texture parameters including MinIntensity, MaxIntensity, MedianIntensity, MeanValue, stdDeviation, Variance, VolumeCount, VoxelValueSum, RMS, Range, MeanDeviation, RelativeDeviation, MinLocation, MaxLocation, skewness, kurtosis, uniformity, Energy, Entropy, FrequencySize were derived from multiple b-values DWI images. Statistical analyses were carried out using SPSS (version20.0 for Windows, IBM Corporation, USA). The One-Way ANOVA (Kruskal-Wallis) test was used to compare above texture parameters among groups with different b-values. P < 0.05 was considered to indicate statistical significance.Results
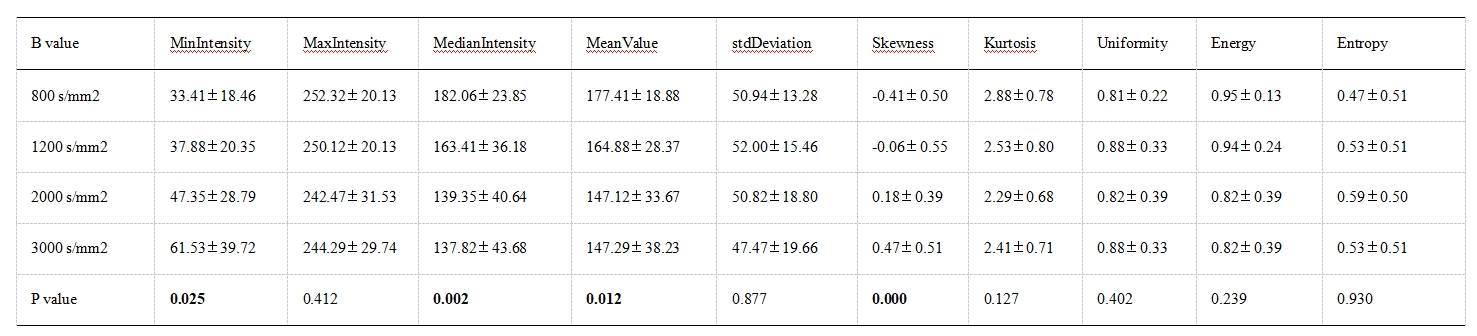
Parameters, including MinIntensity, MedianIntensity, MeanValue, and Skewness, were significantly different among DWI images with different b values (b = 800, 1200, 2000, and 3000 s/mm2, respectively) with P values of 0.025, 0.002, 0.012, and 0.000, respectively. (Table 1)Discussion and Conclusion
Texture analysis based on DWI maps with different b values can serve as a preoperative and non-invasive method for evaluating heterogeneity of prostate cancer. MinIntensity, MedianIntensity, MeanValue, and Skewnesswere all significantly different among DWI images with different b values.Acknowledgements
No acknowledgement.References
[1] World Cancer Research Fund International/American Institute for Cancer Research Continuous Update Project Report: Diet, Nutrition, Physical Activity, and Prostate Cancer. 2014.
[2] Kilinç R, Doluoglu OG, Sakman B, et al. The Correlation between Diffusion-Weighted Imaging and Histopathological Evaluation of 356 Prostate Biopsy Sites in Patients with Prostatic Diseases. ISRN Urology. 2012:252846.
[3] Aerts Hugo J W L., Velazquez Emmanuel Rios., Leijenaar Ralph T H., Parmar Chintan., Grossmann Patrick., Carvalho Sara., et al. Decoding tumour phenotype by noninvasive imaging using a quantitative radiomics approach. Nat Commun. 2014;5:4006.
Figures