4857
The value of whole tumor volume measurement texture analysis based on ADC images in differentiating DCIS from DCISM: Apreliminary study.1First affiliated hospital of dalian medical university, Dalian, China, 2GE Healthcare, Beijing, China
Synopsis
In this study, we used the whole tumor volume measurement of texture analysis based on ADC images to identify breast ductal carcinoma in situ (DCIS) and DCIS with microinvasion (DCISM), which revealed to be feasible approach for differentiating between DCIS and DCISM.
Introduction
Due to its invasive and metastatic potential, DCISM might be seen as a distinct entity from DCIS; yet, it is very challenging to distinguish DCISM from DCIS on the conventional MRI because of similar manifestations. The utility of apparent diffusion coefficient (ADC) values from diffusion-weighted imaging (DWI) for differentiation of breast lesions have been well established. Previous studies have shown that ADC measurements are based on the manual regions-of-interest (ROI) placement from a single representative slice of the DCIS lesion, which might be limited in reflecting the whole-tumour characteristics. However, currently there are no studies that confirm its feasibility in distinguishing between breast ductal carcinoma in situ (DCIS) and DCIS with microinvasion (DCISM).Materials and Method
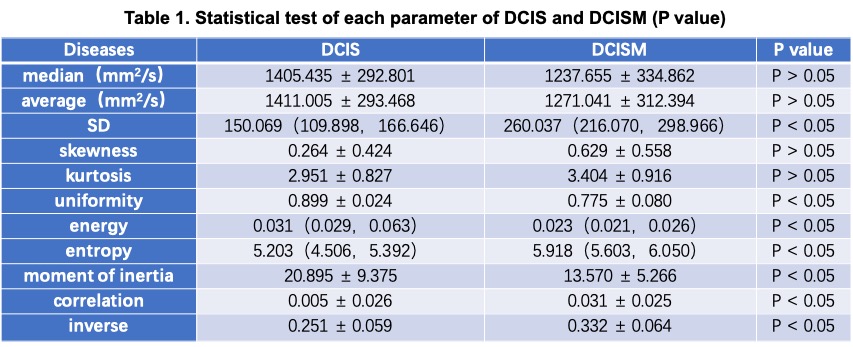
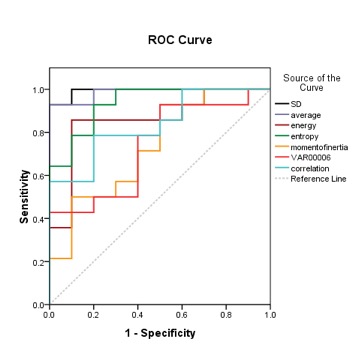
The data from 10 patients with DCIS and 14 patients with DCISM confirmed by operation and pathology were retrospectively analyzed. All patients underwent breast DWI sequence scanning (b value was 1000 s/mm2) before operation. ADC images were obtained after post-processing. ROI was delineated along the edge of the tumors with Omni-Kinetics software. After fusion, the texture parameters of the tumors were obtained, including median, average value, standard deviation, skewness, kurtosis, uniformity, energy, entropy, moment of inertia, correlation and inverse difference. Independent sample ttest (normal distribution) or Mann-Whitney rank sum test (skewed distribution) were used to compare the differences of texture parameters between DCIS and DCISM. ROC curve was used to evaluate the discriminant efficacy of texture parameters with statistical differences between DCIS and DCISM.Results
The median, average value, standard deviation, skewness, kurtosis, uniformity, energy, entropy, moment of inertia, correlation and inverse difference of DCIS group were (1405.435 ±292.801) mm2/s, (1411.005 ±293.468) mm2/s, 150.069 (109.898, 166.646), 0.264 ±0.424, 2.951 ±0.827, 0.899 ±0.024, 0.031 (0.029, 0.063), 5.203 (4.506, 5.392), 20.895 ±9.375, 0.005 ±0.026, 0.251 ±0.059, respectively. The DCISM were (1237.655 ±334.862) mm2/s, (1271.041 ±312.394) mm2/s, 260.037 (216.070, 298.966), 0.629 ±0.558, 3.404 ±0.916, 0.775 ±0.080, 0.023 (0.021, 0.026), 5.918 (5.603, 6.050), 13.570 ±5.266, 0.031 ±0.025, 0.332 ±0.064, respectively (Table 1). The standard deviation, entropy, correlation and inverse differences in DCIS group were lower than those in DCISM group, and the uniformity, energy and moment of inertia in DCISM group were higher compared to those in DCISM group, with statistical significance (P<0.05). There were no significant differences in median, average value, skewness and kurtosis between the two groups (P>0.05). The AUC of standard deviation, uniformity, energy, entropy, moment of inertia, correlation and inverse difference in differentiating lesions were 0.993, 0.986, 0.857, 0.936, 0.736, 0.736 and 0.836, respectively (Figure 1).Discussion and Conclusion
Recent studies have revealed that patients with DCISM have worse cancer-specific survival, disease free survival, and overall survival, as well as a higher mortality rate than patients with DCIS [1, 2]. Differentiating DCISM from DCIS via preoperative imaging can help to predict the prognosis in patients. The whole tumor volume measurement texture analysis based on ADC maps has been preliminarily applied in the diagnosis of benign and malignant breast tumors [3]. In this study, the whole tumor volume measurement of texture analysis based on ADC maps was used to compare the MRI features of DCIS and DCISM. The assessment was feasible for differentiating between DCIS and DCISM. Standard deviation, uniformity, energy, entropy and inverse difference revealed to be effective identification parameters. Standard deviation value represents the amount of variation or dispersion from the mean of the values in the image ROI. Uniformity value represents a measure of the sum of the squares of each discrete value in the image ROI. This is a measure of the heterogeneity of an image, where a greater uniformity implies a greater heterogeneity or a greater range of discrete image values. Entropy value is minimized when the mass is completely homogeneous, and entropy value increases when the mass is heterogeneous. Energy, which is known as the angular second moment, is a measure of the homogeneity of an image [4]. Our results revealed that DCISM was more heterogeneous than DCIS, while the standard deviation value, uniformity value and entropy value of DCISM were significantly higher than DCIS, and the energy value of DCIS was significantly higher than DCISM. These findings have certain clinical application value and could provide more reliable results to reflect biological characteristics of the breast lesions.Acknowledgements
This work was supported by the Basic Scientific Research Projects of the Universities in Liaoning Province (5061104) and The Provincical Natural Science Foundation of China (2019-ZD-0907).References
[1] Duffy S W, Dibden A, Michalopoulos D, et al. Screen detection of ductal carcinoma in situ and subsequent incidence of invasive interval breast cancers: a retrospective population-based study. Lancet Oncology, 2016, 17(1):109-114.
[2] Yu K D, Wu L M, Liu G Y, et al. Different Distribution of Breast Cancer Subtypes in Breast Ductal Carcinoma in situ (DCIS), DCIS with Microinvasion, and DCIS with Invasion Component. Annals of Surgical Oncology, 2011, 18(5):1342.
[3] You K J , Joo K J , Won L J , et al. Risk stratification of ductal carcinoma in situ using whole-lesion histogram analysis of the apparent diffusion coefficient. European Radiology, 2018.10.1007/s00330-018-5666-x.
[4] Chaddad A , Tanougast C . Extracted magnetic resonance texture features discriminate between phenotypes and are associated with overall survival in glioblastoma multiforme patients. Medical & Biological Engineering & Computing, 2016, 54(11):1707-1718.
Figures