4856
MRI texture analysis based on 3D tumor measurement in differential diagnosis of benign and malignant presacral lesion
jian jiang1 and ailian liu1
1The first affiliated hospital of Dalian medical university, Dalian, China
1The first affiliated hospital of Dalian medical university, Dalian, China
Synopsis
My study is to evaluate the diagnostic value of 3D MRI texture analysis based on T1WI, T2WI, DKI and contrasted-enhanced T1WI MRI sequences in differential diagnosis of benign and malignant presacral lesion after resection of rectal carcinoma
Purpose
To evaluate the diagnostic value of 3D MRI texture analysis based on MRI sequences in differential diagnosis of benign and malignant presacral lesion after resection of rectal carcinomaMethods
Postoperative MRI and clinical data of 26 patients with histopathologically confirmed presacral lesion (12 postoperative granulation or fibrous tissue and 14 local recurrence tumors) were retrospectively analyzed. The regions of interest (ROIs) covering the entire lesion were manually delineated on axial slices using O.K. (Omni Kinetics, GE Healthcare, China) software; and the histogram and GLCM features based on T1WI, T2WI, DKI and contrasted-enhanced T1WI MRI sequences were automatically generated. Statistical package for social science (SPSS) 12.0 and R language (RStudio Version 1.0.143 2009-2016 RStudio, Inc.) were used for data analysis.Results
Based on contrasted-enhanced T1WI features, the uniformity resulted as the best feature for diagnosis, with the AUC of 0.738. The presacral lesions were differentiated on T1WI, T2WI and DKI with the highest AUC of 0.952, 0.833 and 0.869, which corresponded to range, entropy and standard deviation. After modeling, the accuracy of the contrasted-enhanced T1WI, T1WI, T2WI and DKI features model was 0.892, 0.857, 0.844and 0.914, respectively.Conclusion
MRI texture analysis could be used as a new noninvasive method for identification of benign and malignant presacral lesion for the patients of rectal cancer after operation.Acknowledgements
NReferences
NFigures
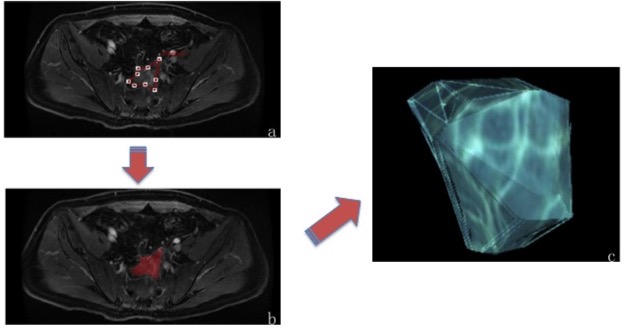
(a) A contrasted-enhanced T1WI image generated by Omni-kinetics software to depict ROI of the tumor. (b) 3D ROI image of tumor (red area) that is calculated to superimpose at all levels in the contrasted-enhanced T1WI map. (c) A three-dimensional image of the tumor
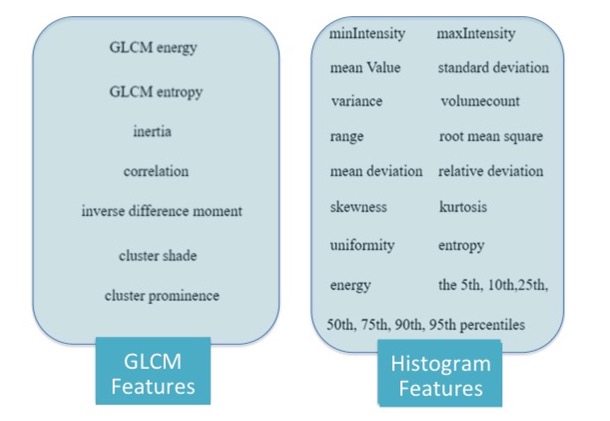
A total of 29 Histogram and GLCM features
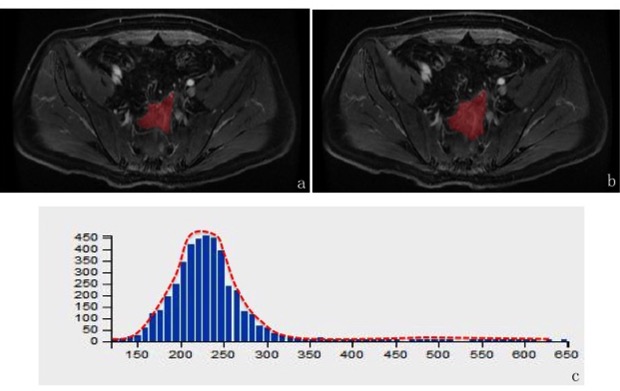
A single case - a male patient of rectal cancer after operation, 65 years old, diagnosed with local recurrence tumors. (a-b) 3D ROI image of tumor (red area) that is calculated to superimpose at all levels in the contrasted-enhanced T1WI map. (c) Contrasted T1WI signal histograms. Centered on the spike, the voxel distribution on the left side of the peak is larger than that on the right side.
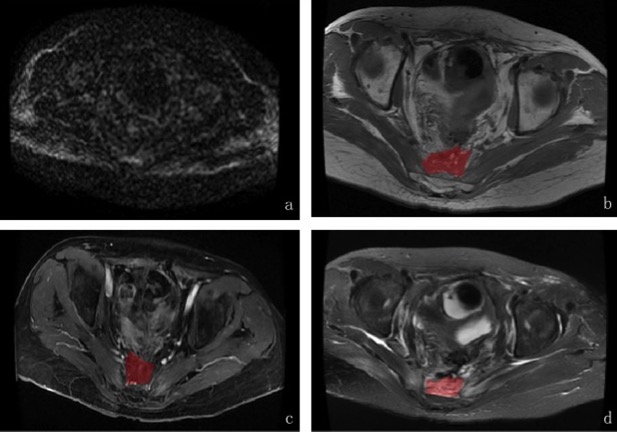
A single case - a female patient of rectal cancer after operation, 52 years old diagnosed with granulation tissue. (a-d) DKI, T1WI, contrasted T1WI, T2WI signal images. The signal (red area) was high on T2WI and was low on T1WI. The signal was enhanced.