4855
Heterogeneity of cellularity in breast cancer from diffusion q-space MRI1Aberdeen Biomedical Imaging Centre, University of Aberdeen, Aberdeen, United Kingdom, 2Pathology department, Aberdeen Royal Infirmary, Aberdeen, United Kingdom, 3Breast Unit, Aberdeen Royal Infirmary, Aberdeen, United Kingdom, 4Francis Crick Institute, London, United Kingdom, 5School of Medicine, University of Aberdeen, Aberdeen, United Kingdom
Synopsis
Breast cancers often present a spatially heterogenous response to treatment manifesting as diverse variations in the underlying distribution of cellularity. We hypothesised that kurtosis from diffusion q-space imaging provides a higher effect gradient to assess the amount of entropy and dispersion in breast cancer cellularity than measures of diffusion displacement. We investigated whole breast tumours excised from surgery, with imaging performed same day overnight on a clinical 3T MRI system. The entropy and dispersion obtained from kurtosis were significantly higher than that obtained from displacement measurements, yielding a higher effect gradient, and significantly correlated with the histologic cellularity.
Introduction
Response guided neoadjuvant chemotherapy has been shown to improve survival rate in patients with breast cancer, with response exhibited at an early stage of treatment 1. However, tumours often present a spatially heterogenous response to treatment 2, manifesting as diverse variations in the underlying distribution of cellularity, which mask accurate radiological assessment of patient response 3. Recently, diffusion q-space imaging (QSI), mapping the full width at half maximum of diffusion displacement (FWHM), was shown to provide a more sensitive assessment of breast tumour cellularity than existing diffusion imaging methods, quantifying the asymmetry (skewness) across whole tumour histogram distributions proposed to reflect the proportion of viable tumour tissue 4. Now, in order to differentiate heterogeneity response at a personalised care level, a more sensitive QSI analysis approach is required to discern the fine variations in underlying cellularity. In this study we hypothesised that kurtosis, measuring the extent which water diffusion is non-Gaussian 5, provides a higher effect gradient to assess the amount of entropy and dispersion in breast cancer cellularity than measures of diffusion displacement.Methods
To probe this hypothesis, heterogeneity features derived from QSI in twenty freshly excised invasive carcinoma breast cancers from patients (age range, 35–78 years) were systematically compared. This study was approved by NHS Research Ethics Committee and written informed consent was obtained prior to imaging.The excised whole tumour was placed in a sealed container filled with 10% buffered formalin solution and immobilised using a specially designed holding harness 4. Magnetic resonance imaging was performed using a clinical 3T MRI scanner (Achieva TX, Philips Healthcare, Best, Netherlands), using the body coil for uniform transmission and a 32-channel receiver head coil for high sensitivity signal detection. QSI was performed using multi-shot pulsed gradient spin echo (PGSE) sequence with SPIR fat suppression to acquire diffusion weighted images over 3 orthogonal diffusion directions for 32 equidistant q-values from 10.4 to 655 cm-1, with diffusion times of δ/Δ of 24.9/37.8 ms, field of view of 141×141 mm2, slice thickness of 2.2 mm, matrix size of 64×64, in plane resolution of 2.2×2.2 mm2, repetition time (TR) of 5900 ms, echo time (TE) of 94 ms, and 7–10 slices depending on tumour size.
Images were analysed using in house software written in MATLAB (MathWorks, Natick, USA). Diffusion-weighted images acquired for each of the 3 orthogonal diffusion gradient directions were averaged. QSI analysis was performed voxel-wise, to compute the displacement probability density function (PDF) from the fast Fourier transform of the diffusion signal mirrored around q-value of 0 cm-1. QSI parameters were derived from the displacement PDF following spline interpolation. FWHM was measured as the width (in mm) of PDF at half peak height, and probability of zero displacement (P0) was measurement as the maximum height of PDF 6,7. Kurtosis was measured as the 4th moment of the profile between 50 mm and 50 mm. Normalised histogram distributions of FWHM, P0 and kurtosis were extracted from regions-of-interest previously drawn to encompass the whole tumour mass on diffusivity maps, and first order entropy and dispersion (width between the 10th and 90th histogram percentiles) were extracted. The same procedure was performed to extract heterogeneity parameters from histologic cellularity histogram distributions 4.
Overall differences in entropy and dispersion from kurtosis, FWHM, and P0 was examined using Friedman Test, and post-hoc Wilcoxon signed-rank tests. The relative effect gradient of the entropy and dispersion values obtained from FWHM and P0 was compared to values obtained from kurtosis using as the line of best fit gradient and reported as the percentage difference from gradient slope of 1, for instances of significant Pearson’s correlation. The correspondence between the heterogeneity features obtained from QSI and cellularity were examined using Pearson’s correlation.
Results
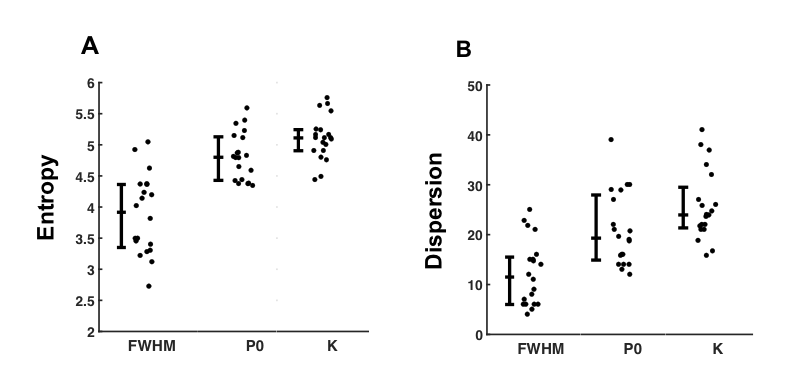
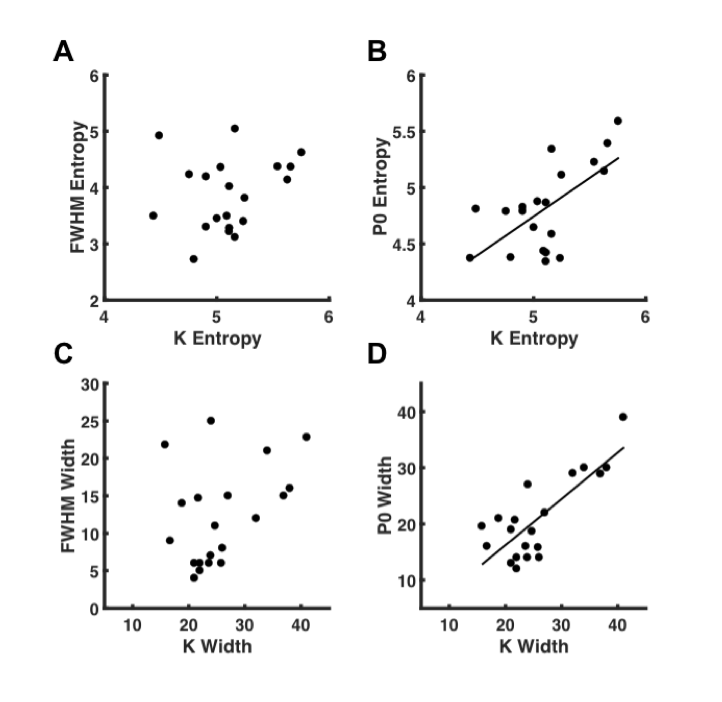
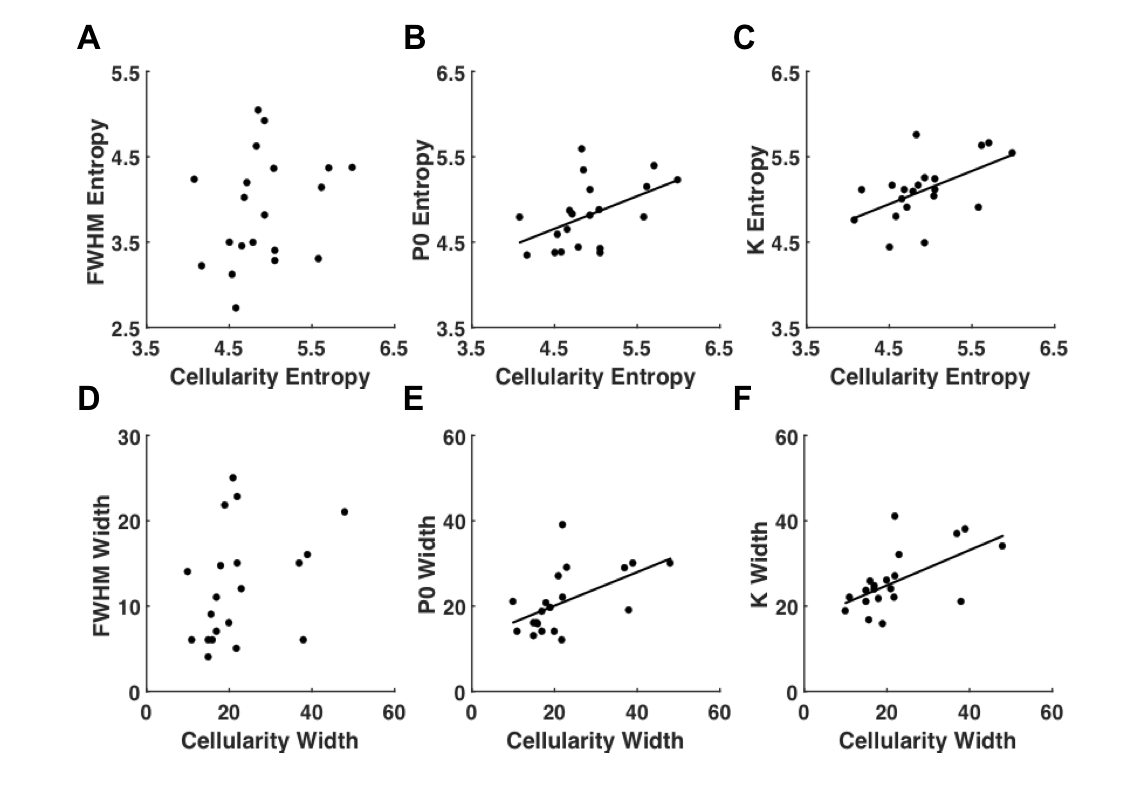
There was a significant difference (P<0.0005) between the entropy obtained from kurtosis, P0, and FWHM (Fig.1). Kurtosis yielded significantly higher entropy 5.11 (4.90 – 5.25), and provided a higher effect gradient compared to P0, 0.310/0.690 (44.9%) (Fig.2). Contrary to FWHM, there was significant (P<0.05) linear correlation between the entropy of cellularity from histology and the entropy from kurtosis (R = 0.541) and P0 (R = 0.496) (Fig.3).There was a significant difference (P<0.0005) between the dispersion obtained from kurtosis, P0, and FWHM (Fig.1). Kurtosis yielded significantly higher width 23.95 (21.18 – 30.75) compared to P0 and FWHM, and provided a higher effect gradient (percentage increase) compared to the width, 0.176/0.824 (21.4%) obtained from P0 (Fig.2). There was significant (P<0.05) linear correlation between the width obtained from cellularity and the width from kurtosis (R = 0.596), and P0 (R = 0.544) (Fig.3).
Discussion
In this work, we examined whether kurtosis provides a more sensitive assessment of breast tumour heterogeneity compared to QSI measures of diffusion displacement in excised breast cancers on a 3T clinical scanner. We found kurtosis to provide a larger effect gradient for evaluating entropy and dispersion, as indicators of the irregularity and spread in underlying cellularity respectively. Furthermore, all features of tumour heterogeneity extracted from kurtosis showed significant fidelity to the cellularity heterogeneity from histology.Conclusion
Kurtosis is the most promising QSI approach to elucidate heterogenous changes to cellularity in patients exhibiting response to preoperative treatments.Acknowledgements
The authors would like to thank Dr Matthew Clemence, Philips Healthcare Clinical Science, UK, for clinical scientist support, Ms Bolanle Brikinns for patient recruitment support, Mr Gordon Buchan for experiment material support, and Ms Mairi Fuller for providing access to the patients. NHS Grampian Endowment Research Grant funds this project and Nicholas Senn is supported by EASTBIO BBSRC PhD studentship.References
[1] Minckwitz von G, Blohmer JU, Costa SD, et al. Response-Guided Neoadjuvant Chemotherapy for Breast Cancer. Journal of Clinical Oncology. 2013;31(29):3623-3630.
[2] .Just N. Improving tumour heterogeneity MRI assessment with histograms. Br J Cancer. 2014;111(12):2205-2213.
[3] Loo CE, Straver ME, Rodenhuis S, et al. Magnetic Resonance Imaging Response Monitoring of Breast Cancer During Neoadjuvant Chemotherapy: Relevance of Breast Cancer Subtype. Journal of Clinical Oncology. 2011;29(6):660-666.
[4] Senn N, Masannat Y, Husain E, et al. q-Space Imaging Yields a Higher Effect Gradient to Assess Cellularity than Conventional Diffusion-weighted Imaging Methods at 3.0 T: A Pilot Study with Freshly Excised Whole-Breast Tumors. Radiology: Imaging Cancer. 2019;1(1):e190008-e190008.
[5] Chin C-L, Wehrli FW, Fan Y, et al. Assessment of axonal fiber tract architecture in excised rat spinal cord by localized NMR q-space imaging: simulations and experimental studies. Magn Reson Med. 2004;52(4):733-740.
[6] Assaf Y, Mayk A, Cohen Y. Displacement imaging of spinal cord using q-space diffusion-weighted MRI. MRM. 2000;44(5):713-722.
[7] Yamada I, Hikishima K, Miyasaka N, et al. Esophageal carcinoma: Evaluation with q-space diffusion-weighted MR imaging ex vivo. Magn Reson Med. 2015;73(6):2262-2273.
Figures