4853
Prospective assessment of DCE-MRI parameters associated with advanced mandibular osteoradionecrosis after IMRT of head and neck cancer1Radiation Oncology, MD Anderson Cancer Center, Houston, TX, United States, 2Diagnostic imaging, MD Anderson Cancer Center, Houston, TX, United States, 3Imaging physics, MD Anderson Cancer Center, Houston, TX, United States, 4Head and Neck Surgery, MD Anderson Cancer Center, Houston, TX, United States, 5Baylor College of Medicine, Houston, TX, United States
Synopsis
Our aim was to characterize the quantitative DCE-MRI parameters associated with advanced mandibular osteoradionecrosis (ORN) in comparison with normal mandible. Thirty patients with advanced ORN after radiation of head and neck cancer were prospectively enrolled. Our results confirm there is a quantitatively significant higher degree of leakiness in the mandibular vasculature as measured using DCE-MRI parameters of areas affected with advanced grade of ORN versus healthy mandible. We were able to measure significant increases in quantitative parameters (3.3 fold Ktrans, 3 fold ve) compared to non-ORN mandibular bone.
Introduction
Osteoradionecrosis (ORN) of the mandible is a debilitating late complication of radiation therapy (RT) for head and neck cancer (HNC) patients.(1-3) Early-stage ORN can be controlled with conservative measures,(4, 5) however, progression to advanced ORN typically requires extensive surgical resection and complex reconstruction and ultimately reduction of the quality of life.(6, 7) Anatomic imaging using CT or MRI does not show bony changes until relatively late in the process when the patient is generally already experiencing symptoms. (8, 9) Dynamic contrast-enhanced magnetic resonance imaging (DCE-MRI) was shown to detect early-stage idiopathic osteonecrosis of the femur otherwise not visible on conventional MRI.(10) Our group has recently demonstrated that DCE-MRI can be used to detect alterations in bone vascularity following definitive radiotherapy to HNC.(11) However, in addition to the assessment of the quantitative DCE changes induced by RT, the characterization of these parameters in patients with actual mandibular ORN is also required. To this end, we sought to characterize the quantitative DCE-MRI parameters associated with the established diagnosis of advanced mandibular ORN compared with normal mandible.Methods
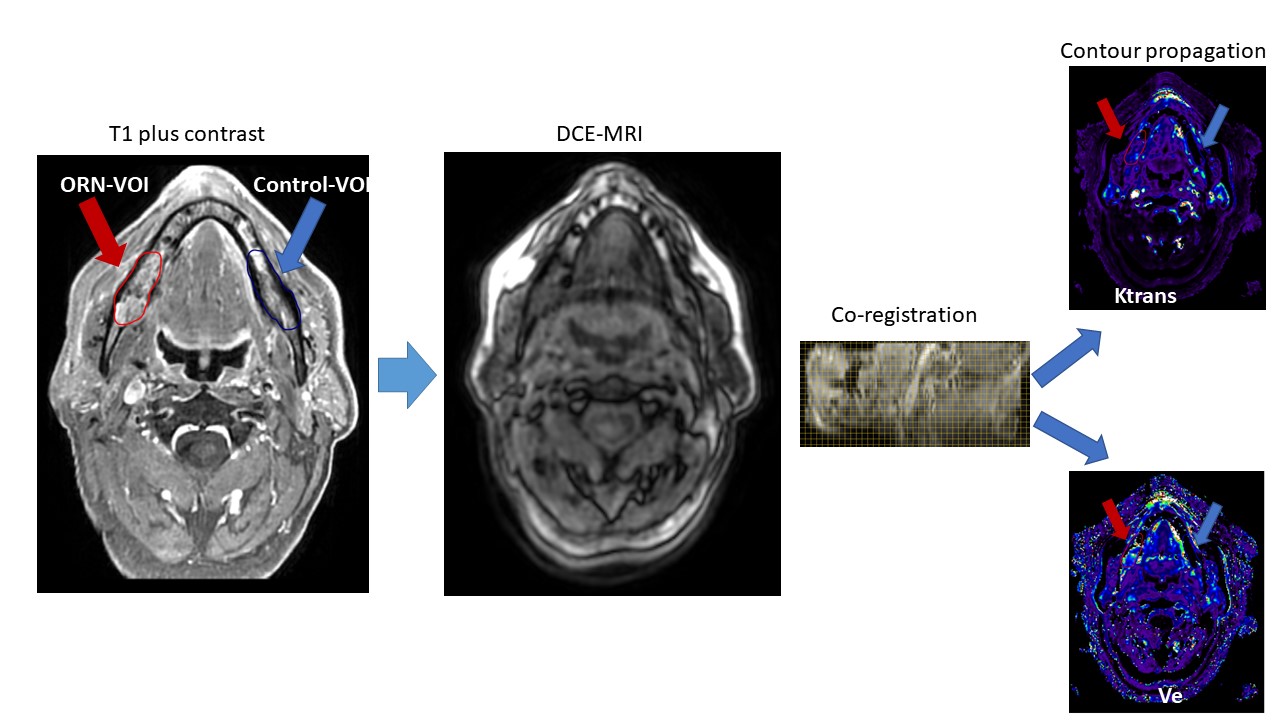
Patients with advanced ORN after curative-intent radiation treatment of HNC were prospectively enrolled after institutional-review board approval and study-specific informed consent. Eligibility criteria included; age>18 years, pathological evidence of head and neck malignancy with history of curative-intent external beam radiotherapy; patients with clinically confirmed high-grade ORN requiring surgical intervention; and no contraindications to MRI. Prior to DCE-MRI, T1 mapping was performed using a total of 6 variable flip angles. The DCE-MRI acquisition consisted of a 3D SPGR sequence. Extended Toft’s pharmacokinetic model was used for analysis. Motion correction was applied. Manual segmentation of advanced ORN 3-D volume was done using anatomical sequences (T1, T2, and T1+contrast) to create ORN volumes of interest (ORN-VOIs). Subsequently, normal mandibular VOIs were segmented on the contralateral healthy mandible of similar volume and anatomical location (i.e. mirror image) to create self-control VOIs. Finally, anatomical sequences were co-registered to DCE sequences and contours were propagated to the respective quantitative parameter maps. The study workflow is summarized in Figure 1.Results
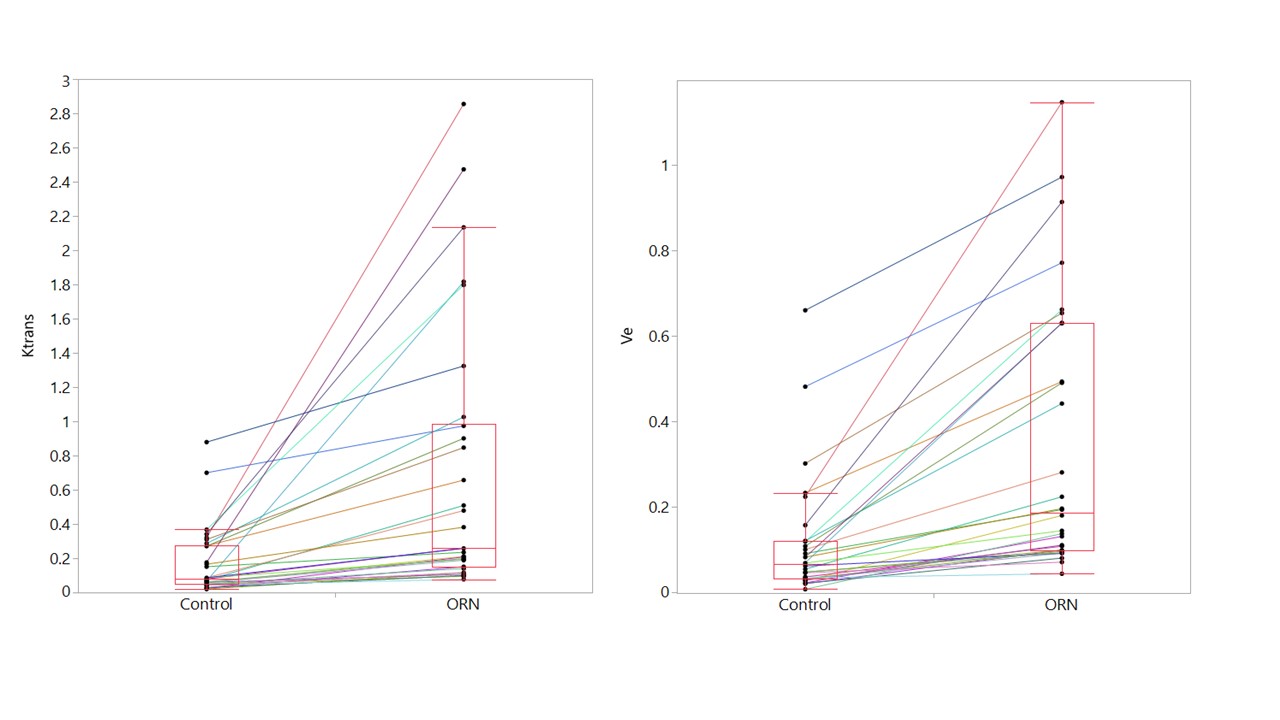
Thirty patients were included. Median age at diagnosis was 58 years (range 19-78), and 83% were men. The site of tumor origin was in the oropharynx, oral cavity, salivary glands, and nasopharynx in 13, 9, 6, and 2 patients, respectively. The median time to ORN development after completion of IMRT was 38 months (range 6-184). Using matched pairs analysis, there were a statistically significant higher Ktrans and ve values in ORN-VOIs compared with controls (0.7 vs 0.17 min−1, and 0.34 vs 0.11, p<0.0001 for both). The average relative increase of Ktrans in ORN-VOIs was 3.3 folds healthy mandibular control VOIs (range 1.4-27). Moreover, the relative increase of ve in ORN-VOIs was 3 folds the controls (range 1.3-19.3). Using combined Ktrans and ve parameters, 27 patients (90%) displayed at least a 200% increase of either of the studied parameters in the ORN-VOIs compared with their healthy mandible control VOIs. Figure 2 depicts the comparison of Ktrans and ve values in ORN-VOIs compared with controls. Kep did not show a significant difference between ORN-VOIs versus controls (0.8 vs 0.7 min−1, p=0. 1).Discussion
Our findings demonstrated a distinct profile of DCE-MRI parameter maps in mandibular volumes harboring ORN as compared to normal mandible. DCE parameter indicating vascular compromise showed a significantly higher degree of leakiness in the mandibular vasculature as measured using Ktrans and ve of areas affected with an advanced grade of ORN versus healthy mandible. We were able to measure significant increases in quantitative parameters with an average of around three folds increase of both Ktrans and Ve compared to values from healthy mandibular bone. The vast majority of patients (90%) had at least doubling of the values of either Ktrans or ve for ORN-VOIs as compared with control VOIs. This study represents the initial characterization of quantitative vascular parameters driven from DCE-MRI for head and neck cancer patients treated with IMRT and suffered radiation-induced advanced ORN toxicity.Conclusion
Our results confirmed a higher degree of vascular leakiness in the mandibular areas of ORN as measured using DCE-MRI parameters when compared with healthy mandible. Further efforts are ongoing to validate these findings to be able to use these DCE-MRI parameter thresholds for early detection of subclinical cases of ORN.Acknowledgements
This work is supported by NIH/NIDCR R01 grant (5R01DE025248-04)References
1. Teng MS, Futran ND. Osteoradionecrosis of the mandible. Current Opinion in Otolaryngology & Head and Neck Surgery. 2005;13(4):217-221.
2. Jereczek-Fossa BA, Orecchia R. Radiotherapy-Induced Mandibular Bone Complications. Cancer Treatment Reviews. 2002;28(1):65-74.
3. Sciubba JJ, Goldenberg D. Oral complications of radiotherapy. The Lancet Oncology. 2006;7(2):175-183.
4. Costa DA, Costa TP, Netto EC, et al. New perspectives on the conservative management of osteoradionecrosis of the mandible: A literature review. Head Neck. 2016;38(11):1708-1716.
5. Lambade PN, Lambade D, Goel M. Osteoradionecrosis of the mandible: a review. Oral Maxillofac Surg. 2013;17(4):243-249.
6. Zaghi S, Miller M, Blackwell K, Palla B, Lai C, Nabili V. Analysis of surgical margins in cases of mandibular osteoradionecrosis that progress despite extensive mandible resection and free tissue transfer. Am J Otolaryngol. 2012;33(5):576-580.
7. Wang CC, Cheng MH, Hao SP, Wu CC, Huang SS. Osteoradionecrosis with combined mandibulotomy and marginal mandibulectomy. Laryngoscope. 2005;115(11):1963-1967.
8. Hamilton JD, Lai SY, Ginsberg LE. Superimposed infection in mandibular osteoradionecrosis: diagnosis and outcomes. J Comput Assist Tomogr. 2012;36(6):725-731.
9. Khojastepour L, Bronoosh P, Zeinalzade M. Mandibular bone changes induced by head and neck radiotherapy. Indian J Dent Res. 2012;23(6):774-777.
10. Chan WP, Liu YJ, Huang GS, et al. Relationship of idiopathic osteonecrosis of the femoral head to perfusion changes in the proximal femur by dynamic contrast-enhanced MRI. AJR Am J Roentgenol. 2011;196(3):637-643.
11. Sandulache VC, Hobbs BP, Mohamed AS, et al. Dynamic contrast-enhanced MRI detects acute radiotherapy-induced alterations in mandibular microvasculature: prospective assessment of imaging biomarkers of normal tissue injury. Scientific Reports. 2016;6:29864.
Figures