4849
Multiparametric MRI with cluster analysis for early assessment of radiotherapy response in a human small-intestine neuroendocrine tumor model1Radiation Physics, Clinical Sciences, Gothenburg, Sweden
Synopsis
The diffusion coefficient (D) and T2* reflect clinically significant tumor characteristics, including cellularity and hypoxia. Methods to non-invasively assess D and T2* at diagnosis and early follow up are desired. The aim of this work was to evaluate the sensitivity of D and T2* to radiotherapy effects in a neuroendocrine tumor model, and to evaluate clustering as an objective method to facilitate D and T2* analysis. 20 mice were examined using MRI before and repeatedly for 2 weeks after tumor irradiation (8Gy) . We show that D and T2* are potential response biomarkers, and that clustering improves response prediction for T2*.
Introduction
Heterogeneous tumors with highly cellular regions due to excessive proliferation and/or loss of apoptotic function, and hypoxic regions due to dysfunctional and inadequate vascularity, are associated with increased malignancy, higher metastatic potential and poor prognosis. Non-invasive methods to accurately characterize and localize problematic tumor regions at diagnosis would facilitate the decision to use aggressive localized treatments where required, and enable early response evaluation.T2*- and diffusion weighted (DW) MRI are sensitive to deoxyhemoglobin concentration and microstructural diffusion restrictions such as cell membranes, respectively, and have been suggested as potential non-invasive biomarkers for hypoxia and excessive cellularity1. However, the selection of parameter threshold levels for initial tumor characterization or response assessment has been associated with subjectivity, and variations between tumor types, grades and therapies2. Data-driven cluster-based classification of tumor tissues using MRI-derived parameters has, however, been shown to facilitate objective assessment3
The aim of this project was to investigate if D and T2*, as well as clustering based on D and T2*, can be used to predict and assess radiotherapy response in a small-intestine neuroendocrine tumor model.
Methods
Balb/C mice (n=20) with subcutaneous human neuroendocrine tumor (GOT1) were included in the study when tumor diameters were approximately 1.5 cm. Tumors were then irradiated externally to 8 Gy absorbed tumor dose (6MV photons, Varian Medical Systems). This dose was selected to avoid complete response in all tumors, and thereby allow the study of correlations with a range of response levels.Tumor volumes were continuously monitored using external calipers.
MRI experiments were performed on a 7T preclinical Bruker BioSpec with a 30-mm tr/tx coil (Rapid) the day before (day -1) treatment (day 0), and repeated on days 2, 3, 7 and 15. Experiments included 1st&2nd order shimming, T2*-mapping (MGE, TR/TE [ms]: 2500/3, 7, 12, 16, 20, 24, 28 and 32, NSA: 3, Pixel/slice dim [mm]: 0.2×0.2/1.0) and DWI (SE-EPI, TR/TE [ms]: 3000/20, NSA: 20, Pixel/slice dim [mm]: 400×400/500, b-values [s/mm2]: 0, 28, 87, 163, 381, 933, δ/Δ [ms]: 4/9).
Post-processing and statistical analyses were performed in MATLAB (MathWorks) using customized scripts and algorithms: T2*-values were calculated pixelwise using a mono-exponential model, and D was estimated using a Bayesian approach as previously described4. The Gaussian mixture model (GMM) was used to find the number and shapes of the gaussian distributions required to best describe the histogram of the pooled T2* data (voxel values from all tumors and time points). Data were classified according to the gaussian component it most likely belonged, and mapped back to the images. Cluster maps for D were derived using the same procedure. Correlations were studied using the Pearson pairwise linear correlation coefficient (r).
The Gothenburg Ethical Committee on Animal Research approved this study.
Results & Discussion
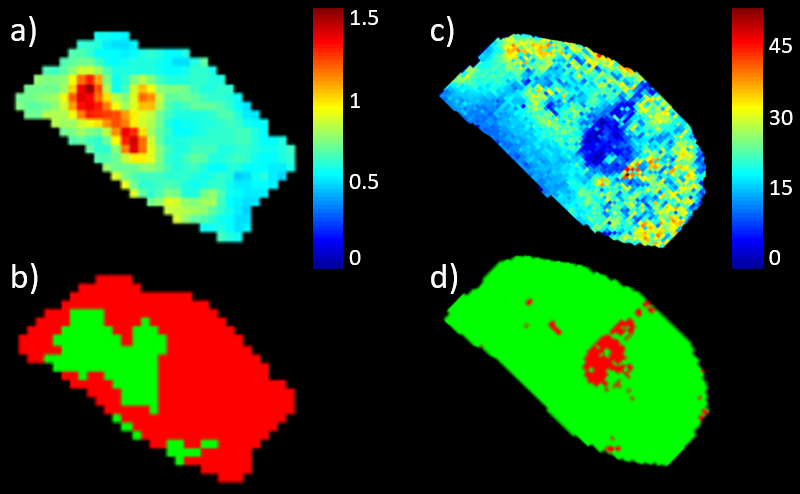
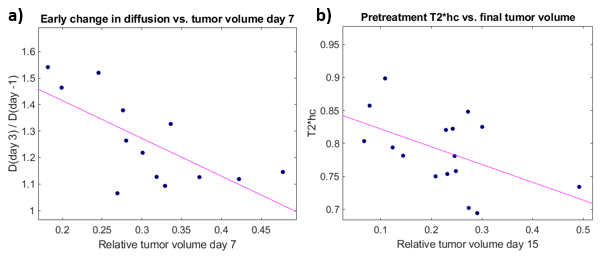
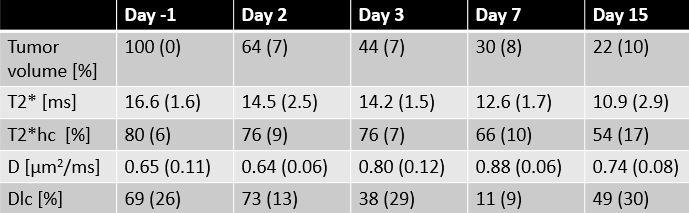
GMM analysis regarded that 2 gaussian components were optimal to describe both D and T2* data. The lower/higher component mean values for the T2* and D clusters were 9.9/16.9 ms and 0.63/0.87 µm2/ms, respectively. Fig. 1 shows typical parametric maps of D and T2* (day -1), with corresponding cluster maps. The fraction of the tumor area assigned to the low-D cluster (red in fig. 1b) and high-T2* cluster (green in fig. 1d) are henceforth designated Dlc and T2*hc, respectively. Evidently, the clustering separates regions of suspiciously deviating parametric values for both D and T2*, and in a completely objective manner. Biological analysis of the segmented regions is required to validate the clinical significance of the segmentation. Histological/immunohistochemical analysis of tumor slices corresponding to the imaged sections are currently being processed, and will include markers for cellular morphology, apoptosis, proliferative activity, vascularity/angiogenesis and hypoxia. These will be matched spatially with the parametric maps and clusters and correlations will be studied.The tumor volumes, T2*, and T2*hc decreased monotonically after treatment, whereas D increased significantly from day 2 to day 7 (tab. 1). Increased diffusion is expected after radiotherapy since DNA damage induce apoptosis and reduce cellularity. In fact, we also found that a higher relative increase in D from day -1 to day 3 correlated with increased tumor volume reduction the first week after treatment (r = -0.7, p = 0.008) (fig. 2b). The same correlation was found when Dlc was used instead D, however with a slightly lower correlation coefficient, but higher statistical significance (r = 0.58, p = 0.002, not shown).
Higher pretreatment T2*hc correlated with relatively lower tumor volume on day 15 (r = -0.5, p = 0.047) (fig. 2a). Adequate vascular supply, i.e. less accumulation of deoxyhemoglobin (higher T2*) and sufficient oxygenation to support radiotherapy response may explain this correlation. Corresponding correlation using tumor pretreatment median T2* values instead of T2*hc was weaker (r = -0.4, p = 0.11, not shown).
Conclusions
Our results show that both D and T2* are sensitive to radiotherapy effects in our tumor model. Cluster analysis enabled objective prediction and response assessment based on MRI parameters that reflect clinically relevant biological tumor features. T2*-based analysis seems to benefit more from clustering than D-based analysis, but our pending histological correlations must be studied before final conclusions are made. Cluster analysis can be extended also to multidimensional parametric spaces, which should be evaluated in future studies.Acknowledgements
No acknowledgement found.References
1. Horsman MR, Mortensen LS, Petersen JB et al. Imaging hypoxia to improve radiotherapy outcome. Nat Rev Clin Oncol. 2012;9(12): 674-87
2. Vaupel P, Mayer A, Hypoxia in cancer: significance and impact on clinical outcome. Cancer Metastasis Rev. 2007;26(2): 225-39
3. Katiyar P, Divine MR, Kohlhofer U et al. A Novel Unsupervised Segmentation Approach Quantifies Tumor Tissue Populations Using Multiparametric MRI: First Results with Histological Validation. Mol Imaging Biol. 2017;19(3): 391-397
4. Jalnefjord O, Montelius M, Starck G et al., Impact of prior distributions and central tendency measures on Bayesian intravoxel incoherent motion model fitting. MRM. 2018;79(3): 1674-1683
Figures