4847
Evolution of the tissue sodium concentration in brain metastases undergoing stereotactical radiosurgery: a feasilbility study1Computer Assisted Clinical Medicine, Medical Faculty Mannheim, Heidelberg University, Mannheim, Germany, 2Department of Neuroradiology, Medical Faculty Mannheim, Heidelberg University, Mannheim, Germany, 3Department of Radiation Oncology, Medical Faculty Mannheim, Heidelberg University, Mannheim, Germany
Synopsis
Brain metastases are the most common malignancy in the brain and can be caused by different primary tumors. The Sodium-SRS study is a prospective feasibility study to observe TSC changes in brain metastases around ablative stereotactical radiosurgery (SRS) treatment with 22 Gy single dose using GammaKnife. TSC was measured with 23Na MRI in two patients at three different time points. The prelimenary results showed feasibility to detect TSC dynamics in brain metastases treated with SRS, which warrants further evaluation.
Introduction
Brain metastases are the most common malignancy in the brain and can be caused by different primary tumors[1]. They are commonly treated with stereotactic radiosurgery (SRS), e.g. using a Leksell GammaKnife®[2,3]. To date, the treatment efficacy of SRS is determined by longitudinal MRI scanning and assessment of contrast-enhancing lesions[4].Tissue sodium concentration (TSC) is a biomarker for cell vitality and can be measured with 23Na MRI[5]. Multiple studies have shown the effect of different pathologies on TSC[6,7]. In brain tumors, an elevated TSC was observed[8].
We set up a prospective feasibility study (Sodium-SRS) to find out whether changes in TSC assessed by pre- and post-SRS 23Na MRI scanning would be in correlation to treatment response. This abstract includes preliminary results from two patients.
Methods
The Sodium-SRS study includes patients that are 18 years or older, diagnosed with brain metastases, and scheduled for ablative SRS with 22 Gy single dose. Only lesions larger than 4mm in diameter were evaluated due to the 23Na MRI resolution of 4x4x4mm³ per voxel.The patients undergo 23Na MRI at three different time points:
I) 2 days before SRS,
II) 5 days, and
III) 40 days after the SRS, respectively.
In addition to standard of care imaging, the patients receive additional 23Na MRI scans before and after SRS. All 23Na images were acquired after the patient’s exposure to contrast agent which has no significant impact on the TSC[9].
The 23Na MR images were acquired at 3T (MAGNETOM Trio, Siemens Healthineers,Germany), with a bird-cage dual-tuned 23Na/1H head coil (Rapid Biomedical, Rimpar, Germany). Acquisition parameters of the 3D radial density-weighted 23Na sequence[10] were: TR=100ms, TE=0.2ms, number of spokes n=9,000 with 200 samples each, resulting in an acquisition time of 15mins. Image reconstruction was performed offline within MATLAB[11] using convolution-based regridding with a Kaiser Bessel window width of 4 and application of a Hanning filter in k-space. 23Na images were quantified using two reference phantoms with 2% agarose (50mmol/l and 100mmol/l 23Na) in the FoV during every 23Na scan.
The radiotherapy treatment plan was designed in Leksell GammaPlan® 11.1.1 which enables the radiation dosage calculation (Figure 1 top left). All lesions were segmented by radiooncologists on the MPRAGE image from scan I. Two days after scan I, SRS was performed with the GammaKnife® Perfexion™ System.
The treatment plans were exported from GammaPlan as DICOM RT files and were imported into MATLAB using CERR (computational environment for radiotherapy research). Coregistration of the 23Na images to the MPRAGE image with SPM 12[12] allowed to locate the lesion ROIs from RT treatment plan on the 23Na MR images. The TSC was monitored in the irradiated lesions in scans I, II and III.
Figure 1 illustrates the workflow.
Results
A representative axial slice of the MPRAGE image from Patient 2 and the corresponding, coregistered 23Na MR scans I, II, and III are shown in figure 2.The lesion of both patients showed pre-therapeutic TSC elevations compared to the healthy appearing contralateral tissue (Scan I: $$$\bar{x}_{Patient1}=124\pm10mM$$$, $$$\bar{x}_{Patient2}= 91.20\pm4mM$$$).
TSC increased in both lesions shortly after SRS (Scan II: $$$\bar{x}_{Patient1}=144\pm10mM$$$, $$$\bar{x}_{Patient2}=94\pm6mM$$$). The elevation is more prevalent in Patient 1 than in Patient 2.
TSC decreased later to a level below their respective baseline (Scan III: $$$\bar{x}_{Patient1}=98\pm7mM$$$, $$$\bar{x}_{Patient2}=62\pm3.mM$$$). For Patient 1 it remains higher compared to the contralateral side with healthy appearing tissue.
The boxplots for the TSC dynamics in both lesions as well as in their contralateral regions are shown in figure 3.
Figure 4 shows the lesion regions from both patients on the MPRAGE image (prior to SRS) and on the 23Na MR scan I, II, and III.
Discussion
TSC dynamics were observed in both lesions as well as on their contralateral side.Literature suggests TSC values between 20 and 60mmol/l[13] in the white matter where both metastases were located, furthermore an increased TSC in brain tumors was observed previously[8] due to cell metabolism. The presented results are in alignment with these findings as both lesions showed pre-therapeutic baseline TSC elevations compared to the healthy appearing contralateral tissue and literature values.
Generally, an increased TSC can occur due to either an increased extracellular volume fraction or increased intracellular sodium concentration (or both)[14] because of malfunction of the Na+/K+ pump in the context of cellular damage. Here, shortly after SRS, an elevation in TSC was measured in the irradiated (tumor) regions.
TSC decreases 40 days after SRS (for both observed lesions) and tends towards TSC values in the healthy appearing tissue.
Future work will include comparison between TSC dynamics in the lesion and its contralateral side.
Conclusion
The initial results of the Sodium-SRS study showed feasibility to detect TSC dynamics in brain metastases treated with SRS, which warrants further evaluation on more study patients.Acknowledgements
No acknowledgement found.References
[1] Gavrilovic, Igor T., and Jerome B. Posner. "Brain metastases: epidemiology and pathophysiology." Journal of neuro-oncology 75.1 (2005): 5-14.
[2] Fukuoka, S., et al. "Radiosurgery of brain metastases with the gamma knife." Stereotactic and functional neurosurgery 66.Suppl. 1 (1996): 193-200.
[3] Leksell, Elekta Instrument AB, Stockholm, Sweden
[4] Patel, T. R., et al. "A comprehensive review of MR imaging changes following radiosurgery to 500 brain metastases." American Journal of Neuroradiology 32.10 (2011): 1885-1892.
[5] Hilal, Sadek K., et al. "In vivo NMR imaging of sodium-23 in the human head." Journal of computer assisted tomography 9.1 (1985): 1-7.
[6] Neumaier-Probst, Eva, et al. "A double-tuned 1H/23Na resonator allows 1H-guided 23Na-MRI in ischemic stroke patients in one session." International Journal of Stroke 10.SA100 (2015): 56-61.
[7] Haneder, Stefan, et al. "23 Na-MRI of recurrent glioblastoma multiforme after intraoperative radiotherapy." Neuroradiology 57.3 (2015): 321-326.
[8] Ouwerkerk R et al (2003) Tissue sodium concentration in human brain tumors as measured with 23Na MR imaging. Radiology 227(2): 529–537.
[9] Paschke, Nadia Karina, et al. "Influence of gadolinium-based contrast agents on tissue sodium quantification in sodium magnetic resonance imaging." Investigative radiology 53.9 (2018): 555-562.
[10] Nagel, Armin M., et al. "Sodium MRI using a density‐adapted 3D radial acquisition technique." Magnetic Resonance in Medicine: An Official Journal of the International Society for Magnetic Resonance in Medicine 62.6 (2009): 1565-1573.
[11] Matlab 2015a, The MathWorks, Inc., Natticks, USA
[12] SPM12, Wellcome Centre for Human Neuroimaging, UCL, London, United Kingdom
[13] Madelin, Guillaume, and Ravinder R. Regatte. "Biomedical applications of sodium MRI in vivo." Journal of Magnetic Resonance Imaging 38.3 (2013): 511-529.
[14] Nagy I et al (1983) Correlation of malignancy with the intracellular Na+:K+ ratio in human thyroid tumors. Cancer Res 43(11):5395–5402
Figures
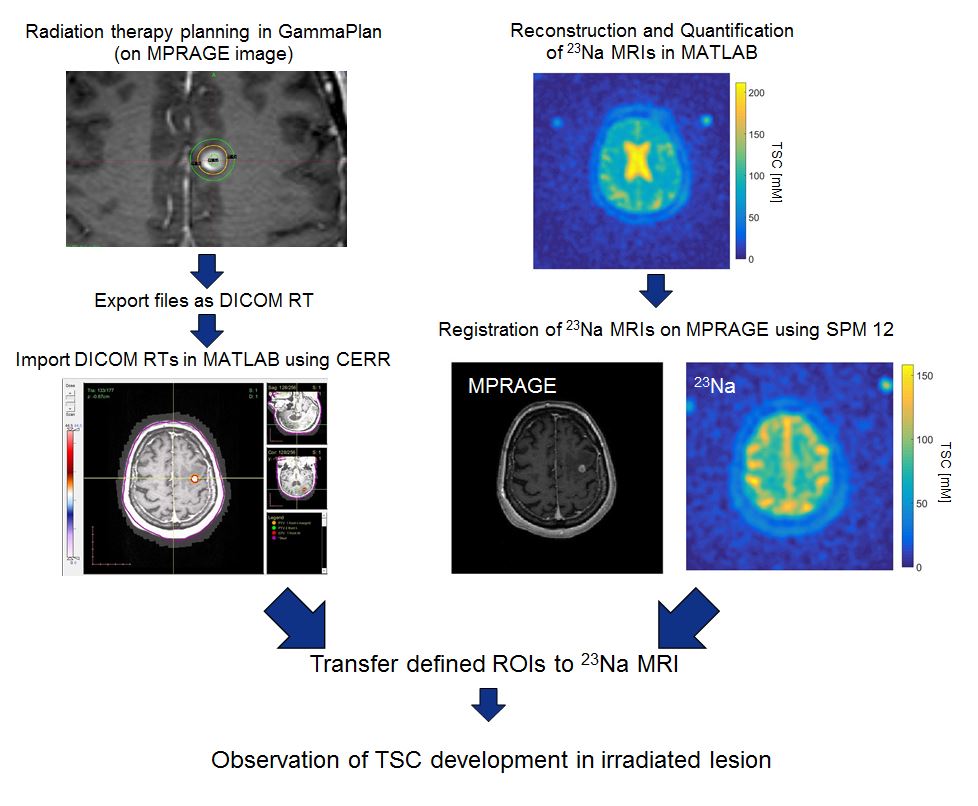
Figure 1: Graphical illustration of the workflow.
1. Left: Planning of the SRS in GammaPlan based on MPRAGE and Export as DICOM RT. Right: Reconstruction and quantification of 23Na image in MATLAB
2. Left: Import DICOM RTs into MATLAB using CERR. Right: Registration of 23Na MRI to MPRAGE using SPM 12
3.Transfer the ROIs from MPRAGE (defined in GammaPlan) to 23Na MRI
4. Evaluation of TSC daynamics in irradiated lesions and contralateral side

Figure 2: One axial slice of Patient 2.
Top: MPRAGE on which the SRS was planned
Bottom: The coregistered 23Na MRI scan I, II, and III
The lesion is encircled in red, the contralateral, healthy appearing region in green on all images.
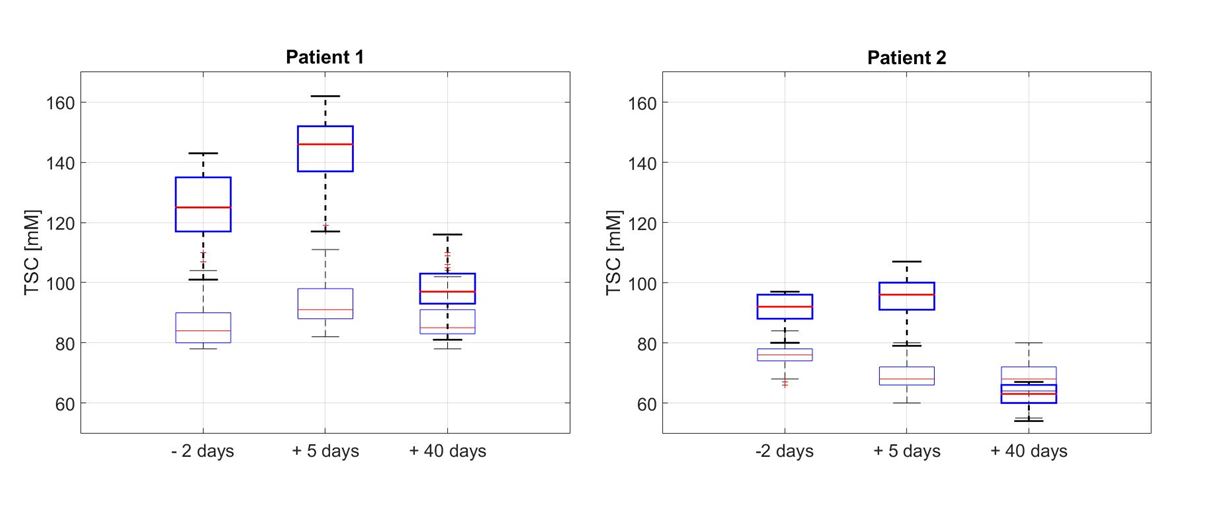
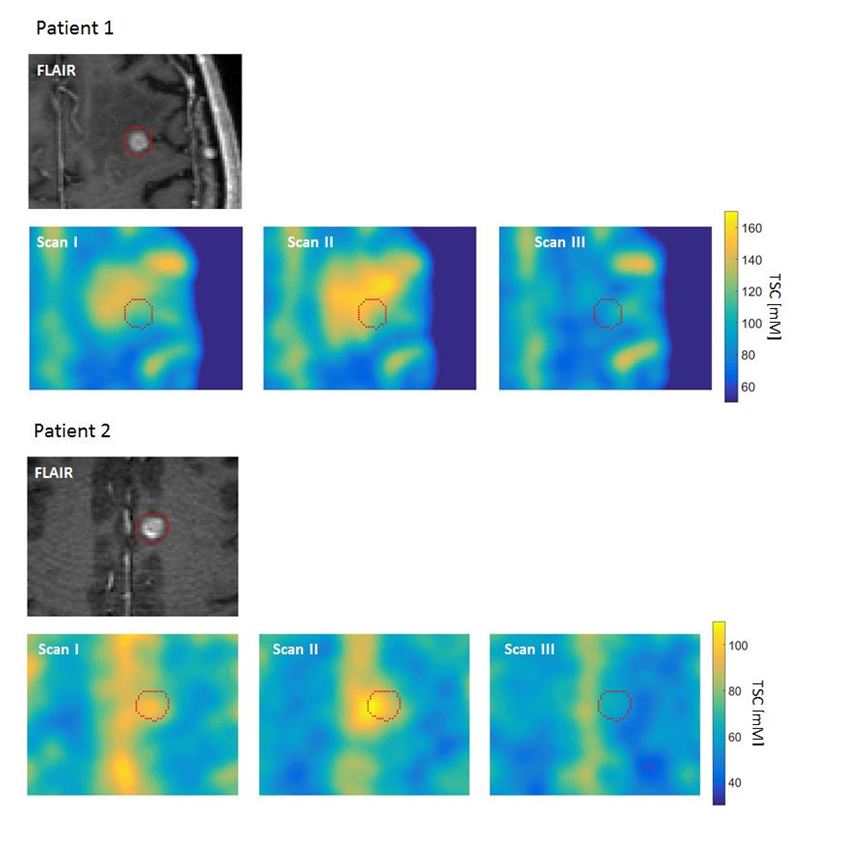
Figure 4: Enlarged lesion region on the MPRAGE image and quantified 23Na MRI scan I, II, and III with the respective lesion regions encircled in red for Patient 1 (top) and Patient 2 (bottom).