4845
Heterogeneity analysis in T2 mapping enables highly sensitive radiotherapy response measurement and prediction in pancreatic allografts.1Cancer Physiology, H. Lee Moffitt Cancer Center, Tampa, FL, United States, 2Institute of Mathematical Oncology, H. Lee Moffitt Cancer Center, Tampa, FL, United States
Synopsis
Tumor response to radiotherapy (XRT) varies significantly between patients, calling for improved response quantification methods. Tumor response to fractionated XRT was quantified in a mouse model of pancreatic cancer with multiple MR sequences. Texture feature analysis of quantitative T2 maps revealed that histogram width information (Interquartile range metric) provided a more sensitive measure of XRT response than first order metrics, reflecting the structural heterogeneity increase due to necrosis, which presaged tumor volume changes. Thus, radiomic analyses of qT2 maps show significant promise for early response prediction, which will be crucial for future development of dynamic adaptive radiotherapy.
Introduction
Response of cancer to radiation therapy (XRT) is governed by multiple factors including the physiological and structural properties of the tumour, intrinsic radiosensitivity of the cells, and the immune system of the host1. This leads to significant heterogeneity in the outcome of XRT between patients and calls for treatment optimization based on individual tumour characteristics. There remains an unmet need for adaptive XRT, based on the understanding of longitudinal effects of irradiation. Magnetic Resonance Imaging (MRI) has been successfully used clinically to detect and quantify changes in tumours following irradiation2,3 and this will become increasingly important with the advent of MR-Linac systems. Radiomics is an emerging image analysis method4 aiming to extract large number of features from radiological images to aid diagnosis, prognosis and increase informational content of the data. We investigated the sensitivity of T2 and diffusion mapping for early XRT response and hypothesized that radiomic texture analysis can provide insight into tumor sensitivity and predict response.Methods
Male black 6 mice were injected with Panc02 pancreatic adenocarcinoma cells subcutaneously in upper thigh, and used when tumour reached ~400mm3 volume. In first experiment n=7 mice underwent MRI (T2 map (MSME, TR=3427ms, 32xTE=7-224 ms, 7ms spacing), and DWI, EPI, (TR/TE=1600/42ms, 3 directions, b- values 100,450,700 s/mm2), both sequences 35 mm FOV,128x128 points, 1/0 mm slice thickness/gap, 2h before and 72h after 20Gy single dose X-ray irradiation (XRAD 320, Precision X-Ray) to tumor area, to compare sensitivities of ADC and T2 to XRT response. N=6 mice (n=7 sham) were irradiated with 5 daily fractions of 2Gy and received MRI (T2 mapping as above) on days 0,3,6,9 from first fraction. The irradiation caused a slowdown in tumor growth (Figure 1B).Results
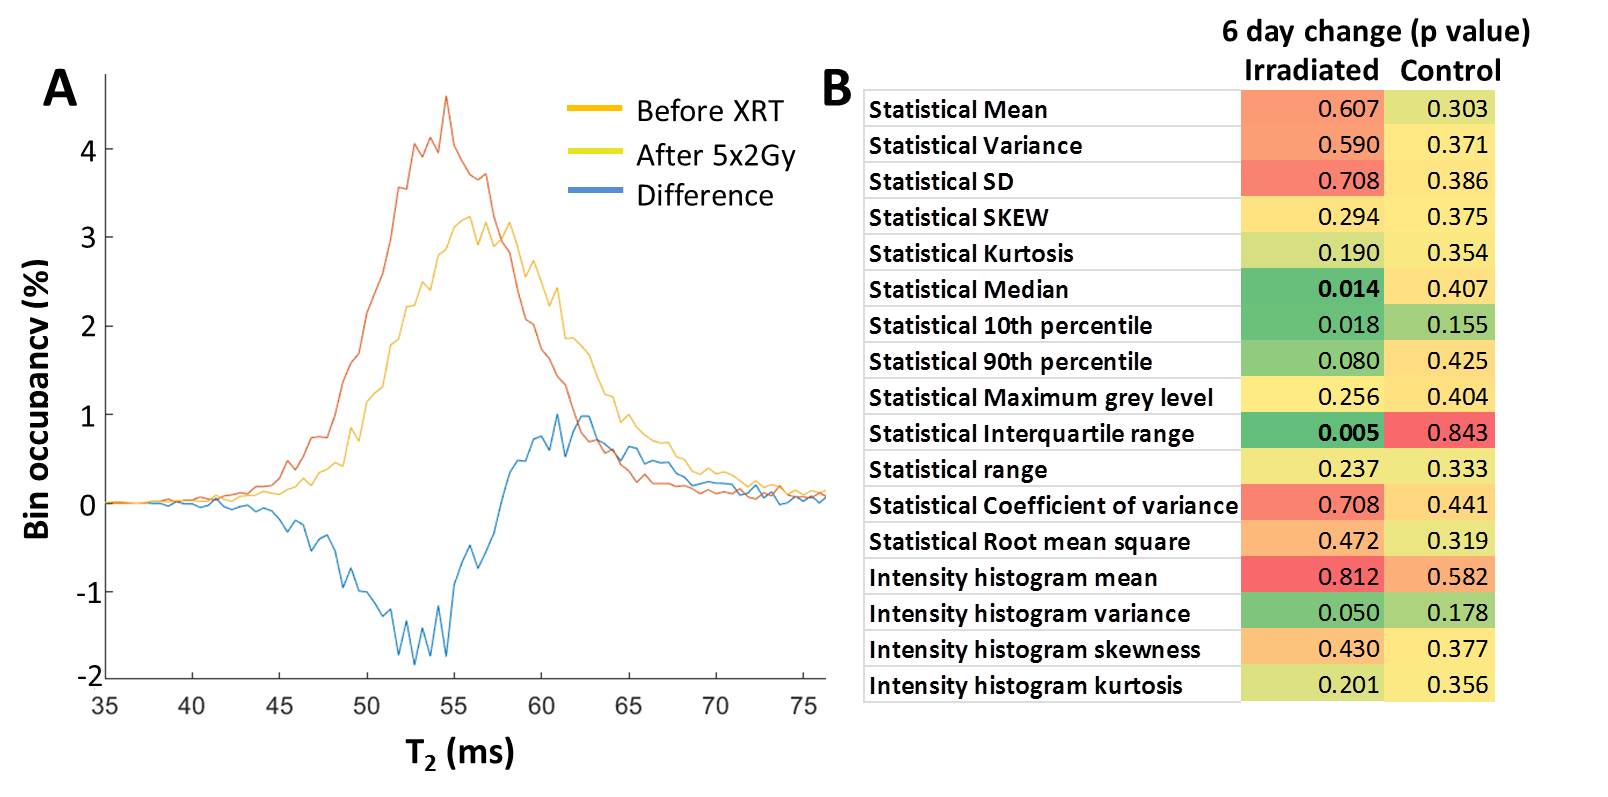
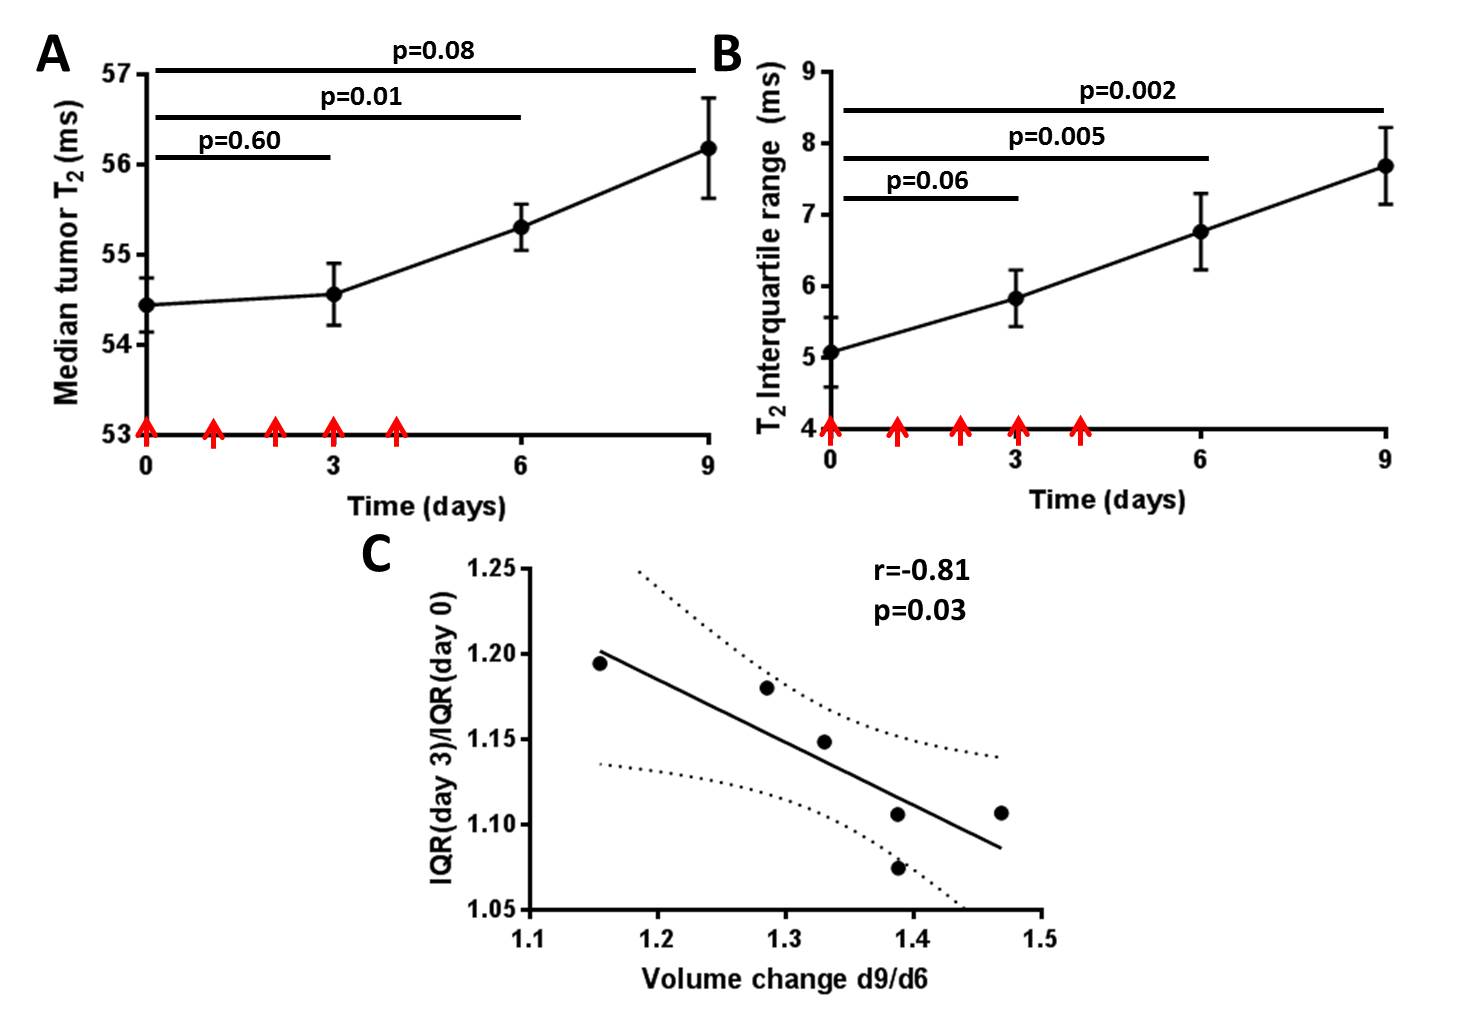
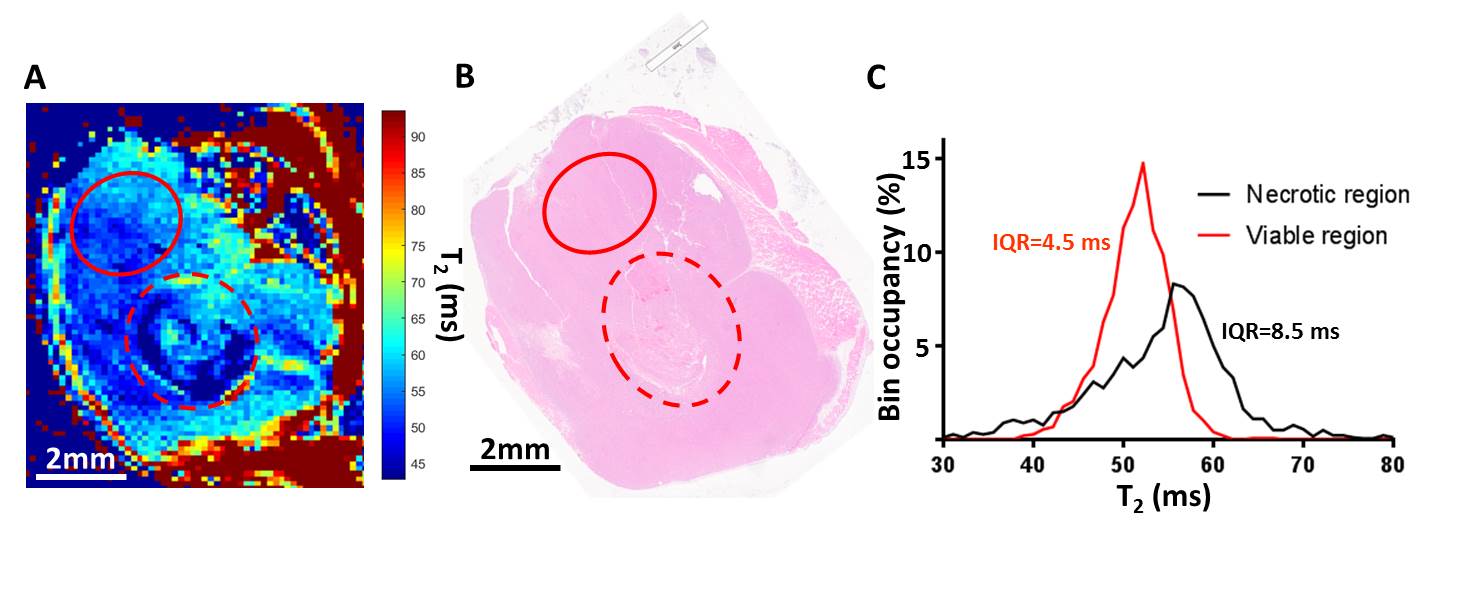
Comparison of median T2 and ADC changes 72h after 20Gy irradiation revealed significant response in both metrics, with a more significant change in T2, although with lower dynamic range (55.6±0.7 vs. 57.9±0.7, 4% average increase, p=0.0004 for T2; and 0.52±0.0.02 vs. 0.62±0.0.02 10-3 mm2/s, 20% average increase, p=0.02 for ADC). Comparison of tumor T2 value histograms before and after 5x2Gy fractionated XRT reveals complex changes in histogram shape and position (Fig 2A). Radiomic analysis of the texture features (Fig 2B) in the image confirms this, showing significant increase in T2 median after 6 days (54.4±0.3 vs. 55.3±0.3, p=0.01) and an even stronger increase in interquartile range, IQR (5.1±0.5 vs. 6.8±0.5, p=0.005). The two metrics display different temporal kinetics, with IQR responding to XRT sooner and for longer than median (Figure 3A,B), and even before the end of XRT schedule. The acute IQR change 3 days after first fraction was shown to inversely correlate significantly with tumor recurrence, defined as % volume increase between days 6 and 9 (Pearson r=0.-81,p=0.03, Figure 3C). Comparison with histology revealed that the IQR value was elevated in necrotic areas, reflecting the cellular heterogeneity of these regions (Figure 4), offering a biological interpretation of the metric.Discussion
The results presented above highlight the value of qT2 mapping in XRT response monitoring. With similar acquisition times (4.25min w/ respiratory gating vs. 7.25min without gating for 15 slices), T2 showed more robust response measure than ADC. Further, qT2 maps are more readily available on MR Linac (View-Ray®) systems than diffusion sequences. The novel approach to preclinical XRT response imaging using the quantitative texture analysis of the qT2 maps using radiomics revealed a wealth of information, which allows for identification of robust and sensitive metrics of XRT response. Interquartile range of tumor T2 clearly over-performed first order metrics for response sensitivity and dynamic range, likely thanks to the cytotoxicity-induced increase in cellular heterogeneity, as non-viable regions show a particularly broad T2 histogram.Conclusions
The approach, and related biomarker candidate presented above show significant promise for early XRT response evaluation and prediction. In further studies this method will be used to dynamically adapt radiotherapy fraction sizes based on the imaging feedback, with the aim to contribute to development of personalized radiotherapy paradigm using an MR-Linac.Acknowledgements
We would like to acknowledge the support of the Analytical Microscopy, Small Animal Imaging and Image Response Assessment Core Facilities at Moffitt Cancer.References
1. Barker HE, Paget JTE, Khan AA, Harrington KJ. The Tumour Microenvironment after Radiotherapy: Mechanisms of Resistance and Recurrence. Nat Rev Cancer 2015;15:409-25
2. Henning EC, Azuma C, Sotak CH, Helmer KG. Multispectral quantification of tissue types in a RIF-1 tumor model with histological validation. Part I. Magnetic Resonance in Medicine 2007;57:501-12
3. Salem A, Little RA, Latif A, Featherstone AK, Babur M, Peset I, et al. Oxygen-enhanced MRI Is Feasible, Repeatable, and Detects Radiotherapy-induced Change in Hypoxia in Xenograft Models and in Patients with Non-small Cell Lung Cancer. Clinical cancer research : an official journal of the American Association for Cancer Research 2019
4. Gillies RJ, Kinahan PE, Hricak H. Radiomics: Images Are More than Pictures, They Are Data. Radiology 2016;278:563-77
Figures