4842
A descriptive study to evaluate radiotherapy-related response for myxoid liposarcomas using functional MRI1The Royal Marsden NHS Foundation Trust and Institute of Cancer Research, London, United Kingdom, 2The Royal Marsden NHS Foundation Trust, London, United Kingdom, 3The Netherlands Cancer Institute, Amsterdam, Netherlands, 4The Leiden University Medical Center, Leiden, Netherlands
Synopsis
Summary: Myxoid liposarcomas (MLS) show enhanced radiotherapy response owing to their distinctive vasculature. We explore the role of functional MRI in identifying MLS response to radiotherapy.
Methods: Ten patients with histologically-proven MLS received radiotherapy. Diffusion, T2* and vascularity estimates were assessed at pre-, during and post-radiotherapy.
Results: Baseline values and post-radiotherapy changes of [Gd], IAUGC60 and Ktrans were statistically different between responders and non-responders but not ADC. Responders demonstrated statistically significant early tumour volume and post-radiotherapy T2* reductions.
Conclusion: Baseline vascularity estimates and their post-radiotherapy changes could predict MLS response. Early volume changes precede changes in MLS functionality.
Introduction
Studies suggest that myxoid liposarcomas (MLS) may show enhanced radiosensitivity following standard dose (25 x 2Gy) pre-operative radiotherapy due to radiation induced damage to their distinct vasculature1. Since vascular damage could be achieved at lower than the standard doses2-5 , it is hypothesised that MLS could be effectively treated with lower doses.Conventional MRI has accuracy limitations when assessing treatment-related response6,7 . Functional MR imaging techniques such as diffusion weighted imaging (DWI), dynamic contrast-enhanced MRI (DCE-MRI) and T2* imaging are increasingly used to detect changes in tumour perfusion, cell proliferation and hypoxia8-10 , however, reports on the preoperative therapeutic monitoring of soft tissue sarcomas (STS) using functional MRI are limited in the literature and refer to heterogeneous cohorts.
We describe early and late changes in tumour function in a cohort of MLS patients receiving reduced dose radiotherapy preoperatively, and explore the use of MRI functional parameters to identify response.
Methods
Ten patients with histologically confirmed MLS received reduced-dose radiotherapy (36Gy in 18 fractions, 2Gy/fraction) with Research Ethics Committee approval. 3T MRI performed at pre-, twice during and twice post-radiotherapy. Following histopathological assessments, patients were classified as responders (n=6) and non-responders (n=4).The MRI scanning protocol is shown in Table 1.DCE images were non-rigidly registered (MIRT - MATLAB, R2018b)11 and datasets were aligned and resampled to match DCE spatial resolution (MATLAB, R2018b). Flip angle accuracy in DCE-MRI was ensured employing scaling factors using fat as the reference signal.
The median and the median absolute deviation of tumours apparent diffusion coefficient (ADC), T2* relaxation time, gadolinium concentration [Gd], initial area under the gadolinium curve over 60s (IAUGC60) and volume transfer constant (Ktrans) were calculated over a central volume using in-house software (ADEPT, MRIW).
All metrics from visits 1 (pre-radiotherapy), 2 (radiotherapy fraction 8) and from the final post-radiotherapy visit were summarised and analysed to explore tumour functional changes and associations to response (two-sided Wilcoxon rank-sum test, Pearson’s product-moment correlation coefficient). p<0.05 indicates statistical significance.
Results
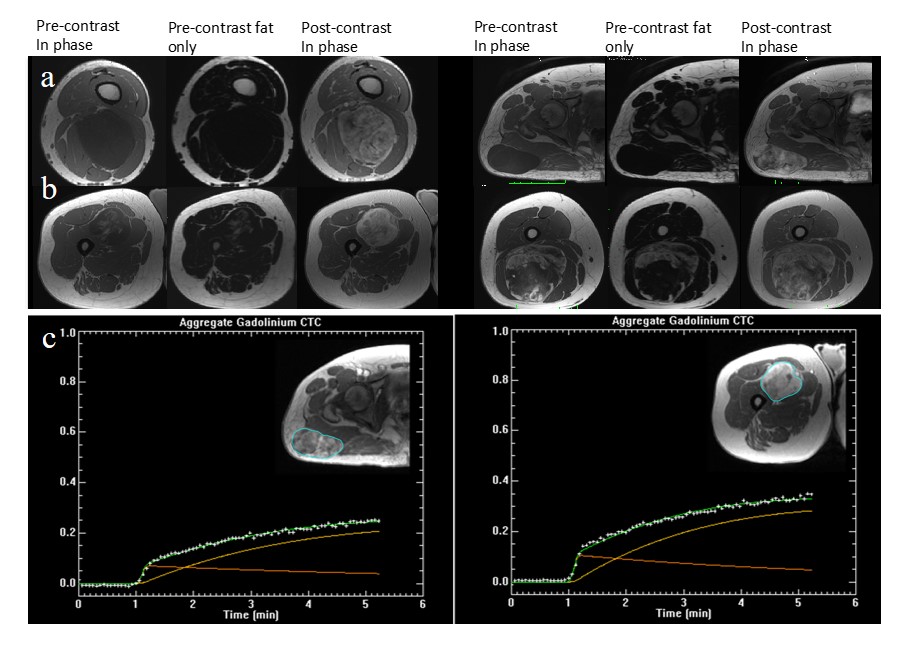
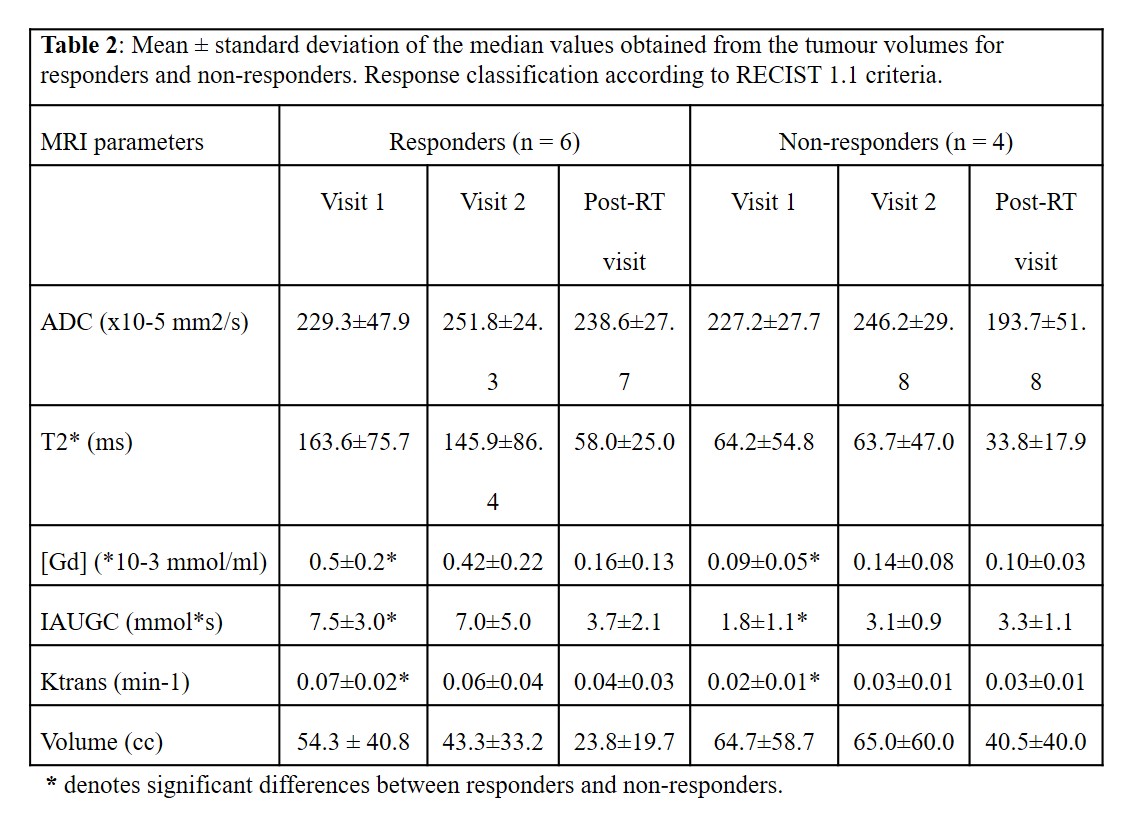
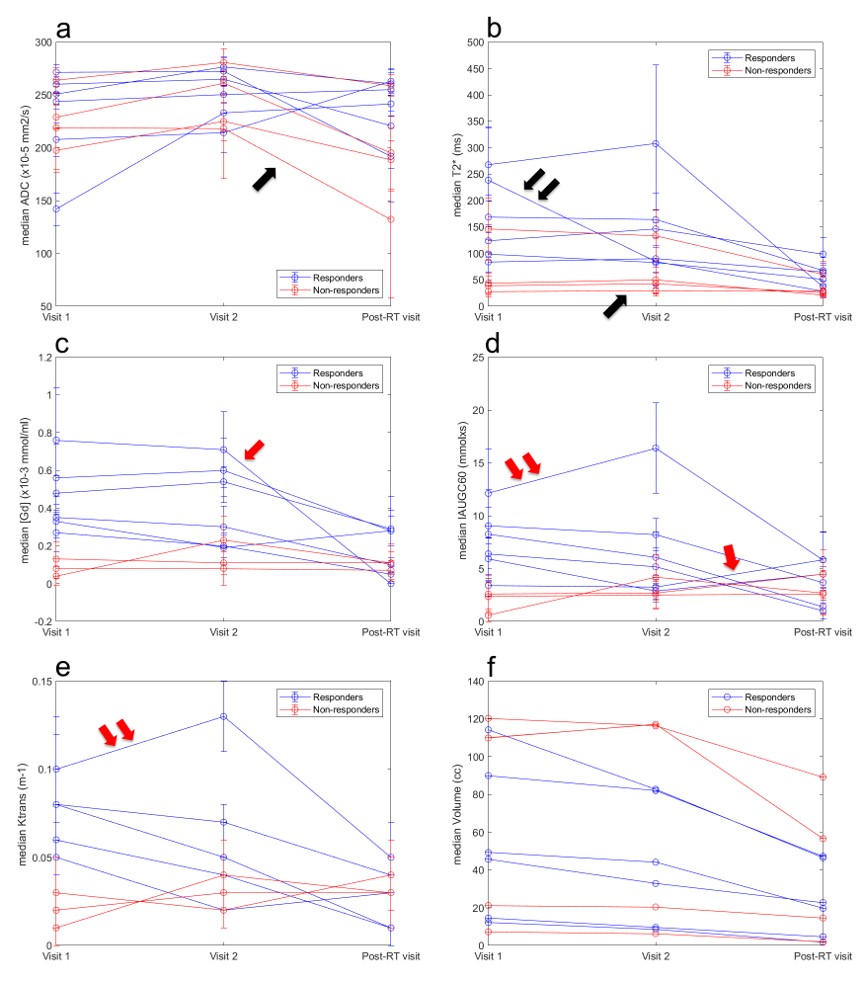
The majority of MLS exhibited low signal intensities on the non-enhanced T1-weighted images due to the myxoid component (Figure 1a). High signal intensity foci correspond to fat content (Figure 1b). MLS exhibited a gradual contrast uptake and heterogeneous enhancement (Figure 1c).Table 2 summarises all parameters showing large inter-subject variability. Statistically significant differences were found between responders and non-responders at baseline [Gd], IAUGC60 and Ktrans (p = 0.024, 0.024, 0.036). Higher but non-significant baseline T2* values were found for responders.
Significant post-radiotherapy T2*, [Gd], IAUGC60 and Ktrans reductions (p= 0.004, 0.015, 0.026, 0.030) were observed for responders and [Gd], IAUGC60 and Ktrans increases for non-responders (p= 0.048, 0.048, 0.036) (Table 3). No ADC differences were observed between the response groups. Greater early volume reductions were observed for responders (p= 0.038).
Considering tumours individually, a steep post-radiotherapy decrease in ADC (-39%) (Figure 2a, single black arrow) and a subtle T2* change (-3%) across visits (Figure 2b, single black arrow) corresponded to a mass with 40% viable tumour, 30% necrosis and high fat content. A mass with fibrosis, a small amount of residual viable tumour and no necrosis exhibited an early T2* steep decrease (Figure 2b, double black arrow). A steep reduction of post-radiotherapy [Gd] was observed for a mass with a reported prominent capillary vasculature, however, post-radiotherapy IAUGC60 increased (Figures 2c,d, single red arrow). [Gd] and IAUGC60 were not significantly correlated.
Ktrans reductions and increases were consistently observed among responders and non-responders respectively. One responder exhibited an initial increase in IAUGC60 and Ktrans but both steeply decreased following radiotherapy (Figures 2d, e, double red arrow). A significant positive correlation was demonstrated between Ktrans and IAUGC60 (r = 0.59, p = 0.0013).
Discussion and conclusion
We described the functional changes seen with MRI in a small but uniform cohort of MLS patients receiving reduced-dose radiotherapy preoperatively.ADC did not demonstrate a value in assessing response for this cohort. Significant ADC differences have been reported for necrotic and viable tumour suggesting that tissue integration may obscure treatment-related changes12.
Our observation of statistically significant T2* decreases post-radiotherapy for responders is in agreement with previous intrinsic susceptibility-weighted MRI studies and is potentially related to treatment induced fibrosis13 and sclerosis.
Our findings suggest that MLS with higher baseline perfusion and permeability have higher blood supply indicating better oxygenation, and therefore greater radio-sensitivity14 and response. Increased Ktrans in the non-responding tumours may relate to functions that support increased perfusion for future growth15. T2*, [Gd], IAUGC60 and Ktrans could detect MLS response to treatment by identifying post-radiotherapy changes.
Volume measurements early in the course of treatment suggest that radiotherapy-induced size reductions precede changes in tumour functionality for MLS.
In conclusion, functional MRI provides important information that may facilitate the prediction of treatment response in MLS. Further investigations involving tumour segmentations could reveal patterns to differentiate responders from non-responders.
Acknowledgements
We acknowledge NHS funding to the NIHR Biomedical Research Centre and the NIHR Royal Marsden Clinical Research Facility.
References
1. R de Vreeze , D de Jong , R Haas , F Stewart , F van Coevorden. Effectiveness of Radiotherapy in Myxoid Sarcomas Is Associated With a Dense Vascular Pattern. Int J Radiat Oncol Biol Phys 2008; 72: 1480-1487.
2. EC Moser, EM Noordijk, FE van Leeuwen, S le Cessie, JW Baars and J Thomas et al., Long-term risk of cardiovascular disease after treatment for aggressive non-Hodgkin lymphoma, Blood 2006; 107: 2912–2919
3. BP Venkatesulu, LS Mahadevan, ML Aliru, X Yang, MH Bodd, PK Singh, SW Yusuf, J Abe, S Krishnan. Radiation-Induced Endothelial Vascular Injury A Review of Possible Mechanisms. JACC Basic Transl Sci. 2018 Aug; 3(4): 563–572.
4. SW Yusuf, BP Venkatesulu , LS Mahadevan, S Krishnan. Radiation-Induced Cardiovascular Disease: A Clinical Perspective. Front Cardiovasc Med. 2017; 4: 66
5. M. Friedman, J.W. Egan. Irradiation of liposarcoma Acta Radiol, 54 (1960), pp. 225-239
6. LG Shapeero , D Vanel , KL Verstraete, JL Bloem. Fast magnetic resonance imaging with contrast for soft tissue sarcoma viability. Clin Orthop Relat Res. 2002 Apr; (397):212-27.
7. T Soldatos , S Ahlawat , E Montgomery , M Chalian , MA Jacobs , LM Fayad . Multiparametric Assessment of Treatment Response in High-Grade Soft-Tissue Sarcomas with Anatomic and Functional MR Imaging Sequences. Radiology. March 2016; 278(3): 831–840.
8. AR Padhani , KA Miles. Multiparametric imaging of tumor response to therapy. Radiology 2010;256:348–364.
9. MO Leach , B Morgan , PS Tofts et al. Experimental Cancer Medicine Centres Imaging Network Steering Committee. Imaging vascular function for early stage clinical trials using dynamic contrast-enhanced magnetic resonance imaging. Eur Radiol. 2012;22(7):1451–1464.
10. R Klaassen , OJ Gurney-Champion ,JWWilmink , MG Besselink , Engelbrecht , J Stroker , AJ Nederveen , HWM van Laarhoven . Repeatability and correlations of dynamic contrast enhanced and T2* MRI in patients with advanced pancreatic ductal adenocarcinoma. Magnetic Resonance Imaging 50 (2018) 1-9.
11. Andriy Myronenko. Medical image registration toolbox (mirt) for matlab. URL https://sites.google.com/site/myronenko/research/ mirt.
12. P Lang , Wendland MF, Saeed M, Gindele A, Rosenau W, Mathur A, Gooding CA, Genant HK. Osteogenic sarcoma: noninvasive in vivo assessment of tumor necrosis with diffusion-weighted MR imaging.Radiology. 1998 Jan;206(1):227-35.
13. SP Li, N.J. Taylor, A. Makris, et al.Primary human breast adenocarcinoma: imaging and histologic correlates of intrinsic susceptibility-weighted MR imaging before and during chemotherapy. Radiology, 257 (2010), pp. 643-652
14. H Cho et al.. Noninvasive multimodality imaging of tumor microenvironment: Registered dynamic magnetic resonance imaging and positron emission tomography studies of a preclinical tumor model of tumor hypoxia. Neoplasia 11, 247–259, 242p following 259 (2009)
15. DE Spratt et al. Early magnetic resonance imaging biomarkers to predict local control after high dose stereotactic body radiotherapy for patients with sarcoma spine metastases. The Spine Journal 16 (2016) 291–298
Figures