4841
Yttrium-90 Radioembolization for Hepatocellular Carcinoma: Outcome Prediction with MRI Derived Fat-Free Muscle Area1Radiology, University Hospital Bonn, Bonn, Germany, 2Department of Medical Biometry, Informatics, and Epidemiology, University Hospital Bonn, Bonn, Germany
Synopsis
Magnetic resonance imaging (MRI) allows for body composition assessment, including determination of fat-free muscle area (FFMA). This study aimed to evaluate the prognostic value of FFMA, opportunistically measured from pre-interventional liver MRI, to predict outcome in patients receiving radioembolization (RE) for treatment of hepatocellular carcinoma (HCC). Patients with high FFMA showed significantly increased overall survival following treatment. On multivariate analysis, FFMA was an independent predictor of survival and thereby may reveal additional prognostic information in these patients. FFMA may become a promising new biomarker, since it is easy to assess from routine clinical imaging and represents a potential therapeutic target.
Body of abstract
IntroductionHepatocellular carcinoma (HCC) is a leading cause of cancer-related deaths and its incidence is steadily increasing. In patients with proceeded disease, radioembolization (RE) is considered an effective treatment option and may help to improve patients’ survival. However, not all treated patients are likely to benefit from the therapy 1. Hence, to mitigate the risk of avoidable complications and improve outcome, additional reliable pre-interventional biomarkers of outcome are desired. Sarcopenia is a geriatric syndrome hallmarked by a progressive decline of skeletal muscle mass and function and has been reported to be associated with poor outcome in several oncologic diseases2. As the age-specific incidence of HCC peaks at approximately 70 years, sarcopenia is also prevalent among these patients3,4. However, its prognostic relevance in patients with advanced HCC has not been determined so far. Hence, this study aimed to investigate the value of fat-free muscle area (FFMA) determined from pre-interventional magnetic resonance imaging (MRI) as a marker of sarcopenia in patients undergoing RE for treatment of HCC.
Methods
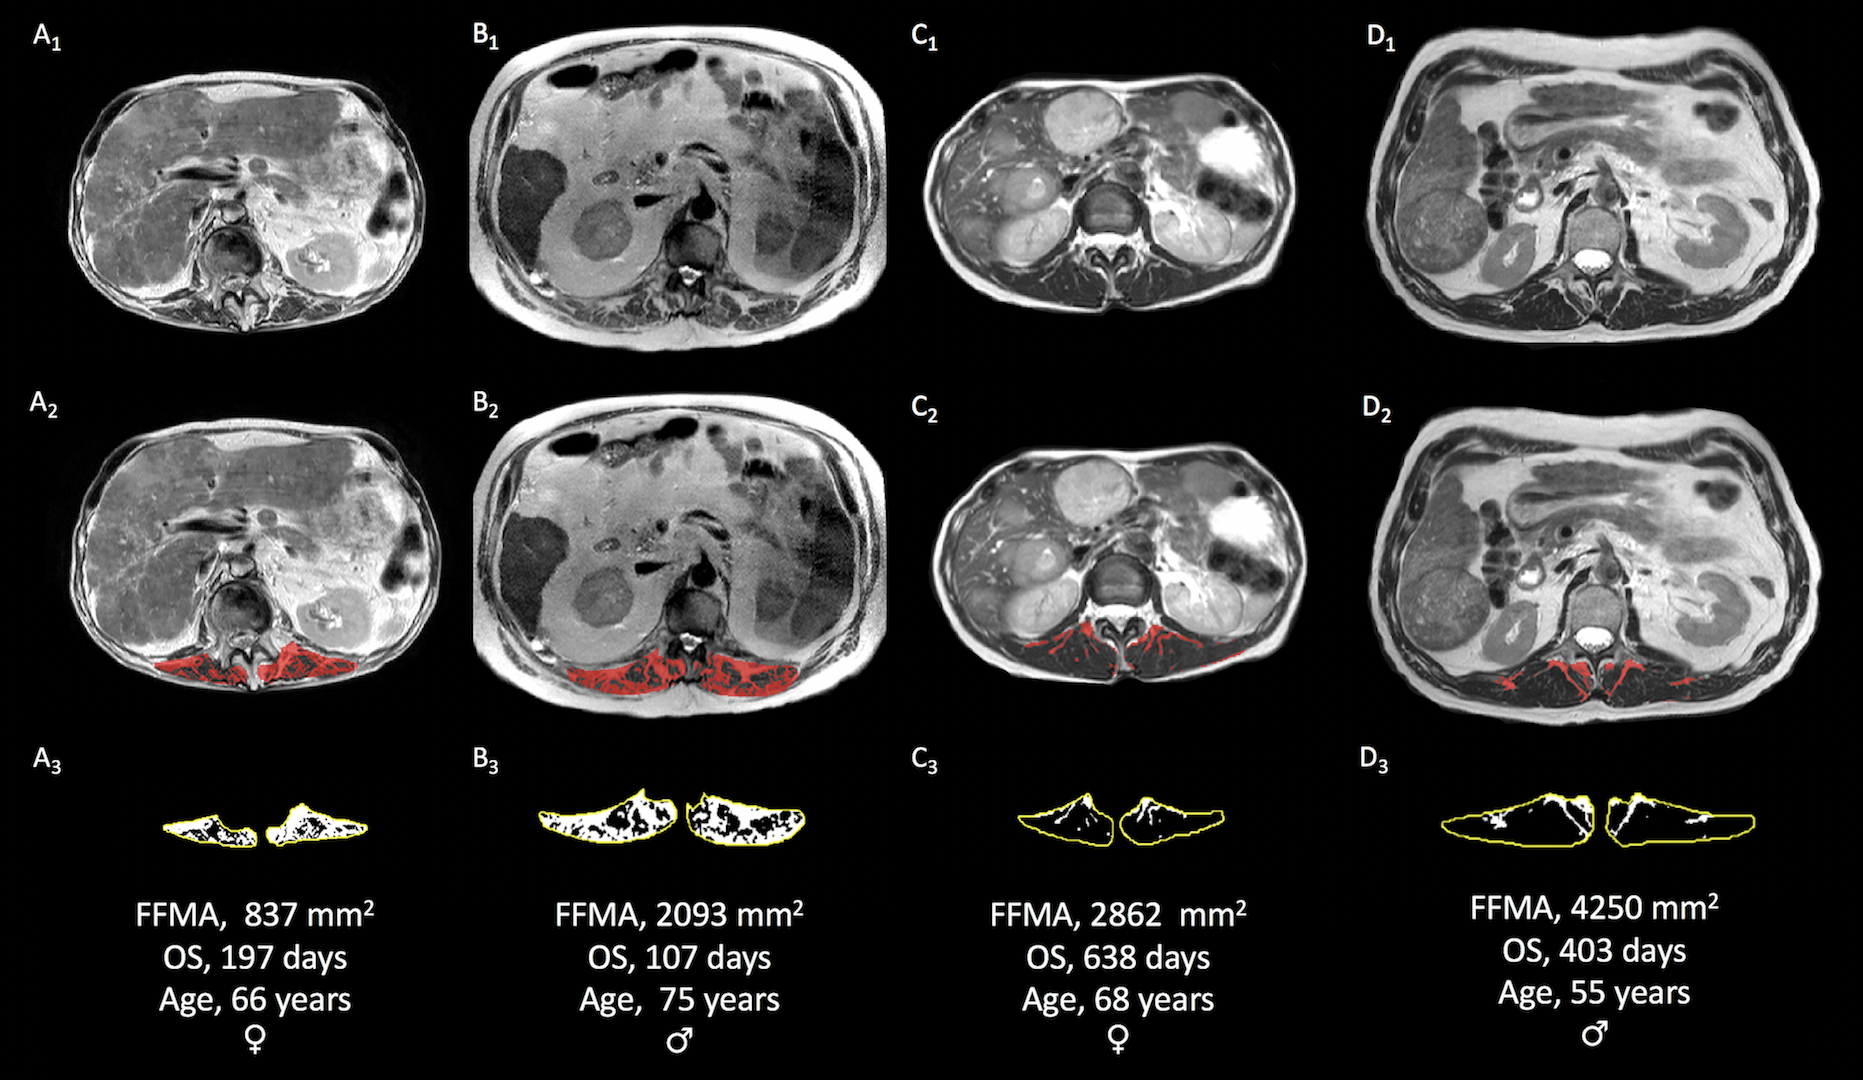
After approval by the institutional review board with waiver of written informed consent, patients who received RE for treatment of HCC between 12/2007 and 10/2014 were retrospectively evaluated. All patients underwent pre-interventional liver MRI on a clinical 1.5 Tesla (T) or 3.0 T whole body system. Axial T2-TSE sequences at the level of the superior mesenteric artery were used to determine FFMA using an in-house software. First, skeletal muscle area was obtained, carefully tracing the thoracolumbar fascia and thus separating the paravertebral skeletal muscle compartment from adjacent tissues. To separate lean muscle from intramuscular adipose tissue, the segmented images were binarized based on signal intensity. Summation of pixels with high signal intensity values with the corresponding surface area resulted in intramuscular adipose tissue area, which was subtracted from the skeletal muscle area to obtain FFMA. Time periods from RE to disease progression and death from any cause were defined as progression-free survival (PFS) and overall survival (OS), respectively. Disease progression was evaluated according to modified Response Evaluation Criteria in Solid Tumors (mRECIST). Consented cut-off values to define sarcopenia in MRI are missing to date. Hence, patients were dichotomized based on the median gender-specific FFMA into groups of high and low FFMA. Survival curves of patients with high and low FFMA were compared using Kaplan-Meier log-rank tests, and a Cox regression model including clinically relevant covariates was assembled to study the impact of FFMA on OS.
Results
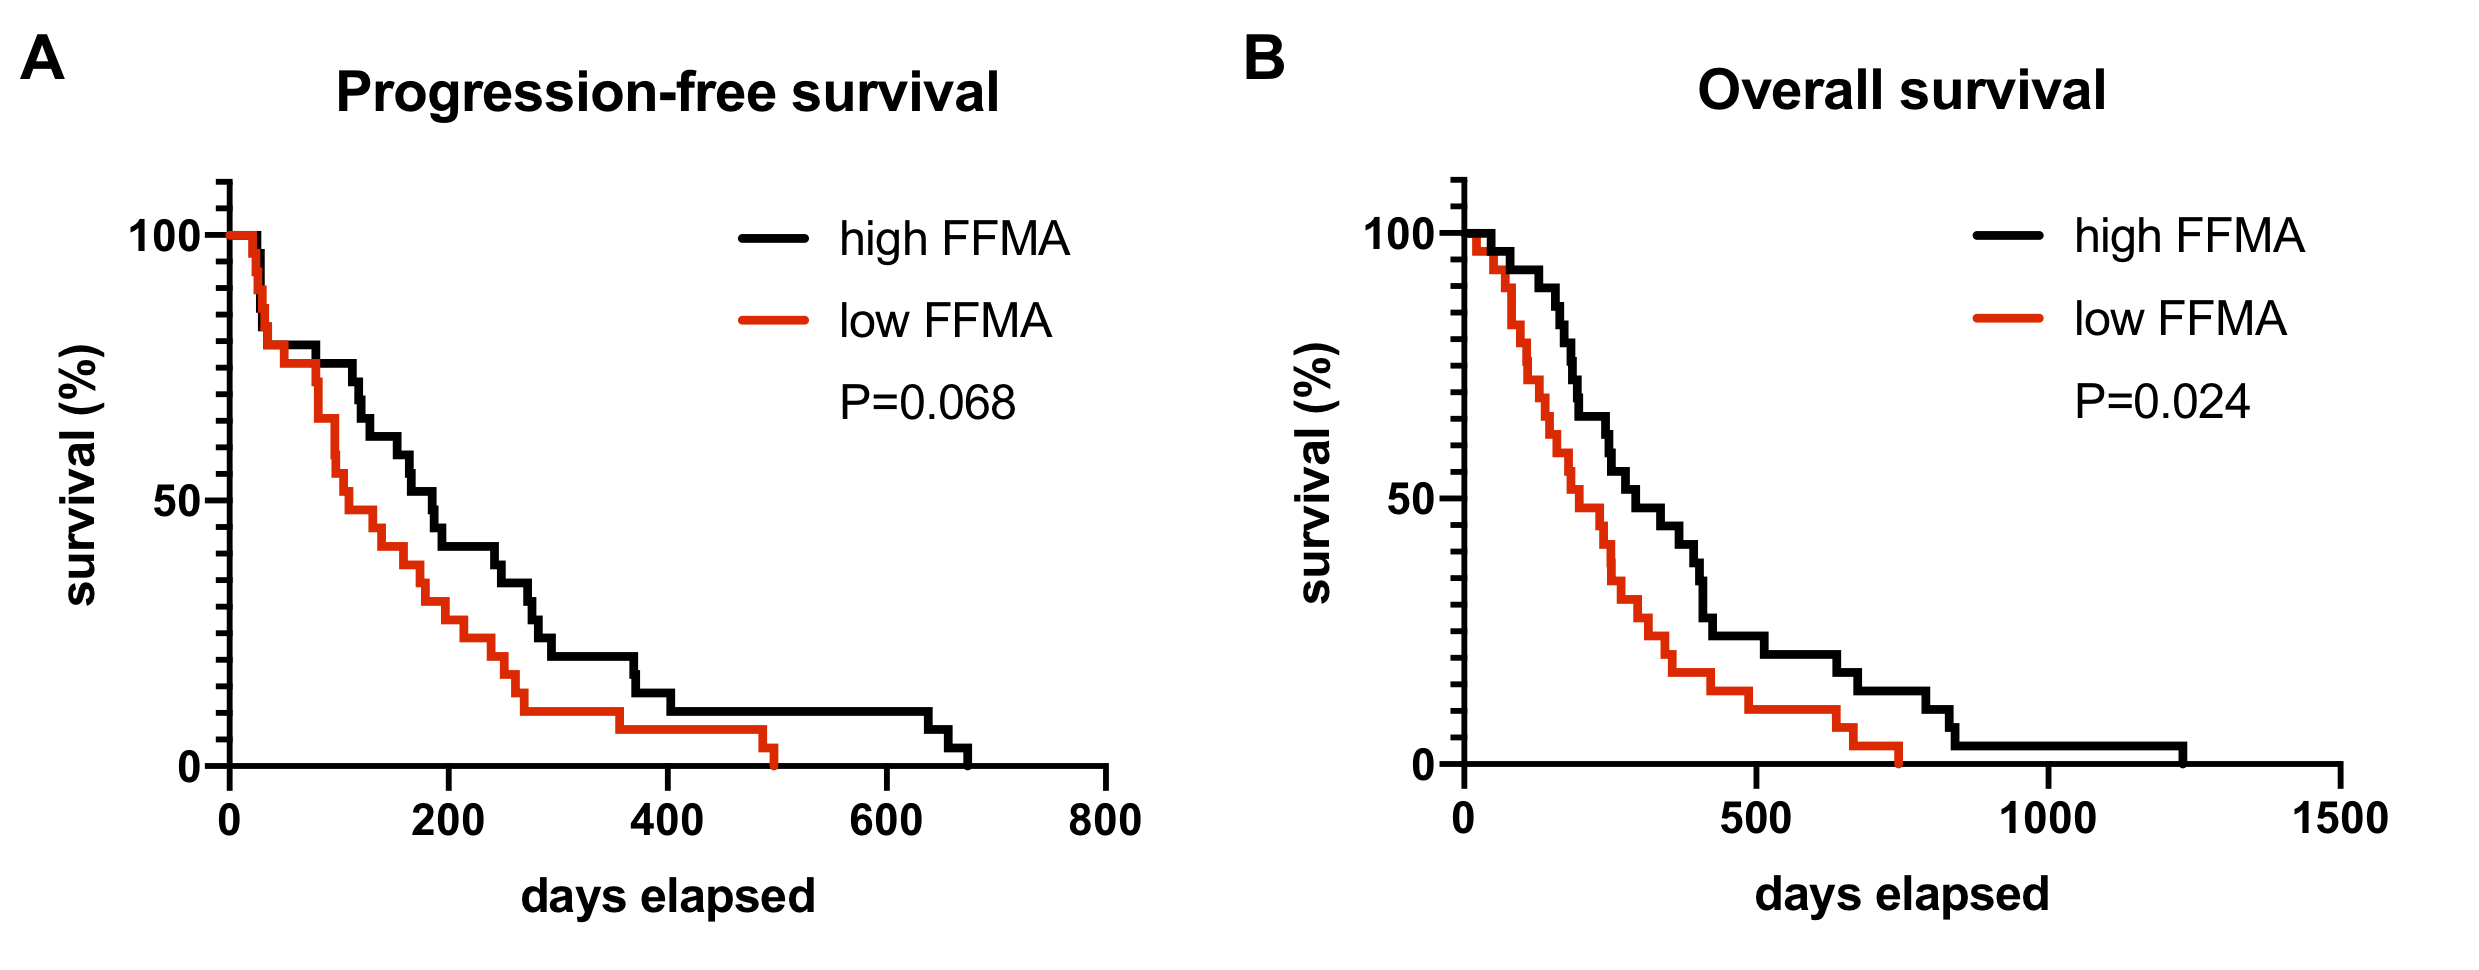
58 consecutive patients (13 female) with a mean age of 68±12 years were included and observed until death. Median PFS and OS were 156 days (range:21-674 days) and 250 days (range:21-230 days), respectively. Mean time between pre-interventional MRI and RE was 27±20 days. Mean FFMA was 3342±1164 mm2, and based on gender-specific median FFMA, cut-off values for definition of low FFMA were 3582 mm2 and 2301 mm2 for male and female patients, respectively (Figure 1). Patients with high FFMA had a significantly increased OS (median OS: 294 vs. 197, P=0.024) and tended to have longer PFS (median PFS: 185 vs. 109 days, P=0.068) compared to patients with low FFMA (Figure 2). On multivariate analysis, low FFMA (hazard ratio (HR), 2.675 [95% confidence interval (CI), 1.255-5.702); P=0.011), estimated liver tumor burden (HR, 4.058 [95% CI, 2.043-8.057]; P=0.001) and Eastern Cooperative Oncology Group (ECOG) performance status (HR, 1.763 [95% CI, 1.156-2.690]; P=0.009) were independent prognosticators of survival.
Discussion
As the key finding of the study, FFMA as a measure of sarcopenia seems to reveal prognostic information in patients receiving RE for treatment of HCC. Patients with high FFMA showed significantly increased OS following RE compared to patients with low FFMA, and according to multivariate risk factor analysis, FFMA seems to be an independent predictor of survival in these patients. Previous studies indicated that sarcopenia is common among patients with HCC and is related to both a higher mortality rate following liver resection as well as a higher tumor recurrence rate following surgery compared to non-sarcopenic patients5,6. In patients treated with sorafenib, sarcopenic patients showed significantly shortened OS compared to non-sarcopenic patients4. Our results corroborate these findings regarding the impact of skeletal muscle mass on survival in patients with HCC. Further, since RE is typically offered to patients with unresectable or chemorefractory disease, our results indicate that skeletal muscle mass seems to have an impact on survival also in patients with advanced stages of disease. From the clinical perspective, opportunistic determination of sarcopenia from pre-interventional imaging may be considered particularly interesting, since it is quick and easy to obtain, readily available from routine diagnostic imaging, and reveals a potential therapeutic target. Future studies could evaluate the predictive value of FFMA with regard to other oncologic diseases as well as whether an increase of skeletal muscle mass may help to improve outcome in these patients.
Conclusion
FFMA as an indicator of sarcopenia can be opportunistically determined from routine clinical MRI and seems to comprise significant prognostic information about survival duration in patients undergoing RE for treatment of HCC. Therefore, FFMA may have the potential to become a promising new imaging biomarker for pre-interventional risk stratification in these patients.
Acknowledgements
N/AReferences
1. Llovet JM, Ducreux M, Lencioni R, et al. EASL-EORTC Clinical Practice Guidelines: Management of hepatocellular carcinoma. J Hepatol. 2012;56:908–943.
2. Martin L, Birdsell L, MacDonald N, et al. Cancer cachexia in the age of obesity: Skeletal muscle depletion is a powerful prognostic factor, independent of body mass index. J Clin Oncol. 2013;31:1539–1547.
3. El Serag HB, Mason AC. Rising incidence of hepatocellular carcinoma in the United States. N Engl J Med. 1999;340:745–750.
4. Antonelli G, Gigante E, Iavarone M, et al. Sarcopenia is associated with reduced survival in patients with advanced hepatocellular carcinoma undergoing sorafenib treatment. United Eur Gastroenterol J. 2018;6:1039–1048.
5. Voron T, Tselikas L, Pietrasz D, et al. Sarcopenia impacts on short- and long-term results of hepatectomy for hepatocellular carcinoma. Ann Surg. 2015;261:1173-1183.
6. Chang KV, Chen JD, Wu WT, et al. Association between Loss of Skeletal Muscle Mass and Mortality and Tumor Recurrence in Hepatocellular Carcinoma: A Systematic Review and Meta-Analysis. Liver Cancer. 2017;7:90–103.
Figures