4837
The Investigation of Internal Target Volume(ITV)Definition For Radiation Therapy of Hepatocellular Carcinoma Guided Using 4D-MR-T2 Images1Department of Radiation Oncology, Shandong Cancer Hospital and Institute, Shandong First Medical University and Shandong Academy of Medical Sciences, Jinan, China, 2Philips Healthcare, Shanghai, China, 3Philips Healthcare, BIU ADI MR Therapy Clinical Science, Amsterdam, Netherlands
Synopsis
In this study, we did the research of the feasibility and advantage in defining the ITV for RT of HCC guided by 4D-MR-T2 images compared to 4D-CT images. It had been found that gross tumor target volume and internal tumor target volume boundaries could be displayed clearly on 4D-MR-T2 images. The position and deformation status of liver and tumors could be monitored easily on 4D-MR-T2 images. 4D-MR-T2 Images should be the first choice for simulation of HCC to define the ITV, and establish adaptive RT approach for HCC.
Introduction
HCC is one of the globally high-grade malignant tumors, and there are many treatment methods. RT has become an indispensable treatment approach for patients with advanced HCC. Secondly, patients with advanced HCC generally get treated with transcatheter arterial chemoembolization (TACE). The position and morphology of liver are affected significantly by respiratorion,which could induce positon and shape variation of HCC tumor ITV. Respiratory motion has become one of the major factors inducing RT failure. Respiratory tracking technology-based on 4D images provide a feasible tool for solving the effects of respiratory motion in RT of HCC. In the mixed density background, CT images are often difficult for defining the boundaries of HCC gross tumor volume (GTV). In present study, the feasibility and advantages of HCC tumor target volume definition based onh 4D-MR-T2 images was investigated comparing it to 4D-CT.1,2Methods
In this study, 15 HCC patients were selected who would accept radiation therapy after TACE treatment. The 4D-CT and 4D-MR-T2 simulation images were obtained in one day. The 4D-CT and 4D-MR-T2 images are divided into 10 single and 8 phases according to breathing cycle respectively. The liver, GTV and ITV were defined on 4D-CT and 4D-MR-T2 images. The position, shape, and volume of liver, GTV, ITV were compared.Results
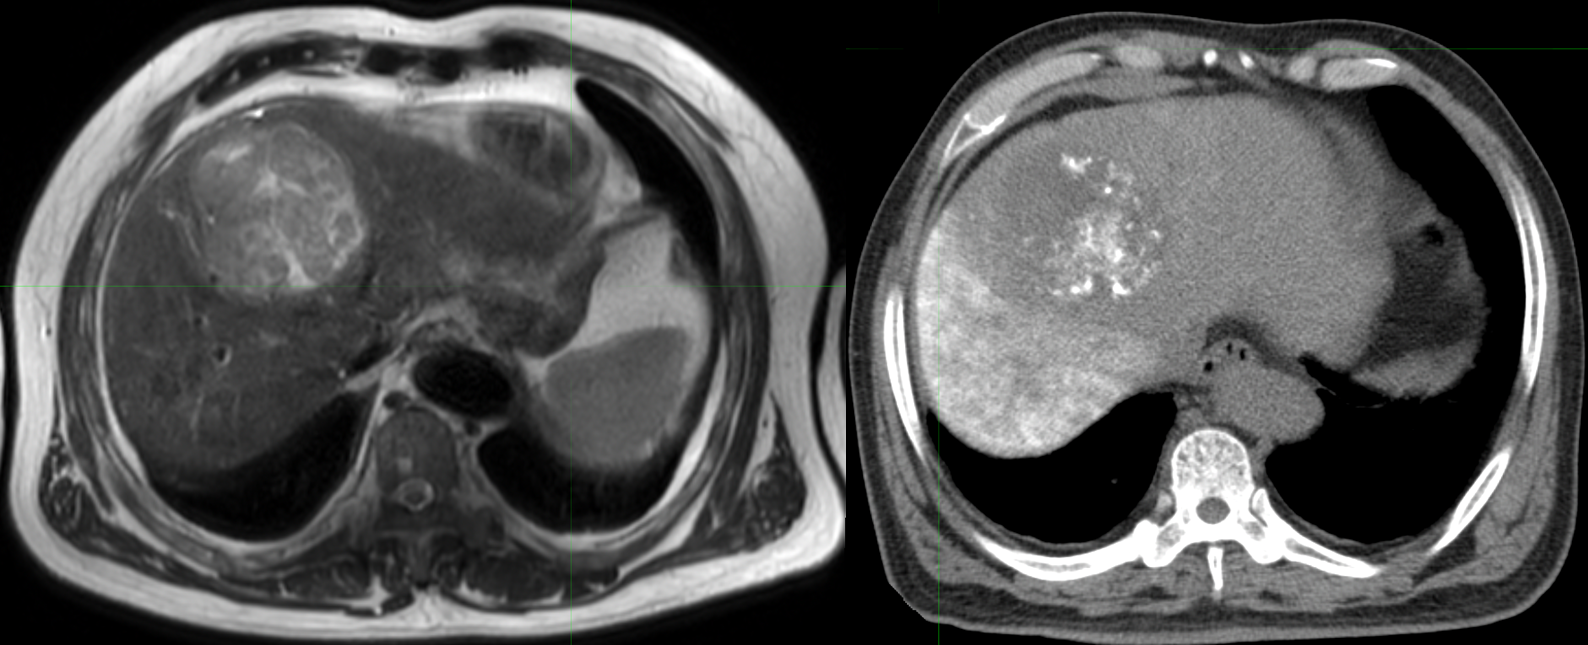
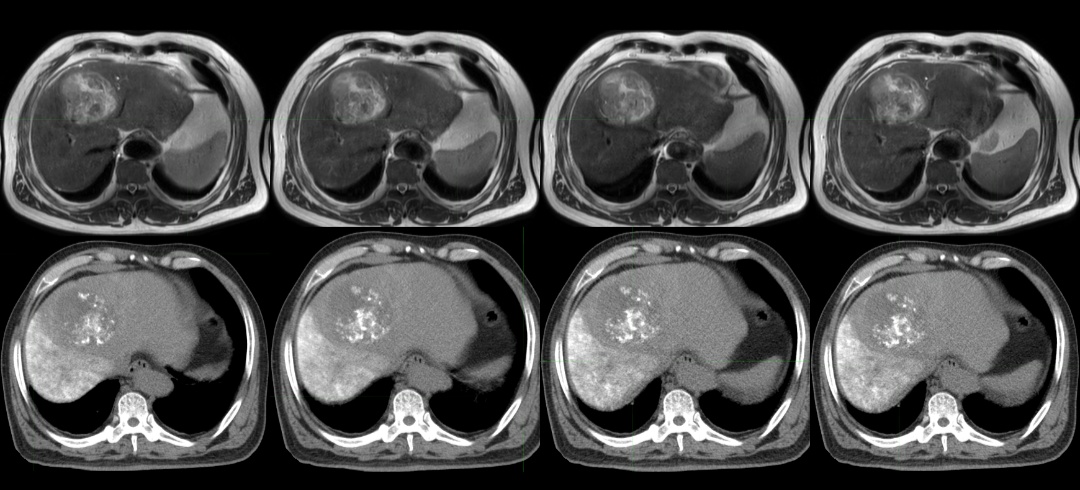
1. For patients with HCC who had recently undergone TACE, 4D-CT images held great difficulty in defining the boundary of GTV in 8 out of 15 patients. The tumor boundary display were clearer following the time increased after TACE. While, the 4D-MR-T2 images could show the boundaries of the tumor (100% patients) clearly.2. Compared to 4D-CT, the 4D-MR-T2 images can more clearly show the movement and deformation of the liver, blood vessel texture, GTV and ITV in HCC patients.
3. In the ITV delineation the repeatability of GTV delineation between different phases were less in 4D-CT compared to 4D-MR-T2 datasets. Maximum deviation among different phase could reach to 42% in 4D-CTbecause GTV boundaries display worse, and there was more uncertainty in ITV definition process. 4D-MR-T2 images held the advantage in the development of ITV benefit by clear boundary display.
Discussion and Conclusions
The dynamic 4D-MR-T2 image should be applied in ITV definition for HCC. It holds clear tumor boundaries, which is more significant for patients who need RT after TACE. Furthermore, it can directly show clearly the movement and deformation of the tumor, which will be useful for adaptive radiation therapy for HCC.Acknowledgements
This research was supported by the National Key Research and Development Program of China (No. 2017YFC0113202).References
1. Hu Y, Caruthers SD, Low DA, et al. Respiratory Amplitude Guided 4D Magnetic Resonance Imaging. Int J Radiat Oncol Biol Phys 2013, 86(1): 198-204.2.
2. Krueger S and Nielsen T. Efficient respiratory navigator-based 4D MRI. ISMRM 2016, #3594
Figures