4833
Magnetic resonance imaging in the evaluation of dose distribution of a radiotherapy plan for brain metastases1Department of Radiation Oncology, Shandong Cancer Hospital and Institute, Shandong First Medical University and Shandong Academy of Medical Sciences, Jinan, China, 2GE Healthcare, MR Research China, Beijing, China
Synopsis
In this study, a protocol of pseudo CT values obtained on MRI for treatment planning was proposed. The tissue or organ-specific CT values in representation of the electron density acquired from 35 patients with brain metastases were assigned to MRI. The dose distribution was recalculated, and the dosimetric differences between a new plan and an original plan were compared. The results showed that the dose distribution errors were basically controlled under 2.0% with pseudo CT values to bones, cavities and soft tissues, and lowered than 1.5% with pseudo CT values to different tissues and organs.
Introduction
Magnetic resonance imaging (MRI), as a non-invasive imaging technique for high soft tissue contrast, is able to discriminate craniocerebral tumor from other soft tissues.1,2In recent years, studies with assigned computed tomography (CT) value for MRI-based radiotherapy planning have reported that the comparison of dose calculation errors between the real and pseudo CT values was performed but no clear indication of where the larger dose calculation errors occurs.
Meanwhile, a few studies on brain metastases have compared the dosimetric differences between the target volume and organs at risk (OARs).3,4 Since not only the target tumor but also the whole brain is commonly irradiated, our study aims to establish pseudo CT values obtained on MRI as a reference for making brain metastasis radiotherapy. To evaluate the accuracy, the dose distribution errors (DDEs) were computed by subtracting two dose distribution values, of which one was acquired based on real or pseudo CT values and the other was obtained from the treatment.
Methods
All recruited thirty-five patients (mean age: 61±12 years old), receiving three dimensional conformal radiation therapy (3D-CRT) or intensity modulated radiation therapy (IMRT) for brain metastases, underwent CT and MR simulated localization on the same day before radiotherapy.For each patient, the MRI experiments were performed at a 3T MR system (Discovery 750w, GE Healthcare, USA) equipped with 6ch Neuro Flex coil. T2 propeller MR sequence was applied for brain imaging with the corresponding scan parameters of TR = 13312 ms, TE = 113.5 ms, matrix = 416 × 416, FOV = 260 × 260 mm, slice thickness = 3 mm. The scan time was 2 minutes 40 seconds.
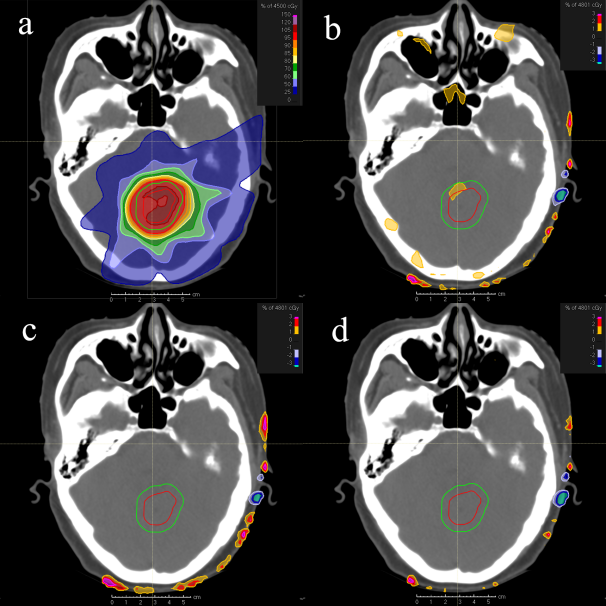
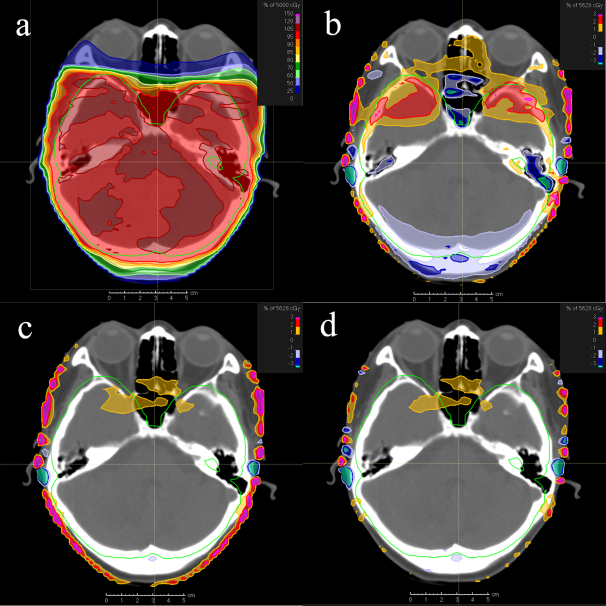
After rigid registration of both CT and MR images, the main tissues and organs were delineated on CT and MR images. The average CT value of each tissue or organ was calculated. Three pseudo CT values were obtained to be assigned to MRI-based radiotherapy planning: (1) the whole tissue was assigned 140HU; (2) cavity, bone and other tissues were assigned -700HU, 700HU and 20HU, respectively; (3) tissue- and organ-specific CT values were given. The dose distribution was recalculated based on aforementioned CT values to obtain Plan II, III and IV, accordingly. The resultant radiotherapy plans were considered the original plan (Plan I).
Statistics analysis on the dosimetric difference estimation between Plan I and the other plan (Plan II, III and IV) was performed with paired sample t test in SPSS 22.0. Significance threshold was set as p <0.05.
Results
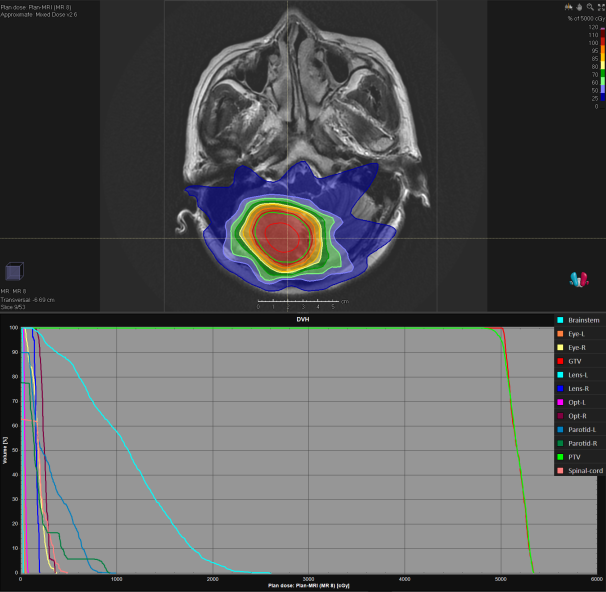
The average pseudo CT values of bone and cavity were 735.3 ± 68.0 HU and -723.9 ± 27.0 HU, respectively. The range of average soft-tissue CT values was from -70 to 70 HU. The dose distribution between Plan I and Plan II, III or IV showed some differences, and the differences decreased in turn. The differences of maximum dose of the lens were more than 5.0%, 1.5 - 2.0% and 1.0 - 1.5%, respectively, while the differences of other dose parameters (maximum dose, mean dose and D98 to the PTV, D5 of the brainstem, and maximum dose of the brainstem, corpus callosum, left eye, right eye) were basically less than 2.0%, 1.2% and 0.8%, respectively. In the pixel-by-pixel dosimetric comparison, the areas of more than 1% dose difference between Plan I and III as well as IV were mainly distributed near skin while those between Plan I and II were mainly distributed at the bone, cavity, bone and soft tissues junction, and the skin near the field. In addition, the dose calculation errors between Plan I and II were significantly larger than those between Plan I and as well as IV. These dose errors in 3D-CRT plan were slightly larger than in IMRT plan.Discussion
The dose distribution errors of pseudo CT values assigned radiotherapy plans (Plan II, III, IV) showed lower levels than those of the conventional plan (Plan I). It indicates that a better radiotherapy map can be obtained by sketching the target volumes and various tissues on MR images and giving them proper pseudo CT values. In addition, the dose distribution differences in patients with IMRT were smaller than those with 3D-CRT. Therefore, the results obtained in this study can be used to evaluate the dosimetric accuracy of different assigned CT values for MRI radiotherapy planning.Conclusion
In conclusion, a protocol for specific CT values assigned to MRI-based radiotherapy was established. This protocol would provide patients with dose-free radiotherapy planning which controls the dosage errors below 2.0 % calculated by the differences between the old plan and the new plans. If proper CT values were assigned to groups with different tissues and organs, it can be further controlled within 0.8% to meet the clinical requirements.Acknowledgements
This research was supported by the National Key Research and Development Program of China (2017YFC0113202) and the Key Research Program of Shandong (No. 2018GSF118006).References
1.Wang H, Nie P, Dong C, et al. CT and MRI findings of soft tissue adult fibrosarcoma in extremities. Biomed Res Int 2018:6075705.
2.Zhang J, Li Y, Zhao Y, Qiao J. CT and MRI of superficial solid tumors. Quant Imaging Med Surg 2018, 8(2):232-251.
3.Karotki A, Mah K, Meijer G, et al. Comparison of bulk electron density and voxel-based electron density treatment planning. J Appl Clin Med Phys 2011, 12(4):3522.
4.Tony Y, David T, Lois H. Assessment of electron density effects on dose calculation and optimisation accuracy for nasopharynx, for MRI only treatment planning. Australas Phys Eng S 2018, 41(4):811-820.
Figures