4832
COMPARISON OF 4D-CT AND 4D- MRI FOR LUNG TUMOUR MOTION MEASUREMENT: A PHANTOM STUDY.1Sydney university, Rankin Park, Australia, 2Radiation Oncology, Calvary Mater Newcastle, Newcastle, Australia, 3Radiation Oncology, Calvary Mater Hopsital Newcastle, Newcastle, Australia
Synopsis
Using a golden angle radial sampling technique (Siemens WIP#1104), the motion range detection capabilities of 4D-MRI were compared to 4D-CT simulating lung tumour motion using a MODUS QA 4D MRI phantom. Thirteen patient respiratory patterns were used to simulate realistic breathing motion. Repeated measures ANOVA (F=0.052, p=0.948), a post-hoc paired t-test (all p>0.677) and the RMSE (RMSE12 = 1.9 mm) were used to evaluate differences between the detected motion ranges. Results showed no statistically significant difference between the motion range detection capabilities of 4D-CT and 4D-MRI in the phantom. This observation provides evidence for further evaluation in a patient population.
Introduction
The introduction of 4D-CT allowed the successful clinical implementation of lung SABR through the definition and measurement of each patient’s lung tumour motion prior to treatment (1). However, this method suffers from low tissue contrast, making visualisation of some tumours difficult, and according to Steiner et al. (2) may underpredict the true extent of lung tumour motion by a factor of 1.7 times in the superior-inferior (SI) direction. The aim of this study is to compare the performance of existing 4D-CT techniques for phantom motion range definition and visibility with a novel 4D-MRI approach, prior to implementation in a patient cohort.Methods
The QUASAR MR-4D phantom is an MRI compatible phantom which allows programmable respiratory patterns (Varian Medical Systems, Palo Alto). Two 3 cm diameter spheres act as a tumour surrogate, one of which has SI translational motion. The Calvary Mater Newcastle’s (CMN) 3T MRI scanner (Siemens Skyra Magnetom) and CT scanner (Siemens Somatom Confidence) were used to scan the phantom. 4D-CT with Varians RPM system, and Siemens WIP-#1104 radial stack of stars MRI sequence with motion control averaging (MoCo Av) reconstruction was used to scan the phantom. The phantom was programmed with a sinusoidal pattern and 13 patient respiratory patterns from (3) to assess the motion range detection of 4D-CT and 4D-MRI. The 95% quantiles of the input respiratory signal were used to assess the efficacy of the measured target motion range. The respiratory pattern baseline drift (max to min of rolling 20 s average) and amplitude variability (median peak-peak and interquartile range of 68.2%) were quantified to determine their impact on total range detection. The MRI navigator and RPM system signals were compared to the input waveforms using time series cross convolution to ensure the viability of the respiratory signal used for phase binning and data reconstruction. Repeated measures ANOVA was used to determine if there was a statistically significant difference between the motion range population means detected by the 4D-CT, 4D-MRI and the input respiratory signal. The Root Mean Square Error (RMSE) was used as an additional confirmation of the proximity of the 4D-CT and 4D-MRI. As Patient 12 was an outlier in the data, both RMSE for all 13 patients (RMSE13) and excluding Patient 12 (RMSE12) was included.Results
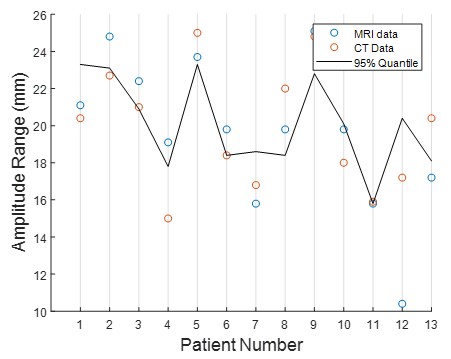
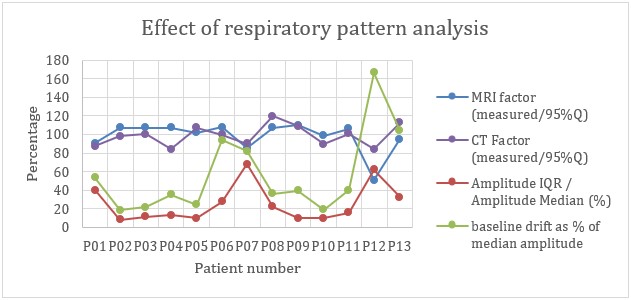
Results for motion range detection are shown for the 13 patient respiratory patterns in Figure 1. The repeated measures ANOVA result gave an F-statistic of F=0.052, with a p=0.948. The RMSE12 = 1.9 mm and the RMSE13 = 2.6 mm. With the post-hoc paired t-test results, all p-values > 0.65. In Figure 3, the ‘MRI factor’ is the measured MRI motion range divided by the 95% quantiles of the input respiratory motion in the phantom. Similar for the ‘CT factor’. Amplitude variability is defined as the interquartile range divided by the median amplitude, and baseline drift is measured as a proportion of median respiratory amplitude.Discussion
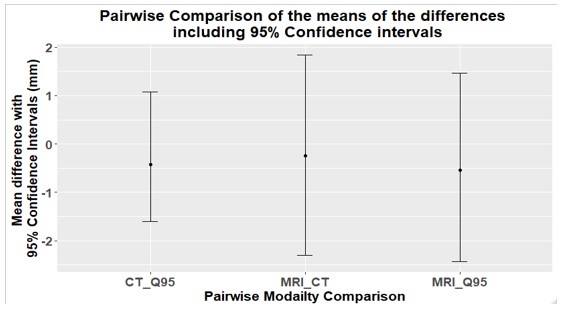
For the repeated measures ANOVA test, the low F statistic and high p-value suggest that there is insufficient evidence to reject the null hypothesis (p>0.05) with no statistically significant difference between the means of the paired motion ranges of 4D-CT and 4D-MRI. The post-hoc paired t-test has shown that using the 4D-CT measured motion range is a reasonable predictor for the 4D-MRI motion range adding further evidence to the proximity of the measured motion ranges from the two modalities when using the 4D-MRI phantom. The high p-vale for the post-hoc paired t-test means failure to reject the null hypothesis and the mean difference between paired observations is zero. To visualise this, the corresponding mean of the differences between paired modalities is shown in Figure 2 where the average difference is close to zero, also suggesting no difference between the detected motion ranges between 4D-CT and 4D-MRI. Patient 12 has a high amplitude variability and high baseline drift with a mostly low respiratory amplitude representative of someone in respiratory distress. This is shown through poor acquisition of the total motion range from patient 12 (Figure 3) where the self-navigation technique has difficulty acquiring the low amplitude respiratory signal. The Field of View (FOV) was altered to acquire a high Spearman’s rank correlation (0.976) between the input respiratory signal and the self-navigation signal however the final phase was a smearing of high amplitude respiratory data. This is made more difficult by the small amount of phantom that is moving into and out of the FOV, which the self-navigator relies on. This is expected to improve as this study moves to a patient cohort.Conclusions
Whilst the motion range detection between 4D-MRI and 4D-CT are similar in this phantom study, further validation of the 4D-MRI technique for lung cancer patients is currently being investigated. Preliminary patient results have demonstrated superior soft tissue contrast and usability in shallow or erratic breathing patients, when compared with the 4D-CT approach, providing further evidence for the inclusion of 4D-MRI in the clinical workflow for lung cancer treatment.Acknowledgements
No acknowledgement found.References
1.Acquiring a four dimensional computed tomography dataset using an external respiratory signal. (S. Vedam et al.) Phys Med Biol; 48: 45–62 (2003).
2. Both 4D-CT and 4D-CBCT under-predict lung target motion during radiotherapy (E. Steiner et al.) Rad. and Onc., 135, 65-73 (2019)
3. Lee, D., Greer, P. B., Ludbrook, J., Arm, J., Hunter, P., Pollock, S., . . . Keall, P. (2016). Audiovisual Biofeedback Improves Cine–Magnetic Resonance Imaging Measured Lung Tumor Motion Consistency. International Journal of Radiation Oncology, Biology, Physics, 94(3), 628-636. doi:10.1016/j.ijrobp.2015.11.017
4. Grimm R. (2015). Reconstruction Techniques for Dynamic Radial MRI. der Friedrich-Alexander-Universität
Figures