4828
Accelerated T2* Mapping in prostate cancer on an MR-Linac1Joint Department of Physics, The Institute of Cancer Research and The Royal Marsden NHS Foundation Trust, London, United Kingdom, 2Computer Science Department, University of Bath, Bath, United Kingdom
Synopsis
T2* mapping can be used to characterize tumour hypoxia, which is associated with therapy resistance. We show the feasibility of fast T2* mapping in prostate cancer patients on a 1.5T MR-Linac. The undersampled data was reconstructed by combining parallel imaging and a sparsifying transform with an iterative model-based reconstruction. The method was tested on a multi-compartment phantom and two prostate cancer patients with retrospective undersampling. With the proposed method T2* maps can be acquired in under five minutes. We demonstrated the feasibility of daily quantitative MRI over the course of radiotherapy on an MR-Linac, to characterize treatment response.
Background
With the availability of MR-Linacs, which combine an MRI scanner with a linear accelerator, daily MR imaging of cancer patients over the course of radiotherapy becomes feasible. This is of interest for treatment response monitoring and biomarker discovery on the basis of quantitative MRI (qMRI). One such quantitative MR parameter, the transverse relaxation rate T2*, is sensitive to the concentration of paramagnetic deoxyhemoglobin within the vascular compartment of tissues1. Of particular interest in radiotherapy is the identification of hypoxic volumes, which are associated with therapy resistance and show variation over the course of treatment2. However, qMRI is associated with long scan time and hence have limited clinical application. We investigate the acceleration of T2* mapping for integration into the daily MR-guided radiotherapy workflow.Theory
A model-based reconstruction is applied to the multi-echo raw data combining parallel imaging with a sparsifying transform (Total Variation)3 as previously proposed4 to minimize the following cost function:$$ \operatorname*{arg\,min}_{T2^*,M_0,x_n}{\sum_{n}^{N}\sum_{c}^{C} \|FS_{c}{{x_n}}- y_{n,c}}\|^2 + \lambda_1 \| x_n - M_0.exp(-\ t_{n}./T2^*) \| ^2 + \lambda_2\|x_n\|^2_{TV} $$ Here $$$x_n$$$ is the series of images ( n = 1, …, N, and N the number of echoes), is the nonuniform fast Fourier transform (NUFFT)5 operator defined for the radial sampling pattern and $$$S_c$$$ represents the coil sensitivity maps (with c = 1,…,C, and C the number of coils). The first term ensures data-consistency of the image $$$x_n$$$ with the acquired data, the second term ensures model-consistency and an additional term that enforces spatial regularization. The optimization algorithm alternates between using the Fast Iterative Shrinkage-Thresholding Algorithm (FISTA)6 to minimize the first and third term and solving the nonlinear least-squares problem with respect to T2* and M0. This can then be solved using Matlab’s nonlinear least squares (NLS) fitting package on each pixel sequence in turn. To balance these terms, regularization parameters $$$\lambda_1$$$ and $$$\lambda_2$$$ are introduced. For a detailed description, see4.
Materials and Methods
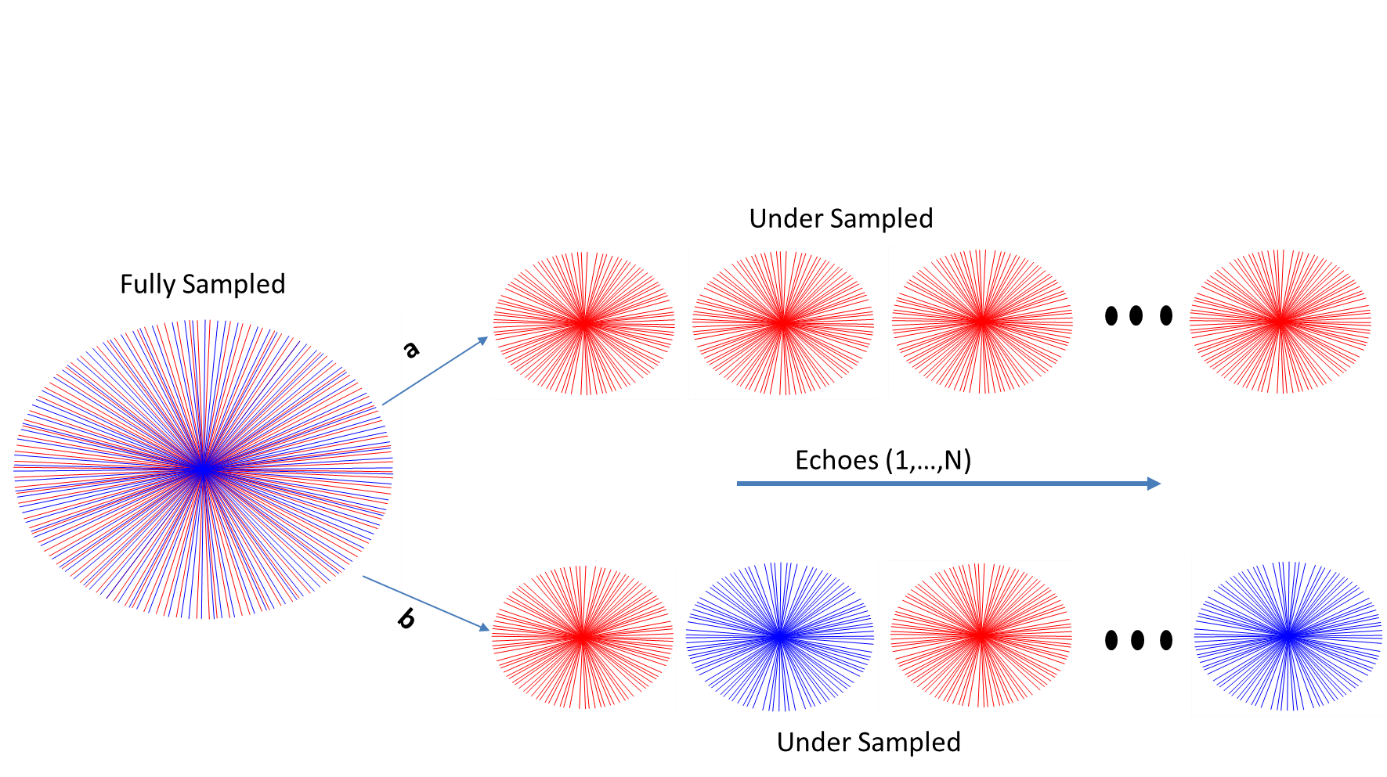
T2* mapping was performed in the Eurospin TO5 phantom (Diagnostic Sonar, Livingston, Scotland). Informed consent was obtained from two prostate patients and T2* mapping was integrated into the treatment workflow during plan adaptation to the daily MR images and before treatment delivery. Both experiments were performed on a 1.5 T MR-Linac (Elekta AB. Stockholm, Sweden) using a volumetric radial multi gradient echo sequence with the following parameters (8 echoes, 269 spokes, TR = 48 ms, DTE=5ms, FOV = 400x400x180 FOV mm and 1.5x1.5x4 mm3 acquisition voxel size). The acquisition time for the fully sampled scan was 7:56 min. The reconstruction algorithm was implemented in Matlab (MATLAB2018a, The Mathworks Inc., Natick, USA). Coil sensitivity maps were calibrated using the adaptive array method described in 7. For retrospective undersampled data, 150 spokes were used from the fully sampled data with two different schemes. For the first undersampling scheme, spokes were removed from the start of the acquisition to reduce steady-state effects. For the second undersampling scheme, the spokes were removed from different angles in the alternate echoes as illustrated in Figure 1. A gridding reconstruction was used as an initial guess. The values of λ1 and λ2 were chosen to be 0.5 and 0.25 respectively based on the previous work4. T2* values from different compartments of the phantom were compared to the T2* values from fully sampled data.Results
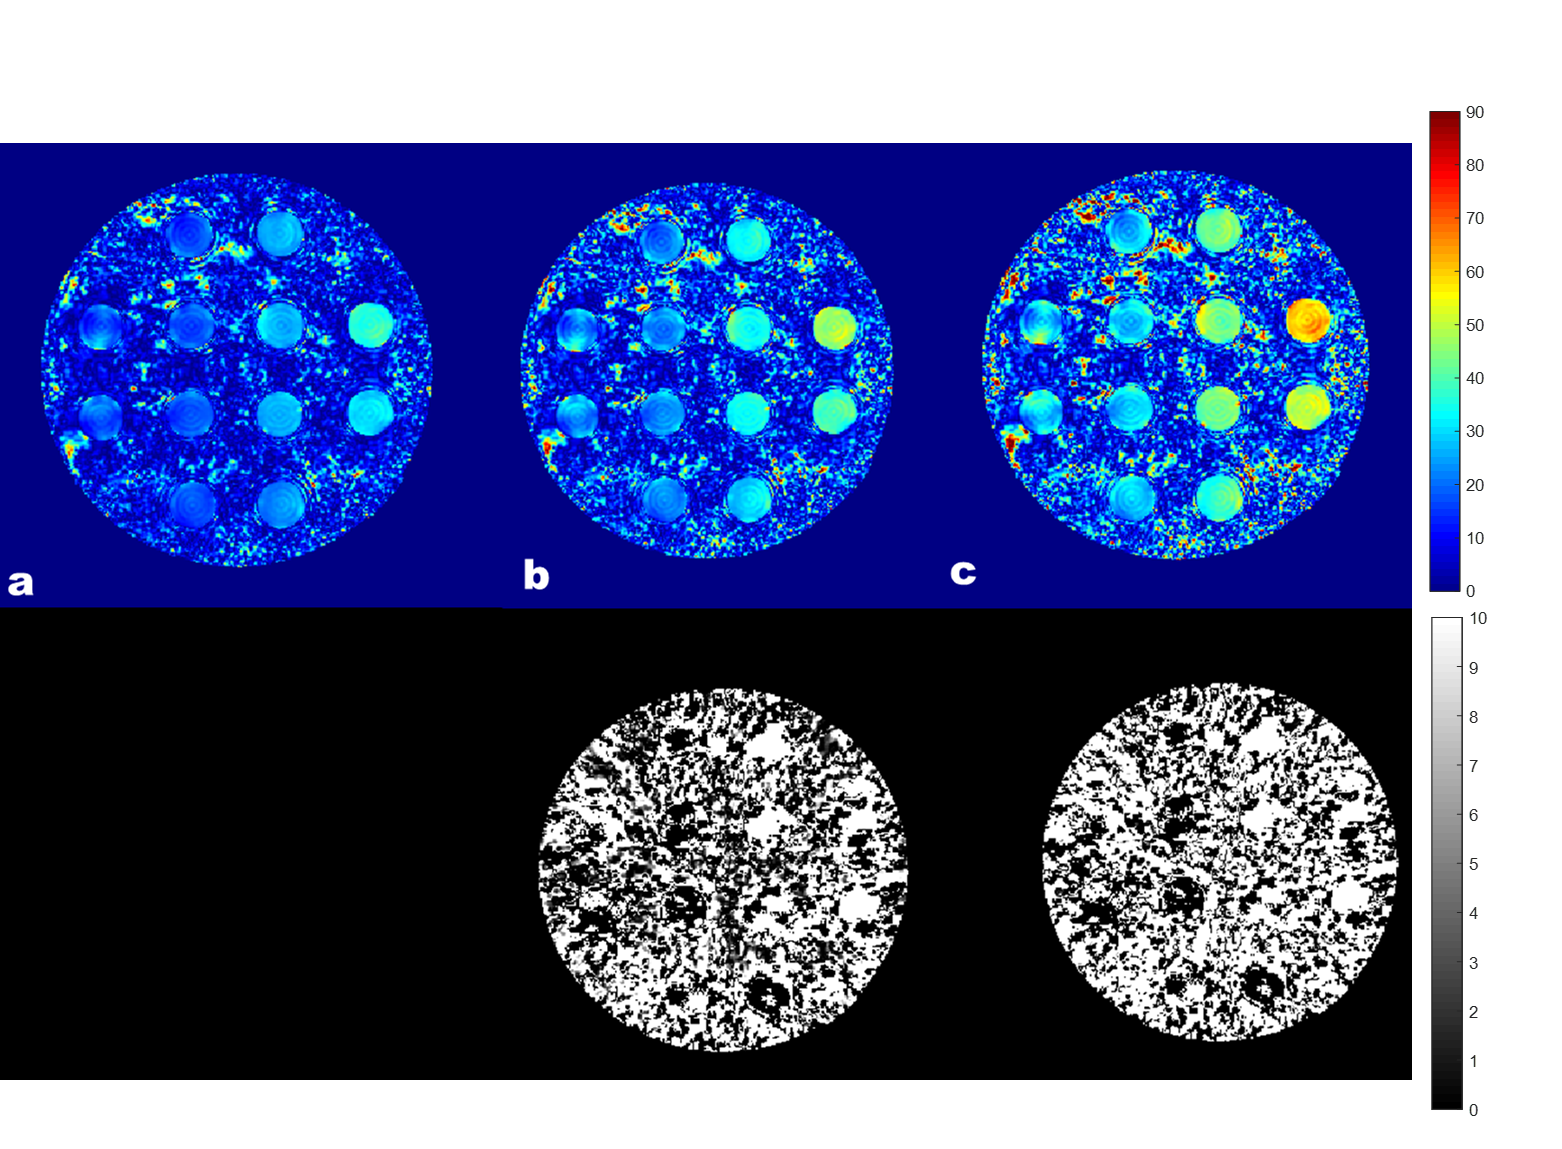
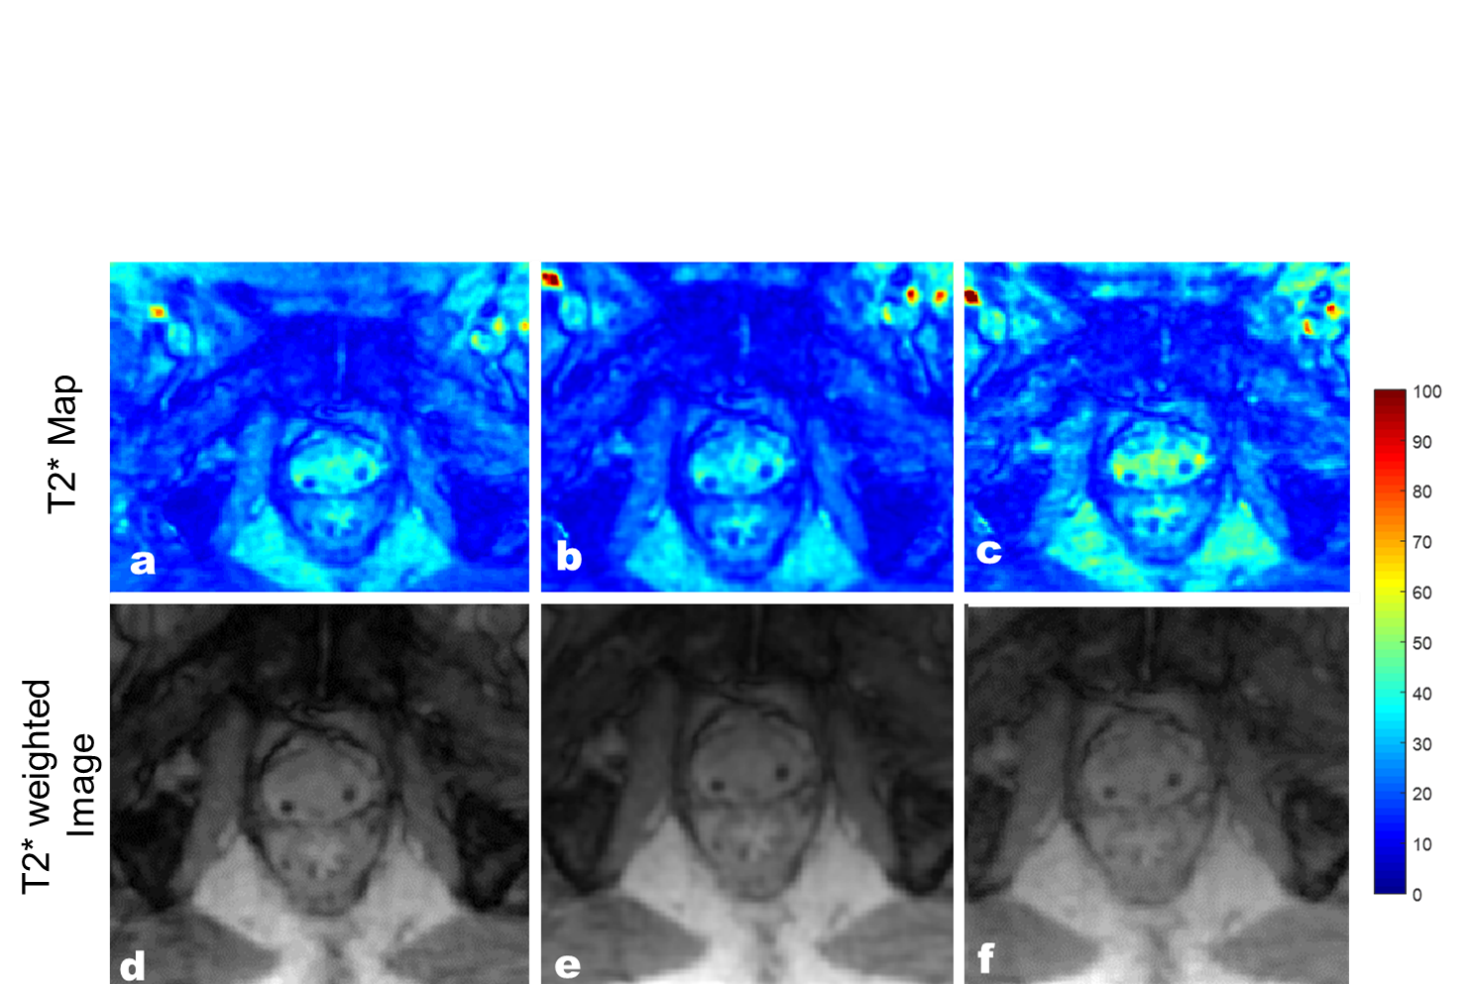
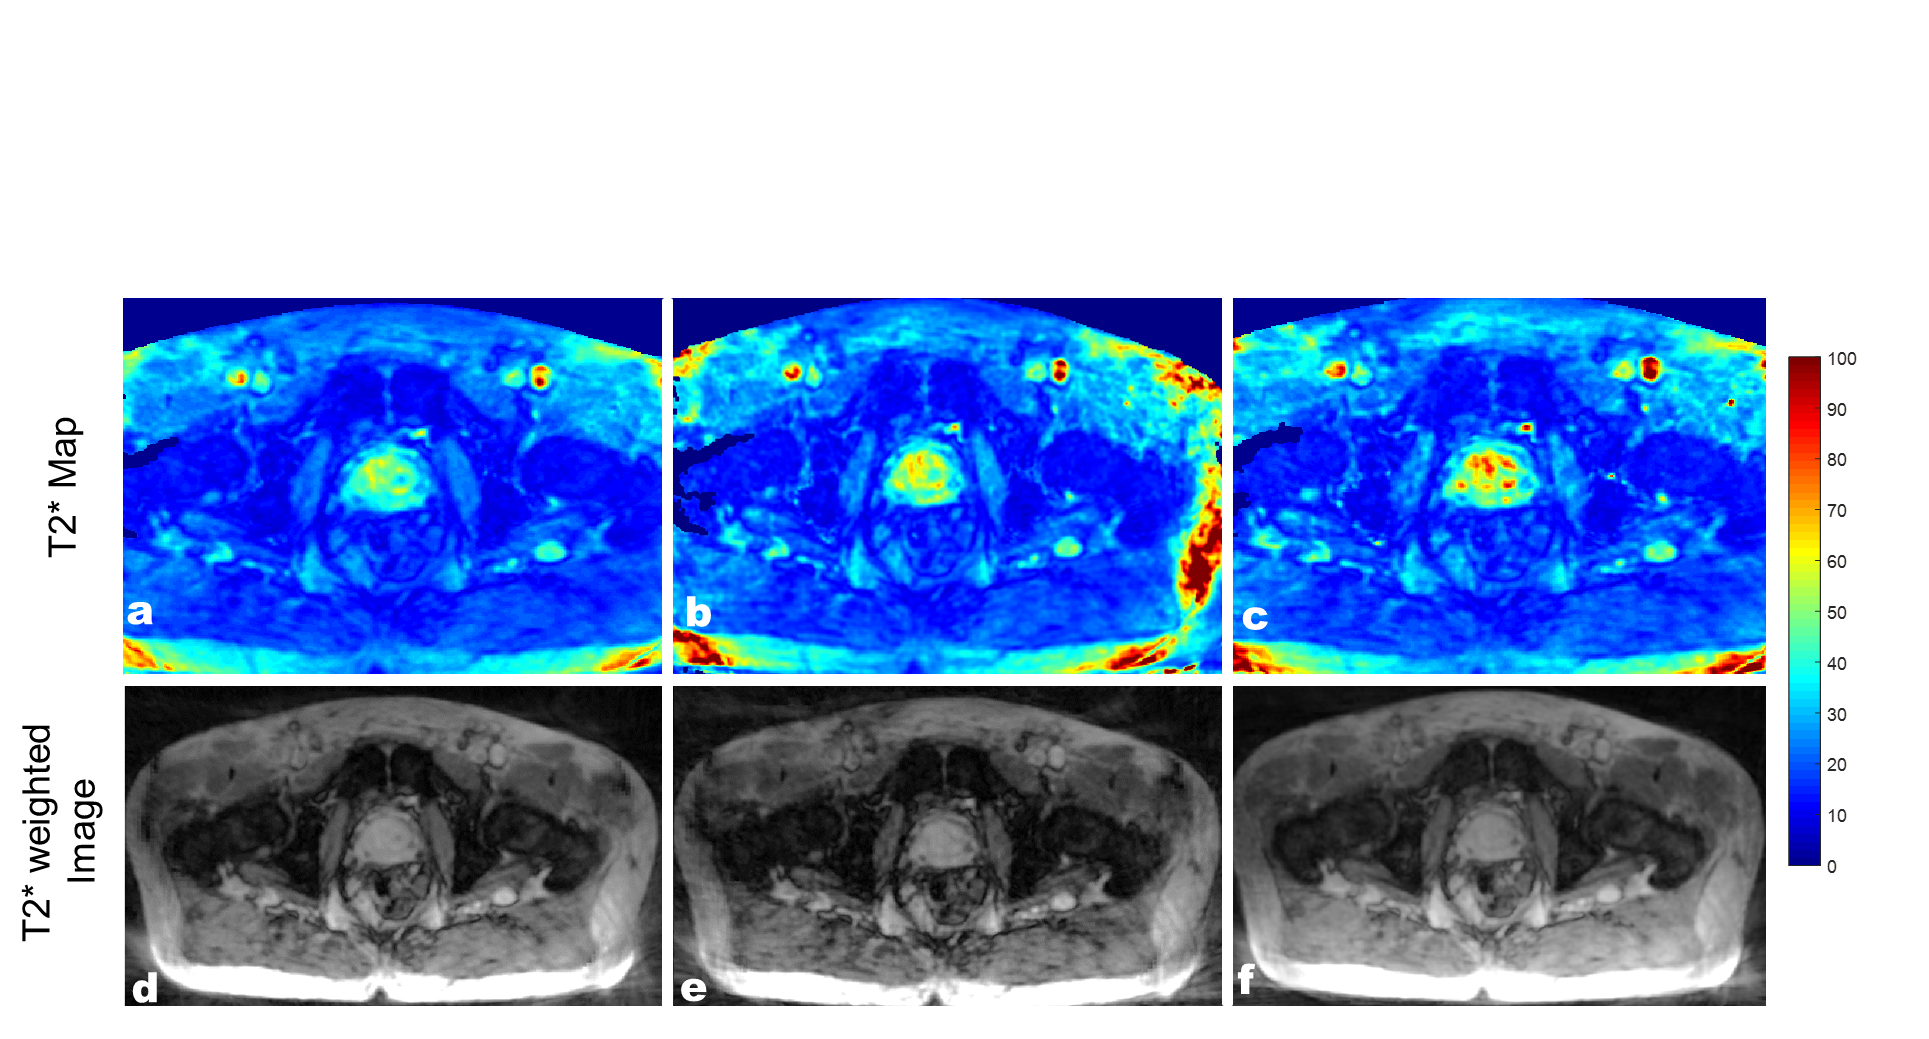
T2* map obtained with the proposed technique depicting a cross-section of the phantom are shown in Figure 2. The results showed that the T2* maps reconstructed from the undersampling scheme with the different spokes angles in alternate echoes showed less error. The majority of the difference is due to noise in the data as a result of undersampling as seen in the difference images n Figure 2. Similar results were observed in the patient’s data. The T2* maps and T2*w images (TE=40 ms) of the two patients are shown in Figure 3 and Figure 4. As compared to the fully sampled scan, the undersampled maps showed no visible signs of undersampling artifacts. Overestimation of T2* values in the prostate can be seen with the undersampling scheme which uses the same sampling pattern across all echoes.Discussion and Conclusion
We have successfully demonstrated the feasibility of accelerated T2* mapping in prostate cancer in clinically acceptable time. The proposed technique decreased the scan time by 45% (acquisition time = 4:10 minutes) which would allow time to incorporate additional qMRI techniques into the MR-guided radiotherapy using MR-Linac. In this feasibility study, field inhomogeneity and motion correction were not considered, but they will be included to improve the robustness of the technique.Acknowledgements
We acknowledge funding from the Cancer Research UK programme grant C33589/A19727. The Institute of Cancer Research and The Royal Marsden NHS Foundation Trust are members of the Elekta MR-Linac Research Consortium.References
1. Vergis R, Corbishley CM, Norman AR, Bartlett J, et al. Intrinsic markers of tumour hypoxia and angiogenesis in localised prostate cancer and outcome of radical treatment: a retrospective analysis of two randomised radiotherapy trials and one surgical cohort study. Lancet Oncol. 2008; 9:342–51.
2. Panek R, Welsh L, Baker LCJ, et al. Noninvasive Imaging of Cycling Hypoxia in Head and Neck Cancer Using Intrinsic Susceptibility MRI. Clin Cancer Res. 2017;23(15):4233–4241. doi:10.1158/1078-0432.CCR-16-1209.
3. Bano, Wajiha, et al. "Improved Accuracy of Accelerated 3D T2* Mapping through Coherent Parallel Maximum Likelihood Estimation." Proceedings of the Joint Annual Meeting ISMRM-ESMRMB, Paris, France. 2018.
4. N. Perraudin, D. Shuman, G. Puy, and P. Vandergheynst, “Unlocbox: A matlab convex optimization toolbox using proximal splitting methods,” arXiv preprint arXiv:1402.0779, 2014.
5. Fessler JA, Sutton BP. Nonuniform Fast Fourier transforms using Min‐Max interpolation. IEEE Trans Signal Process 2003;51:560–574.
6. A. Beck and M. Teboulle, “A fast iterative shrinkage-thresholding algorithm for linear inverse problems,”SIAMJournalonImagingSciences,vol.2,no.1,pp.183–202,2009.
7. M.A.Griswold,D.Walsh,R.M.Heidemann,et al. ,“Theuseofan adaptive reconstruction for array coil sensitivity mapping and intensity normalization,” Proc. Intl. Soc. Mag. Reson. Med., 2002.
Figures