4824
Texture Analysis in Chemotherapy Response Evaluation in Osteosarcoma: A Preliminary Study
Esha Baidya Kayal1, Devasenathipathy Kandasamy2, Raju Sharma2, Sameer Bakhshi3, and Amit Mehndiratta1,4
1Centre for Biomedical Engineering, Indian Institute of Technology, Delhi, New Delhi, India, 2Radio Diagnosis, All India Institute of Medical Sciences, New Delhi, New Delhi, India, 3Department of Medical Oncology, Dr. B.R. Ambedkar Institute-Rotary Cancer Hospital (IRCH), All India Institute of Medical Sciences, New Delhi, New Delhi, India, 4Department of Biomedical engineering, All India Institute of Medical Sciences, New Delhi, New Delhi, India
1Centre for Biomedical Engineering, Indian Institute of Technology, Delhi, New Delhi, India, 2Radio Diagnosis, All India Institute of Medical Sciences, New Delhi, New Delhi, India, 3Department of Medical Oncology, Dr. B.R. Ambedkar Institute-Rotary Cancer Hospital (IRCH), All India Institute of Medical Sciences, New Delhi, New Delhi, India, 4Department of Biomedical engineering, All India Institute of Medical Sciences, New Delhi, New Delhi, India
Synopsis
Recently texture analysis(TA) of MR images has also shown promising results in evaluating response to therapy in different types of cancer. TA uses mathematical approach to characterize the spatial distribution of signal intensity variations in an image and extracts quantitative features thus may infer clinically relevant information about tissue microstructure and its subtle changes during treatment. We examined efficacy of MRI based statistical TA methods in evaluating chemotherapy response in Osteosarcoma early in the course of treatment with correlation to histological response. Experimental results showed statistical TA methods may be effectively used in evaluating chemotherapy response in patient with Osteosarcoma.
Purpose
Histological necrosis is the current gold standard for chemotherapy response1; although only possible after anti-cancer therapy and surgery. RECIST1.1 criteria2 is the current standard for non-invasive treatment response evaluation in solid tumors. Quantitative analysis of functional MRI techniques like Diffusion weighted MRI (DWI), Perfusion MRI has also been reported for non-invasive evaluation of treatment response3. Recently texture analysis (TA)4 of MR images has also shown promising results in evaluating response to therapy in different types of cancer such as brain, breast, bone, prostate, lung, liver etc.5. TA uses mathematical approach to characterize the spatial distribution of signal intensity variations in an image and extracts quantitative features. Purpose was to assess the efficacy of MRI based statistical texture analysis in evaluating chemotherapy response in Osteosarcoma with correlation to histological response.Methods
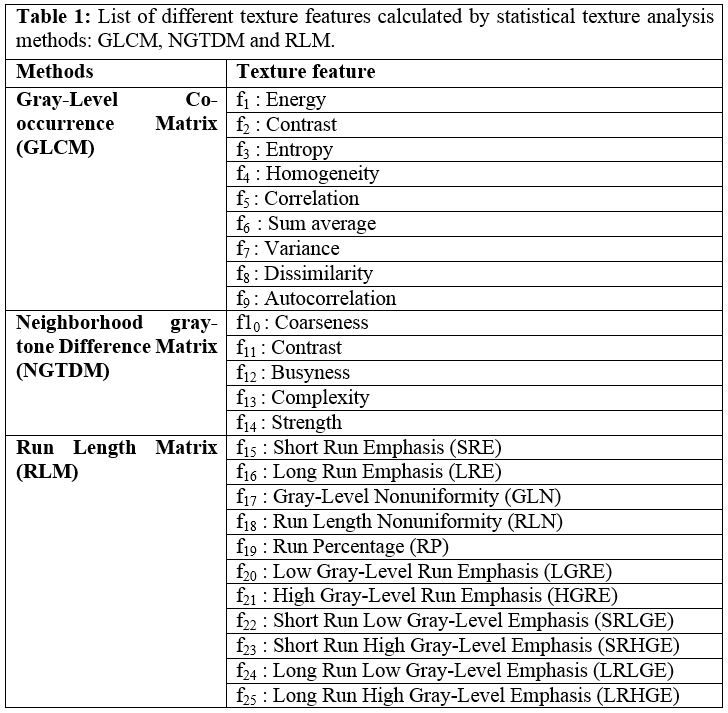
Dataset: Total thirty-two patients (n=32, Male:Female=24:8, Age=18.1±6.2 years; Metastatic:localized=14:18) with biopsy proven Osteosarcoma were analysed. MRI acquisitions were performed using a 1.5T Philips Achieva® MR scanner before neoadjuvant chemotherapy (NACT) (baseline) and after completion of NACT (follow-up). Conventional T1-weighted(T1W), T2-weighted(T2W) in axial, sagittal and coronal planes were acquired using Turbo-Spin-Echo sequence with TR/TE=528/10msec and 3797/60msec and matrix-size=512×512, 384×384 respectively. DWI using free breathing Spin Echo-Echo Planar imaging with varying gradient strengths (b-value=0-800s/mm2) was acquired with TR/TE=7541/67 msec, matrix size=192×192, slice thickness/Gap=5mm/0.5mm, voxel-size= 2.98/3.52/5.0 mm and 64 axial slices. All patient undergone surgery after completing NACT. Histopathological necrosis of surgical specimen served as the gold standard for response to NACT. <50% Histopathological necrosis was considered as No-response (NRes) and ≥50% necrosis was considered as Response (Res).Image analysis: Apparent diffusion coefficient (ADC) was evaluated for all baseline and follow-up data using mono-exponential fit at b-values ≥200 s/mm2 as: Sb = S200 e-b.ADC [1], assuming perfusion effect is negligible at higher b-values (b≥200 s/mm2). Region of interest (ROI) for tumor at baseline and follow-up were demarcated manually by a radiologist (>10 years of experience) on each slice of DWI images with b-value=800sec/mm2 (DWI800) covering whole tumor and registered to the T1W and T2W images. Figure1 depicts T1W, T2W, DWI800 and ADC map of a representative patient with overlaid tumor ROI at baseline and follow-up. Feature set of twenty-five textural features (elaborated in Table1) were evaluated in 3D tumor volume using TA methods – Grey-level co-occurrence matrix6 (GLCM) (feature; f1-f9), Neighborhood gray-tone difference matrix7 (NGTDM) (feature:f10-f14) and Run-length matrix8,9 (RLM) (feature:f15-f25) on T1W, T2W, DWI800 and ADC map at baseline and follow-up. GLCM characterizes the spatial relationship between pixel intensities in a specific direction and with a co-occurrence distance in an image. NGTDM quantifies the spatial relationship among neighbouring pixels, closely approaching the human perception of the image. RLM specifies coarse or fine texture with different intensity values in a specific direction. Relevant features set for classification was selected based on minimization of both classification error probability (POE) and average correlation coefficients (ACC) among features10. A multivariate discriminant analysis followed by Receiver operating characteristic curve (ROC) analysis was performed evaluating efficiency as sensitivity (Sn) and Specificity (Sp) of selected feature set in discriminating Responder and Non-responder to NACT. Quantitative parameter evaluation and Textural features extraction and statistical analysis were performed using an in-house built toolbox in MATLAB® (MathWorks Inc., v2017, Philadelphia, USA).
Results
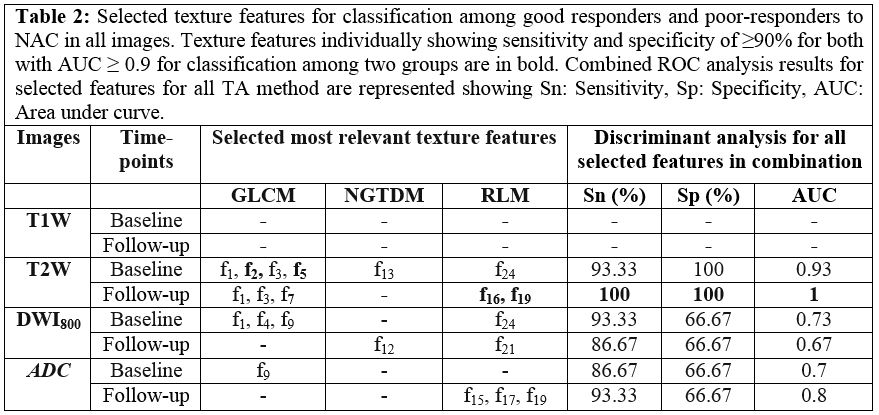
According to histopathological necrosis, Res and NRes groups had 12(35%) and 22(65%) patients respectively. Table2 presents the selected relevant textural features from different TA methods and prediction accuracy of NACT response. In T1W images at baseline and follow-up no features were found to be relevant in classifying Res and NRes. At baseline, T2W images with its selected texture feature set showed highest sensitivity:93.33%, specificity:100% and AUC:0.93 in discriminating Res and NRes than DWI800 and ADC (sensitivity=86.67-93.33%, specificity=66.67% with AUC=0.7). At follow-up, T2W images showed excellent discrimination among Res and NRes (sensitivity=100%; specificity=100%; AUC=1). Feature sets on DWI800 achieved sensitivity=86.67, specificity=66.67% and AUC=0.7 and ADC showed sensitivity=93.33%, specificity=66.67% with AUC=0.87 in identifying Res and NRes. Features f2, f5 (GLCM: contrast, correlation) at baseline and f16, f19 (RLM: LRE, RP) at follow-up on T2W images individually achieved sensitivity=93.33-100%, specificity=100% and AUC=0.93-1 in classifying Res and NRes.Discussion
GLCM features contrast and correlation measuring local variation and linearity of image intensity respectively, indicated heterogeneity in tumor and observed lower on T2W images among Res group than NRes at baseline. At follow-up, RLM feature Low-run-emphasis (LRE) measuring coarseness was lower and Run-percentage (RP) measuring image homogeneity found higher on T2W images in Res group indicating more homogeneous tumor environment than NRes group after chemotherapy. Statistical TA methods can characterize tissue microstructure in terms of spatial intensity variation and its subtle changes during treatment and may infer clinically relevant information that may not be easily perceived or qualitatively categorized.Conclusion
TA methods GLCM and RLM and features measuring heterogeneity in tumor were found to be most effective in evaluating NACT response early in the course of treatment. T2W images were found to be useful than DWI800 & ADC maps in this scenario. An early prediction and evaluation of the chemotherapy response may be beneficial for the patients by enabling personalized treatment regimen improving prognosis.Acknowledgements
No acknowledgement found.References
- Raymond A, Chawla S, Carrasco C, et al. Osteosarcoma chemotherapy effect: a prognostic factor. Semin Diagn Pathol. 1987;4(3):212-236.
- Eisenhauer EA, Therasse P, Bogaerts J, et al. New response evaluation criteria in solid tumours: revised RECIST guideline (version 1.1). Eur J Cancer. 2009;45(2):228-247. doi:10.1016/j.ejca.2008.10.026
- Brisse H, Ollivier L, Edeline V, et al. Imaging of malignant tumours of the long bones in children : monitoring response to neoadjuvant chemotherapy and preoperative assessment. Pediatr Radiol. 2004;34:595-605. doi:10.1007/s00247-004-1192-x
- Materka A, Strzelecki M. Texture Analysis Methods – A Review. Tech Univ Lodz, Inst Electron COST B11 Brussels. 1998:1-33.
- Alobaidli S, Msquaid S, South C, Prakash V, Evans P, Nisbet A. The role of texture analysis in imaging as an outcome predictor and potential tool in radiotherapy treatment planning. Br J Radiol. 2014;87(20140369):5-14. doi:10.1259/bjr.20140369
- Haralick RM, Shanmugam K, Dinstein I. Texture Features for Image Classification. IEEE Trans Syst Man Cybern. 1973;SMC-3(6):610-621.
- Amadasun M, King R. Texural Features Corresponding to Texural Properties. IEEE Trans Syst Man Cybern. 1989;19(5).
- Galloway MM. Texture analysis using grey-level run lengths. Comput Graph Image Process. 1975;4:172-179.
- Dasarathy B V., Holder EB. Image characterizations based on joint gray level-run length distributions. Pattern Recognit Lett. 1991;12(8):497-502. doi:10.1016/0167-8655(91)80014-2
- Mucciardi AN, Gose EE. Comparison of Seven Techniques for Choosing Subsets of Pattern Recognition Properties. IEEE Trans Comput. 1971;c-20(9):1023-1031.
Figures
.
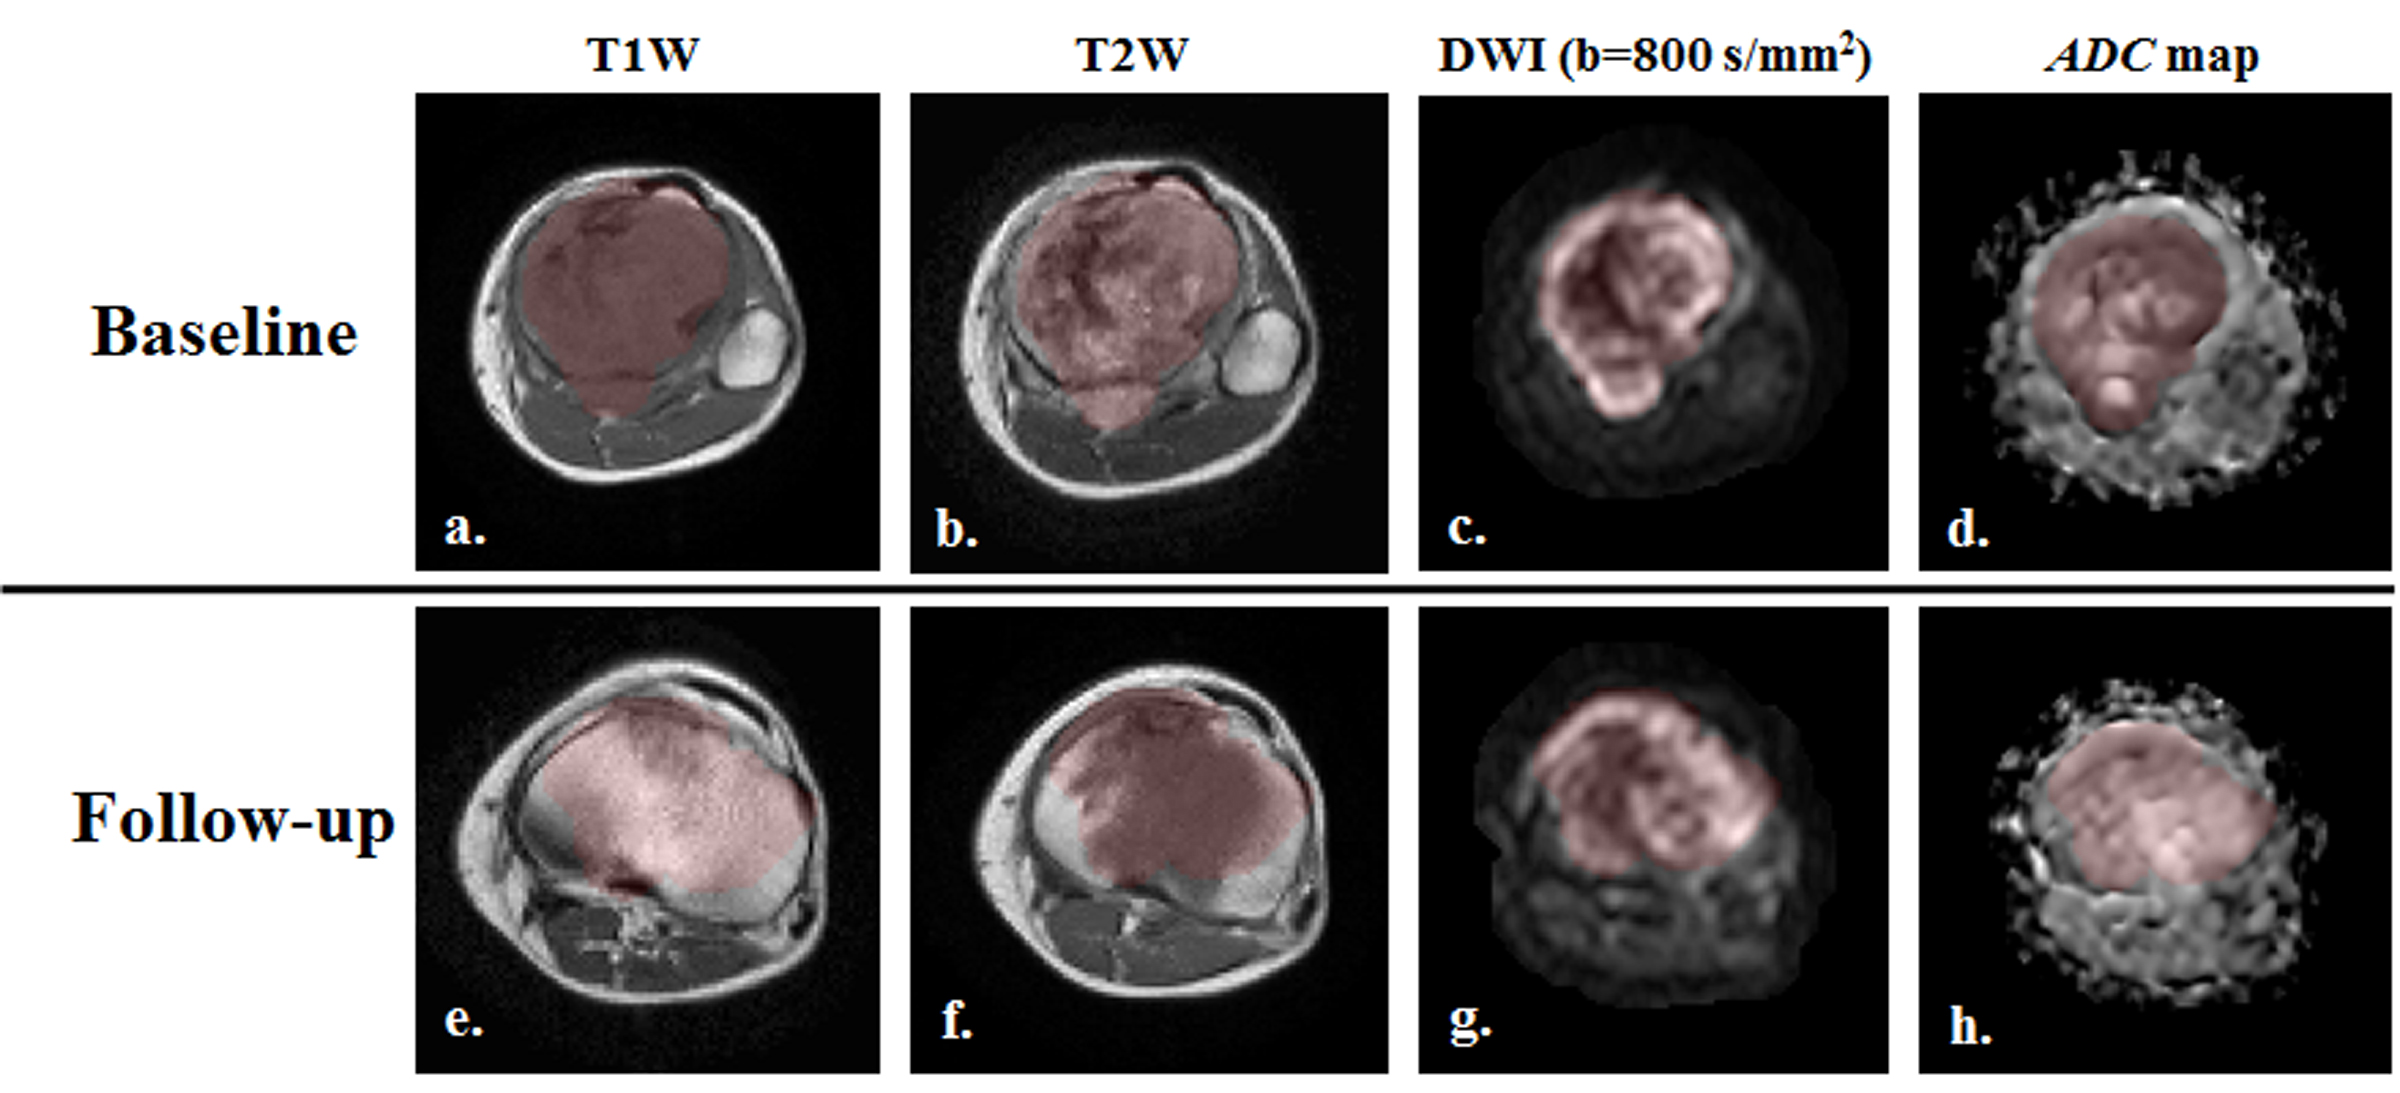
Figure
1: T1W, T2W, DWI (b=800 sec/mm2)
images and ADC map with
overlaid (red) tumor ROI from a representative patient (M, 16 years) with
Osteosarcoma in left tibia.
.