4821
Differential diagnosis of hepatic benign and malignant tumors using texture features based on multiple high b-values DWI1The First Affiliated Hospital of Dalian Medical University, Dalian, China, 2Philips Healthcare, Beijing, China
Synopsis
This work aimed for multiple high b-values DWI texture features based strategy to identify hepatic benign and malignant tumors, which may provide more abundant and comprehensive quantitative information and promote clinical decision-making. The results showed that texture features based on ultra-high b value (b = 3000 s/mm2) DWI images can achieve the best result (combined AUC: 0.960; sensitivity: 92.0%; specificity: 92.3%), forming a valuable strategy for clinical practice.
Purpose
To investigate the value of texture features based on multiple high b-values diffusion-weighted imaging (DWI) images in differentiation of hepatic benign tumors (hepatic hemangioma (HH) and focal nodular hyperplasia (FNH)) and hepatic malignant tumors (hepatocellular carcinoma (HCC) and intrahepatic cholangiocarcinoma (ICC)).Introduction
Liver cancer is one of the most common hepatic malignant tumors, mainly consisted of heapatocellular carcinoma (HCC) and intrahepatic cholangiocarcinoma (ICC). Hepatic hemangioma (HH) and focal nodular hyperplasia (FNH) are common hepatic benign hypervascular tumors. In most cases, it can be differentiated for hepatic benign and malignant tumors according to clinical history and typical imaging signs. However, there are some overlapping MRI features between the two kinds of tumors, which represents a diagnostic challenge. High b-values diffusion-weighted imaging (DWI), with the ability to separate pure diffusion movement and perfusion, was found to be more powerful than the ADC value in discriminating hepatic benign and malignant tumors[1]. Texture analysis is a new image analysis method, which has been used for malignant tumor grade or prognosis evaluations[2,3,4]. MR texture analysis can quantify the distribution of signal intensity of voxels within the tumor to reflect tumor heterogeneity[5]. We hypothesize that it’s feasible to identify hepatic benign and malignant tumors by multiple high b-values DWI texture features based strategy.Materials and Methods
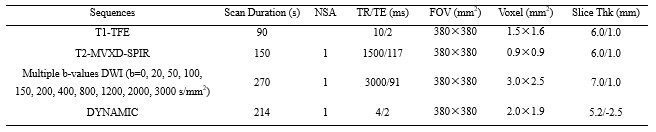
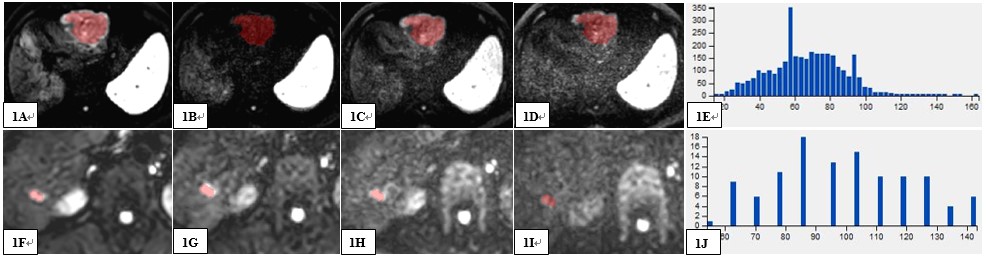
The present study retrospectively enrolled 38 patients from May 2019 to September 2019 in our hospital who were pathologically or follow-up imaging confirmed as HHs (n=10, 5 male, 5 female, (57.10±15.74) years old), FNHs (n=3, 2 male, 1 female, (38.33±2.89) years old), HCCs (n=20, 17 male, 3 female, (56.20±9.73) years old) or ICCs (n=5, 2 male, 3 female, (65.80±7.36) years old), respectively. The hepatic tumors were divided into hepatic benign tumors (HBT) group and hepatic malignant tumors (HMT) group. All patients have underwent preoperative MR examinations (3.0T MR scanner, Ingenia CX, Philips, Holland), including routine scanning (T1WI, T2WI, and dynamic contrast-enhanced MR imaging) sequences and additional multiple b-values DWI sequence (b values = 0, 20, 50, 100, 150, 200, 400, 800, 1200, 2000, 3000 (s/mm2)). Detailed MR scanning parameters were shown in Table 1. On the intelli space portal (ISP) workstation, the multiple high b-values DWI images (b values = 800, 1200, 2000, 3000 (s/mm2), respectively) were exported as DICOM formats. Then, the images were imported to Omni-Kinetics software (GE Healthcare) for further measurements. The radiologist reviewed the MR images and manually outlined the region of interests (ROIs) on the largest slice of the tumor on four high b-value DWI images, respectively, then texture features were generated automatically (shown in Figure 1). Texture related parameters consisted of MinIntensity, MaxIntensity, stdDeviation, Variance, MeanDeviation, RelativeDeviation, skewness, kurtosis, uniformity, Quantile90, Quantile95, GreyLevelNonuniformity and RunLengthNonuniformity. Data analyses were performed using SPSS 20.0 statistical software. Independent sample t test or Mann-Whitney U test was used for above texture parameters. Diagnostic performance was evaluated by receiver operating characteristic (ROC) analysis, and combined diagnosis was evaluated by logistic regression.Results
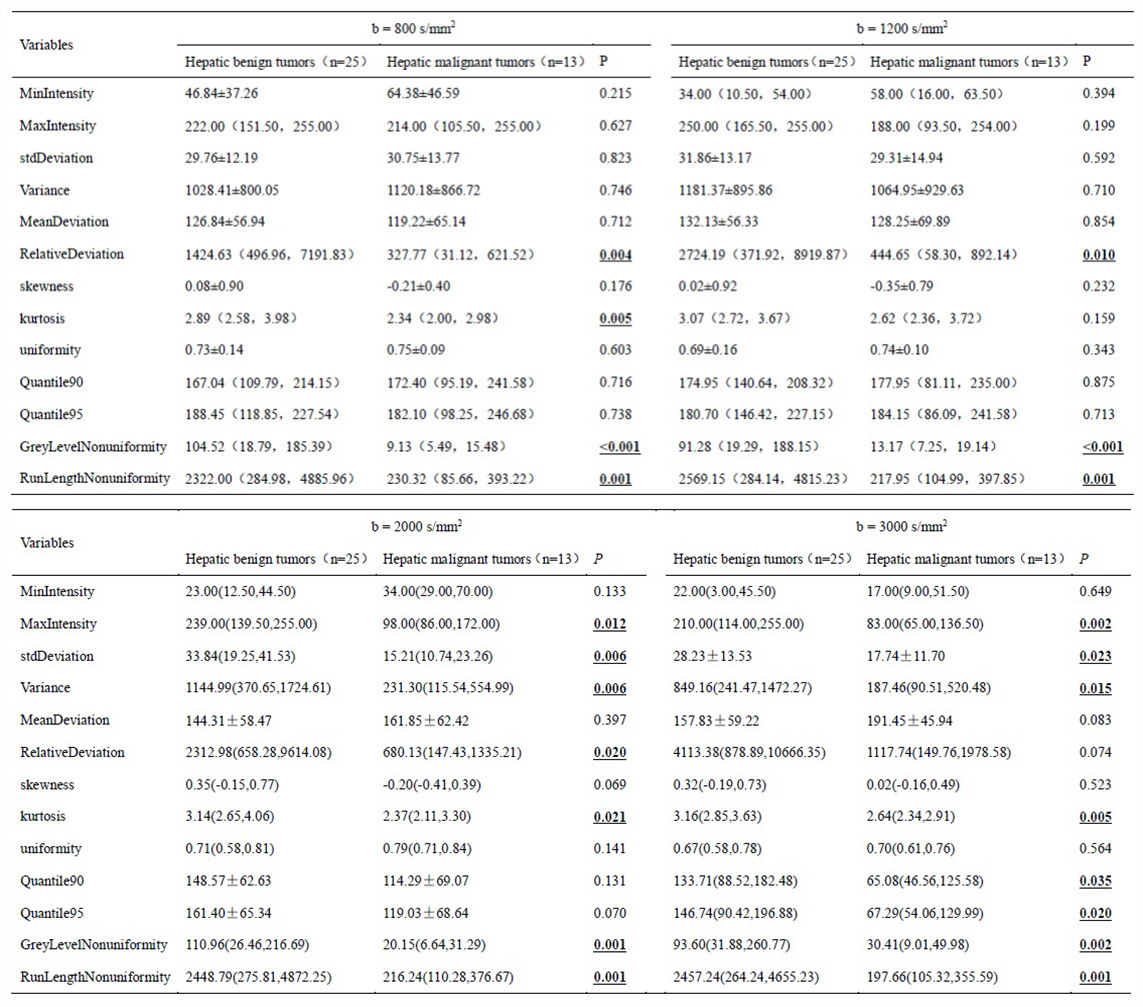
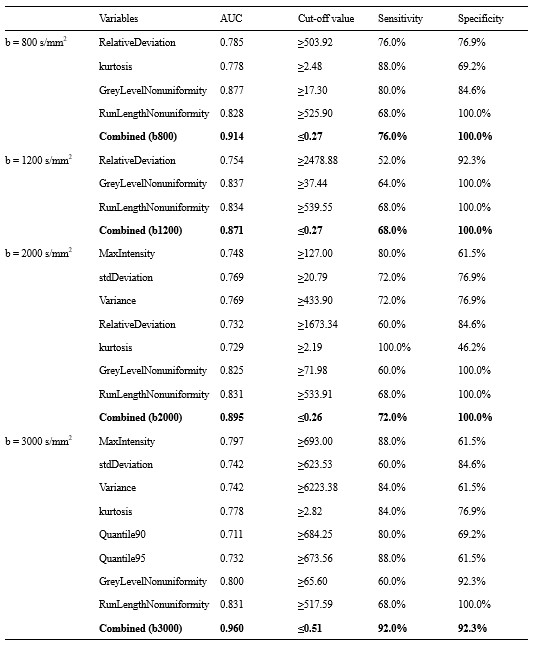
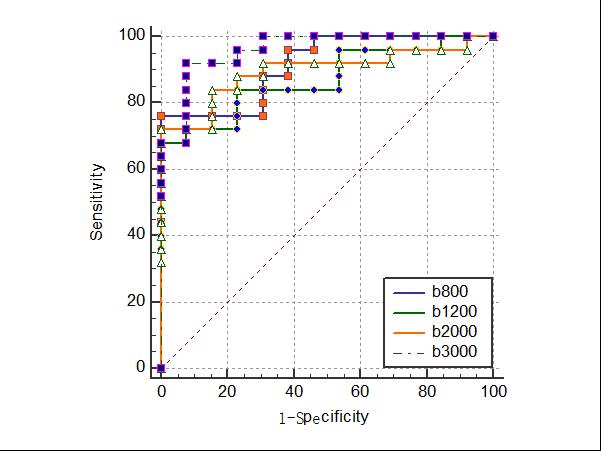
There was a significant difference in four, three, seven, and eight texture features of different high b-values DWI images (b values = 800, 1200, 2000 and 3000 (s/mm2), respectively) between the HBT and HMT groups, the results were shown in Table 2. The remaining parameters were not statistically different (P>0.05, Table 2). For DWI images which b value was 800 s/mm2, the combined AUC integrating multiple parameters was 0.914, the sensitivity and specificity were 76.0% and 100.0%, respectively. When the b value were 2000 and 3000 s/mm2, the combined AUC, sensitivity and specificity were 0.871 and 0.895, 68.0% and 72.0%, 100.0% and 100.0%, respectively. Results indicated that texture features based on ultra-high b value (b = 3000 s/mm2) DWI images was the optimal strategy to identify hepatic benign and malignant tumors (combined AUC: 0.960, sensitivity: 92.0%, specificity: 92.3%, were shown in Table 3 and Figure 2).Discussion and Conclusion
Grey Level nonuniformity (GLN) measures the similarity of gray-level intensity values in the image, where a lower GLN value correlates with a greater similarity in intensity values. Run Length nonuniformity (RLN) measures the similarity of run lengths throughout the image, with a lower value indicating more homogeneity among run lengths in the images. The GLN and RLN in HMT group was higher compared to HBT group in condition of four high b-values (b=800, 1200, 2000, and 3000 s/mm2) DWI. One convincing explanation is that HCC and ICC are highly malignant, the composition of the tumors are heterogeneous which prone to be necrotic and hemorrhagic, and the heterogeneity of hepatic malignant tumors are more obvious. Based on ultra-high b value (b = 3000 s/mm2) DWI images, we obtained the optimal results (combined AUC: 0.960, sensitivity: 92.0%, specificity: 92.3%). In the current study, we proposed a high b-values DWI based texture strategy to preoperatively identify HBT and HMT, which will provide a more promising method for tumor differentiation in clinic and facilitate clinical management.Acknowledgements
No acknowledgement found.References
[1] Qin Y, Yu X, Hou J, et al. Predicting chemoradiotherapy response of nasopharyngeal carcinoma using texture features based on intravoxel incoherent motion diffusion-weighted imaging. Medicine (Baltimore). 2018, 97(30): e11676.
[2] Suo ST, Chen XX, Fan Y, et al. Histogram analysis of apparent diffusion coefficient at 3.0 T in urinary bladder lesions: correlation with pathologic findings. Acad Radiol, 2014, 21(8): 1027-1034.
[3] Ma X, Zhao X, Ouyang H, et al. Quantified ADC histogram analysis: a new method for differentiating mass-forming focal pancreatitis from pancreatic cancer. Acta Radiol, 2014, 55(7): 785-792.
[4] Woo S, Cho JY, Kim SY, et al. Histogram analysis of apparent diffusion coefficient map of diffusion-weighted MRI in endometrial cancer: a preliminary correlation study with histological grade. Acta Radiol, 2014, 55(10): 1270-1277.
[5] Li H, Zhang J, Zheng Z, et al. Preoperative histogram analysis of intravoxel incoherent motion (IVIM) for predicting microvascular invasion in patients with single hepatocellular carcinoma. Eur J Radiol. 2018, 105: 65-71.
Figures