4818
Surveillance of the Morphologic and Metabolic Features of the Tumor Microenvironment During Progression of Glioblastoma1Department of Biomedical Engineering, Yale University, New Haven, CT, United States, 2Department of Radiology and Biomedical Imaging, Yale University, New Haven, CT, United States
Synopsis
The morphologic and metabolic basis of the tumor microenvironment is multifaceted, and this complexity is magnified throughout tumor progression. Therefore longitudinal surveillance of this habitat during tumor growth will improve drug targeting. We used translational MRI methods in glioblastoma models to investigate time-dependent remodeling of the extracellular matrix and microvasculature in relation to interstitial acidification. With tumor progression, we detected extracellular volume reduction and vascular plasma flow increase, but extracellular pH and vascular permeability remained unchanged. These differential dynamic processes regulating morphologic and metabolic transformations of the tumor microenvironment suggest distinct time windows for mechanistic therapeutic targeting.
Introduction
Grade IV gliomas, or glioblastomas (GBMs), are the most common malignant primary CNS tumor in adults and carry a dismal prognosis even with maximal surgical and medical intervention1. Variability in the structural appearance, size, metabolism, microvasculature and genetic landscape of GBMs represents a highly complex tumor microenvironment. Throughout tumor progression there is further remodeling of microvasculature and reprogramming of metabolic pathways, resulting in an immunosuppressive and changing microenvironment characterized by immature, permeable vasculature and extracellular acidification due to a metabolic shift towards aerobic glycolysis2,3. Although more reproducible orthotopic xenograft models of GBM have been studied, a rigorous characterization of the changing microenvironment during tumor progression is needed to better evaluate therapeutic response and efficacy of targeted therapies.Relaxation (T1, T2) and diffusion-weighted MRI is used clinically for initial identification and therapeutic monitoring of GBM4; however, tumor variability makes imaging characteristics heterogenous, hard to define with progression and unable to fully capture the microenvironment complexity. Therefore, advanced MRI methods can be pursued to more fully characterize the structural, vascular and metabolic changes occurring during tumor progression. Specifically, the vascular microenvironment can be quantified by two-compartment modeling of the dynamic uptake of Gd3+ contrast agents using dynamic contrast enhanced (DCE) MRI, which allows vascular permeability (Ktrans), plasma flow (Fp), and extracellular (ve) and plasma (vp) volume fractions to be quantified5,6. Interstitial acidosis, reflected as reduced extracellular pH (pHe), can be quantified using chemical shift imaging (CSI) of the pH-dependent chemical shifts of paramagnetic macrocyclic agents (TmDOTP5-) with Biosensor Imaging of Redundant Deviation in Shifts (BIRDS)7-9. Here we demonstrate 3D mapping of the tumor microenvironment over time reflecting remodeling of the extracellular matrix and microvasculature, as well as interstitial acidification, during tumor progression in a human-derived (U87) model of GBM.
Methods
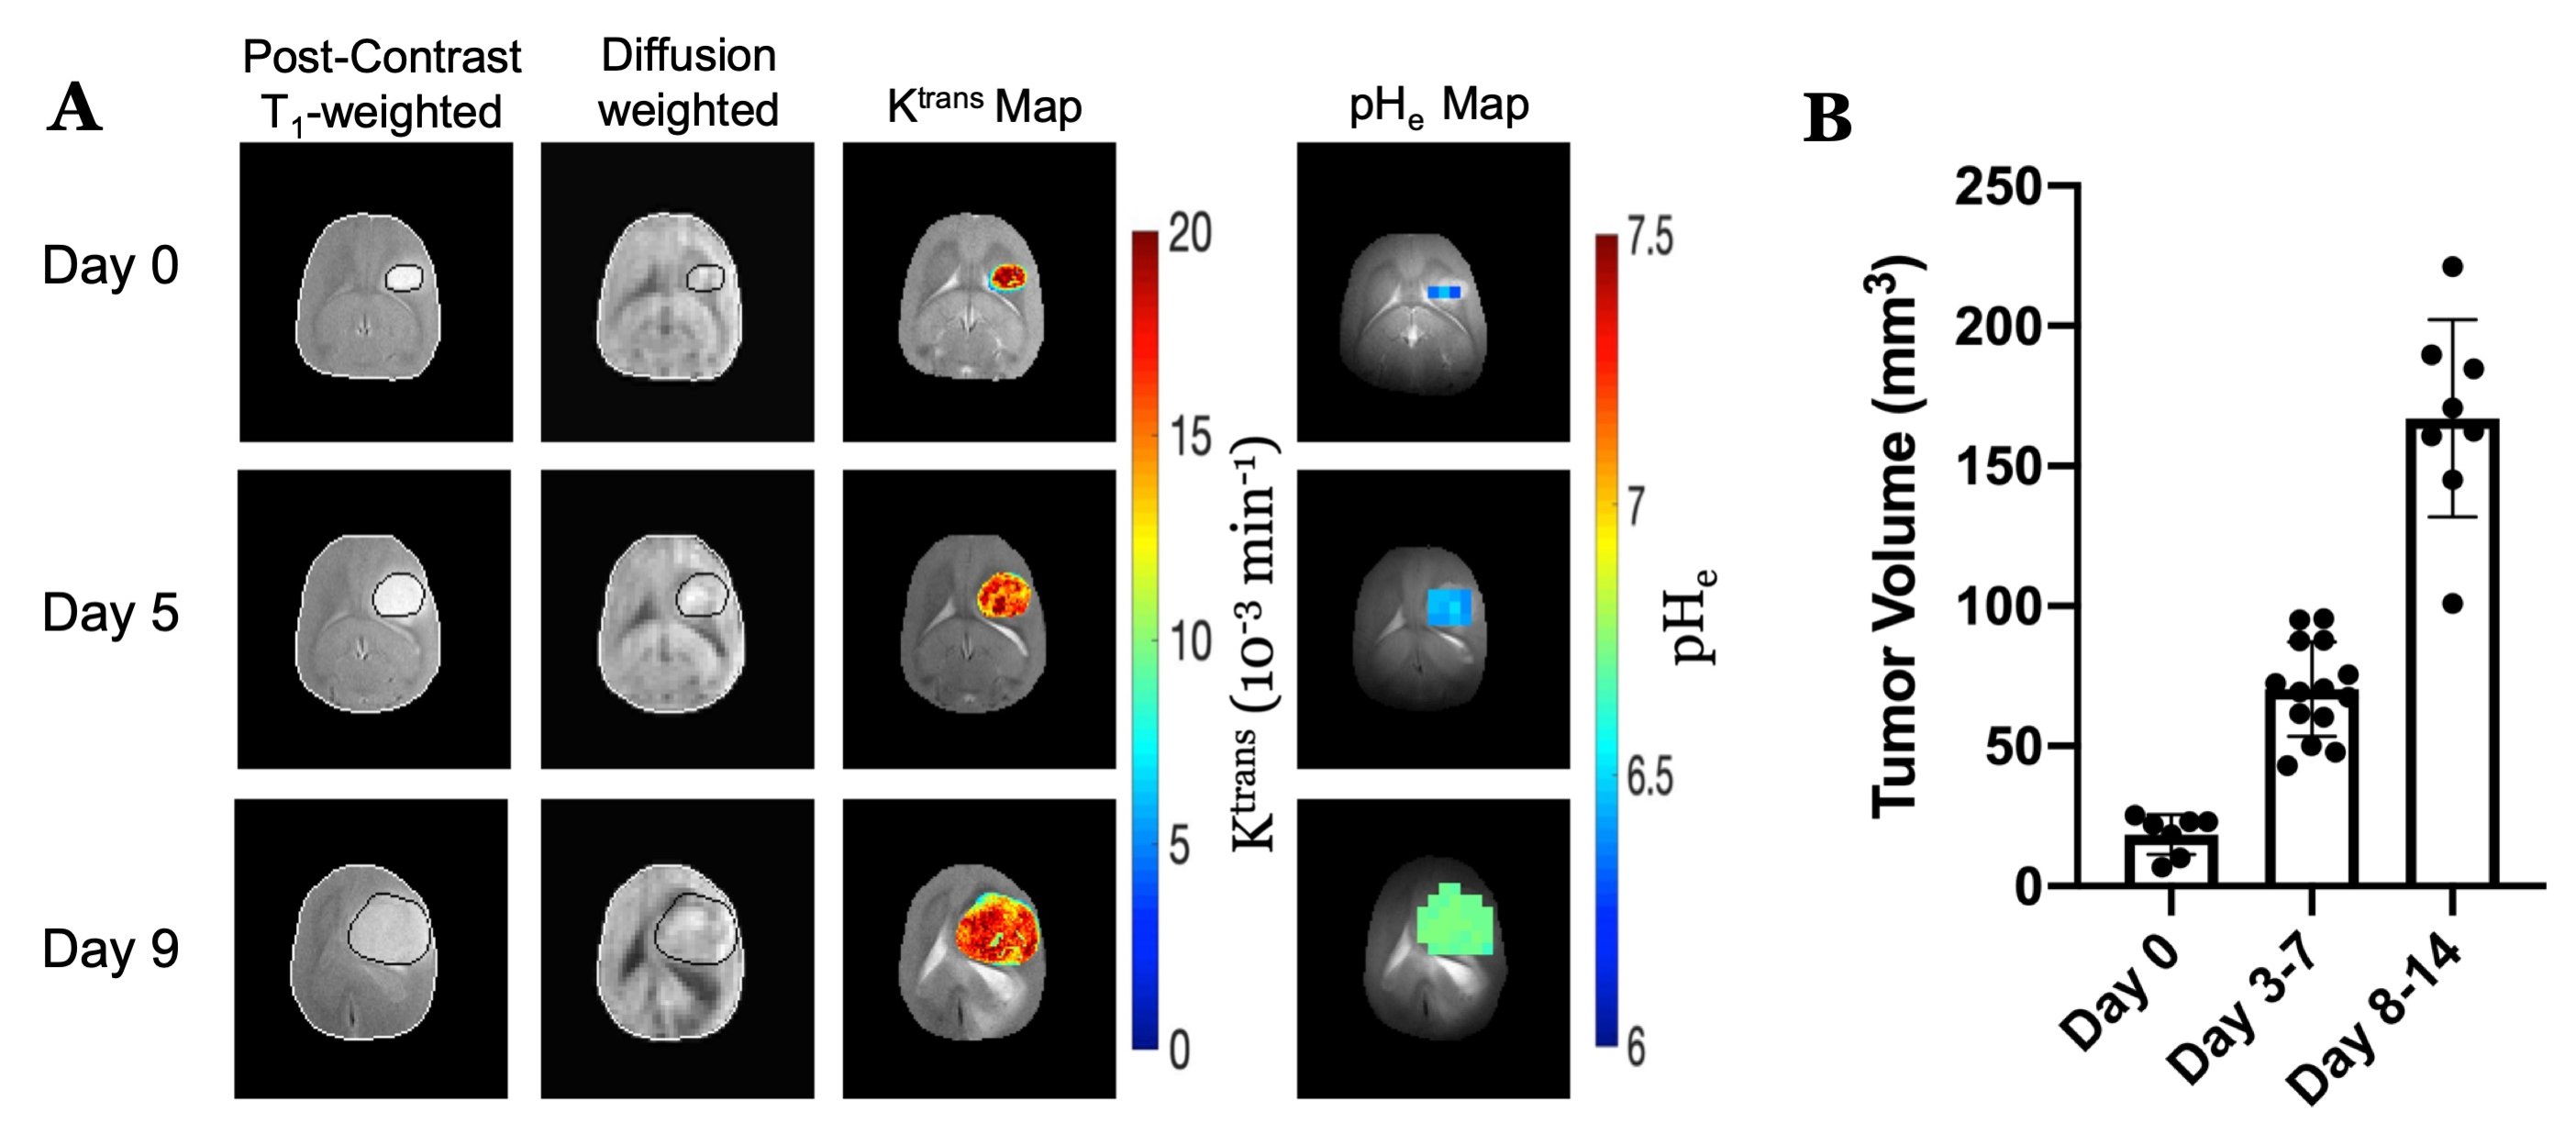
U87 cells were injected intracranially (2.0 x10⁵ cells in 5 µL) into Athymic/Nude rats (n=15). After initial tumor identification (~10 days after injection), imaging, DCE, and pHe measurements were made and repeated every 3-7 days (up to three times) throughout tumor progression (n=29). All imaging data were acquired at 11.7T. Quantitative T2 (TE/TR: 10-100/6000ms), T1 (TE/TR: 10ms/0.4-5s, before and after 0.25 mmol/kg gadobutrol) and apparent diffusion coefficient (ADC, b: 0-3000 s/mm2) maps were acquired. DCE-MRI was acquired using a dual-echo gradient echo acquisition (TR/TE: 39ms/2.5-5ms) every 5 seconds during a bolus IV injection of 0.25mmol/kg gadobutrol. Vascular parameters (Ktrans, Fp, ve, and vp) were calculated using a two-compartment exchange model5,6. For BIRDS pHe measurements, a coinfusion of 100 mg/kg probenecid and 1 mmol/kg TmDOTP5- was administered10,11, and CSI was used to measure the chemical shifts of the pHe-dependent proton resonances of TmDOTP5- to calculate pHe within each voxel at an isotropic resolution of 1mm3 as previously described7-9. Each parameter was averaged across all voxels within the tumor boundary defined by T1 contrast enhancement at each time point. Parametric maps were registered in the same space and voxel level distributions are shown to reflect the heterogeneity in parameter measurements.Results and Discussion
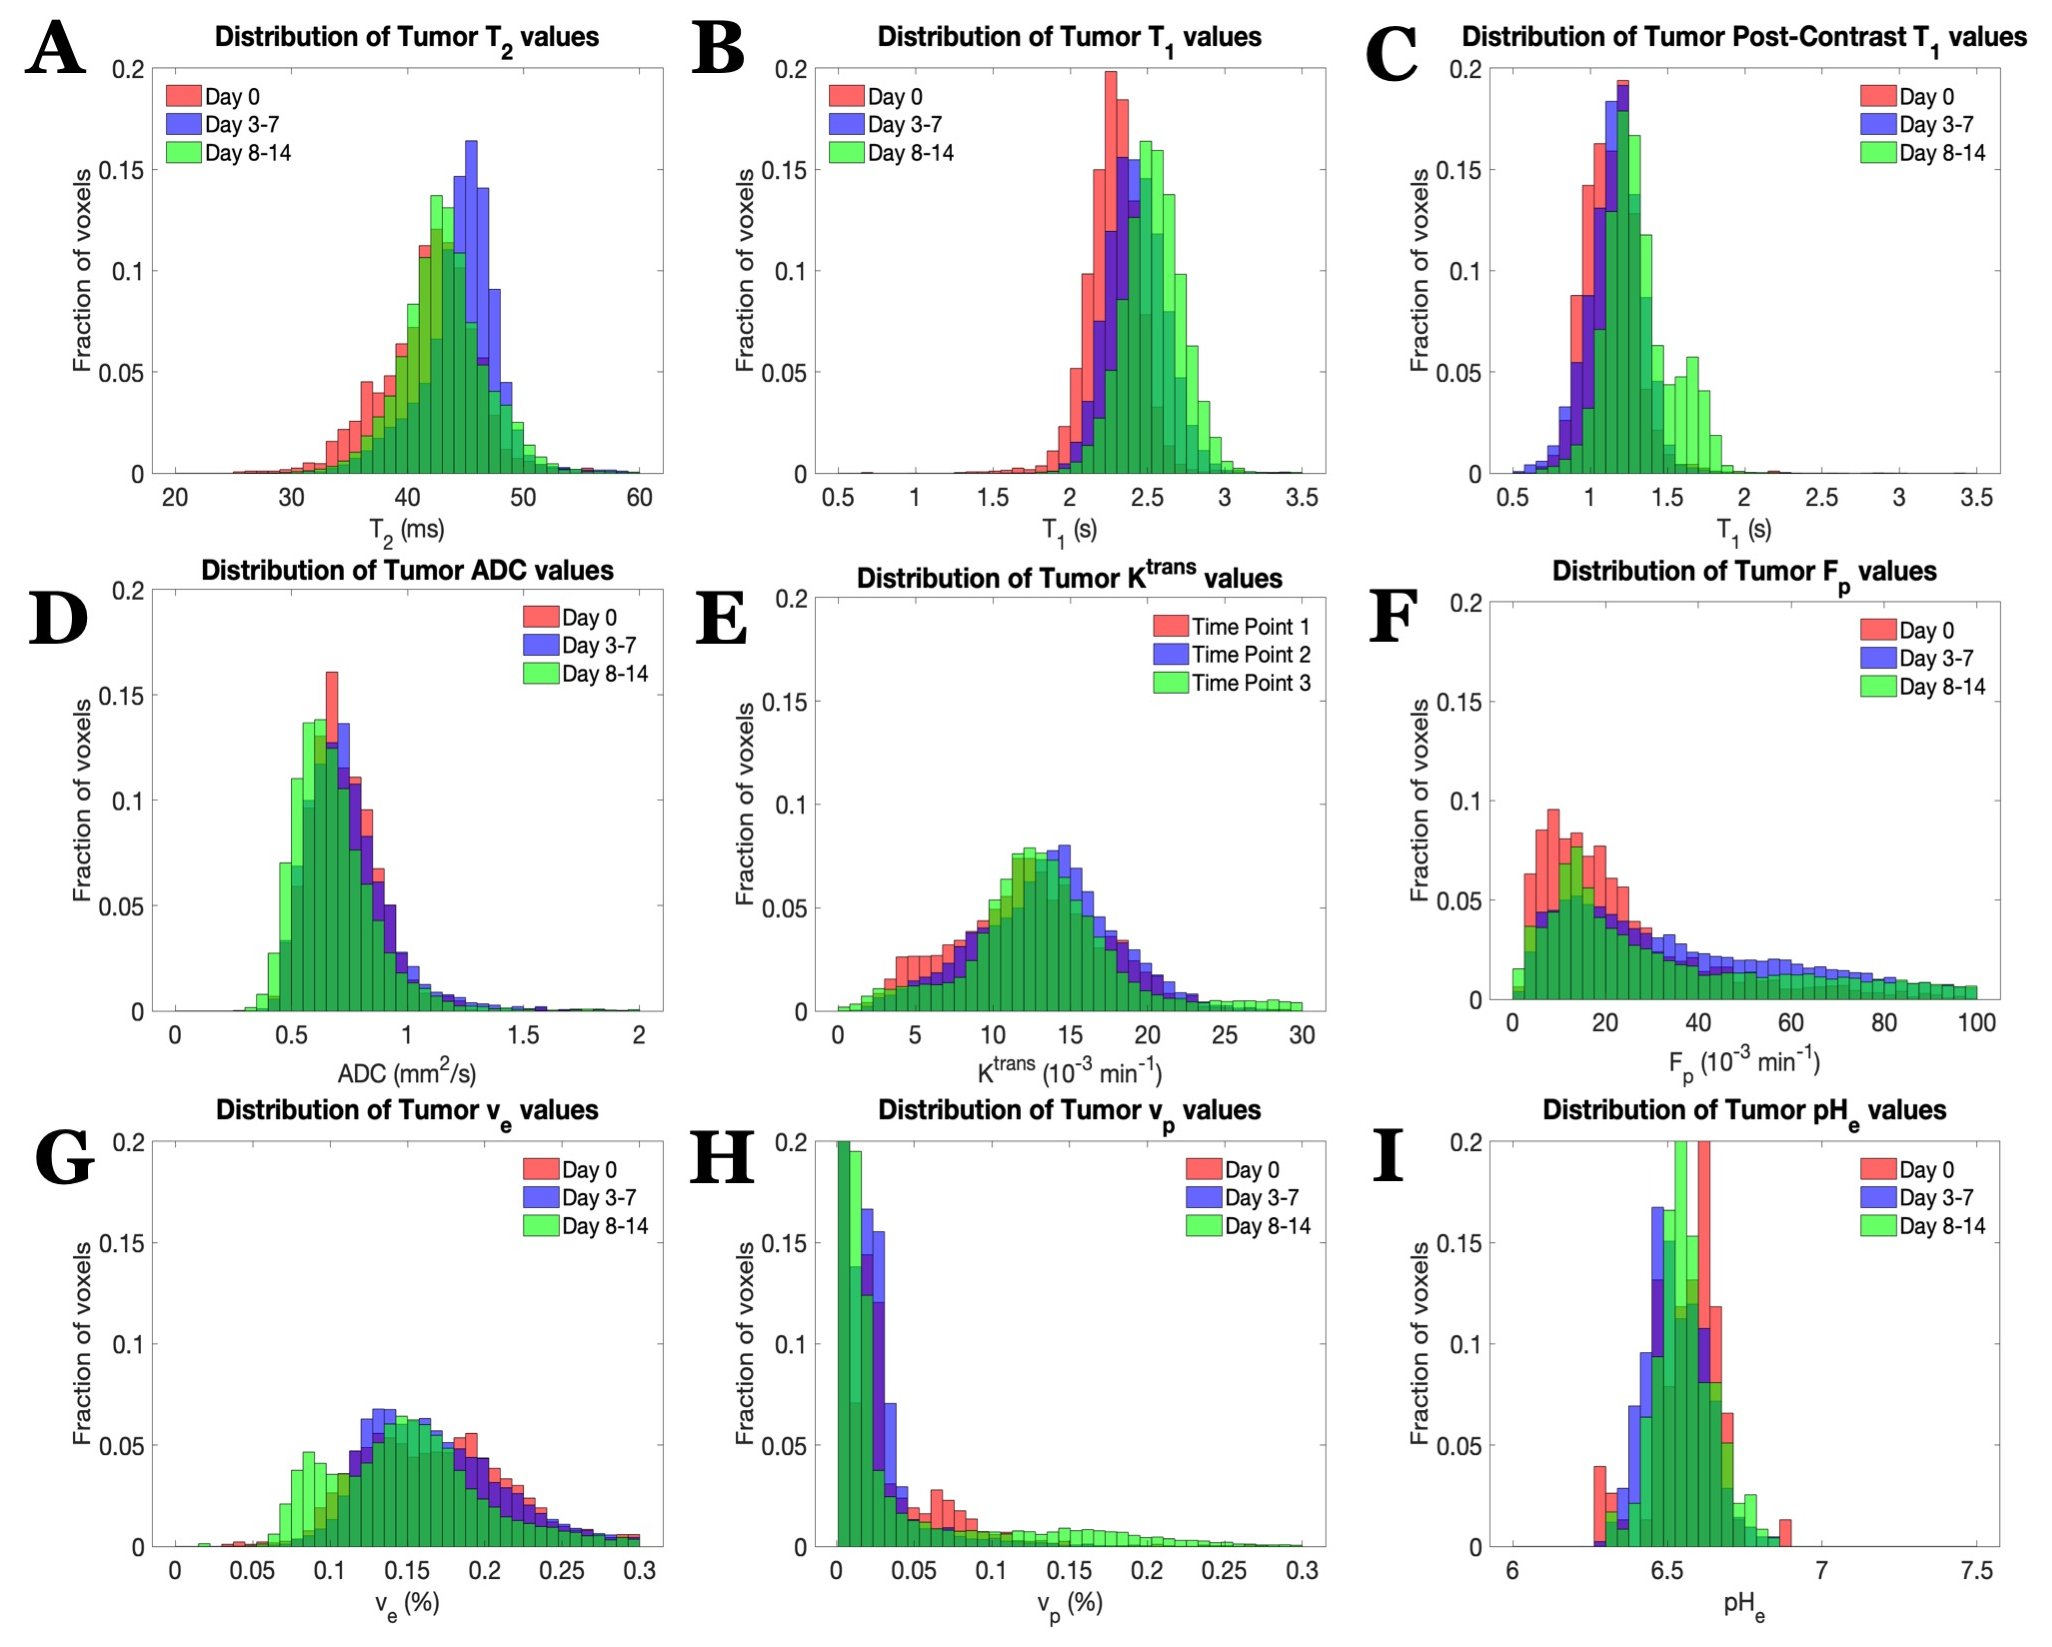
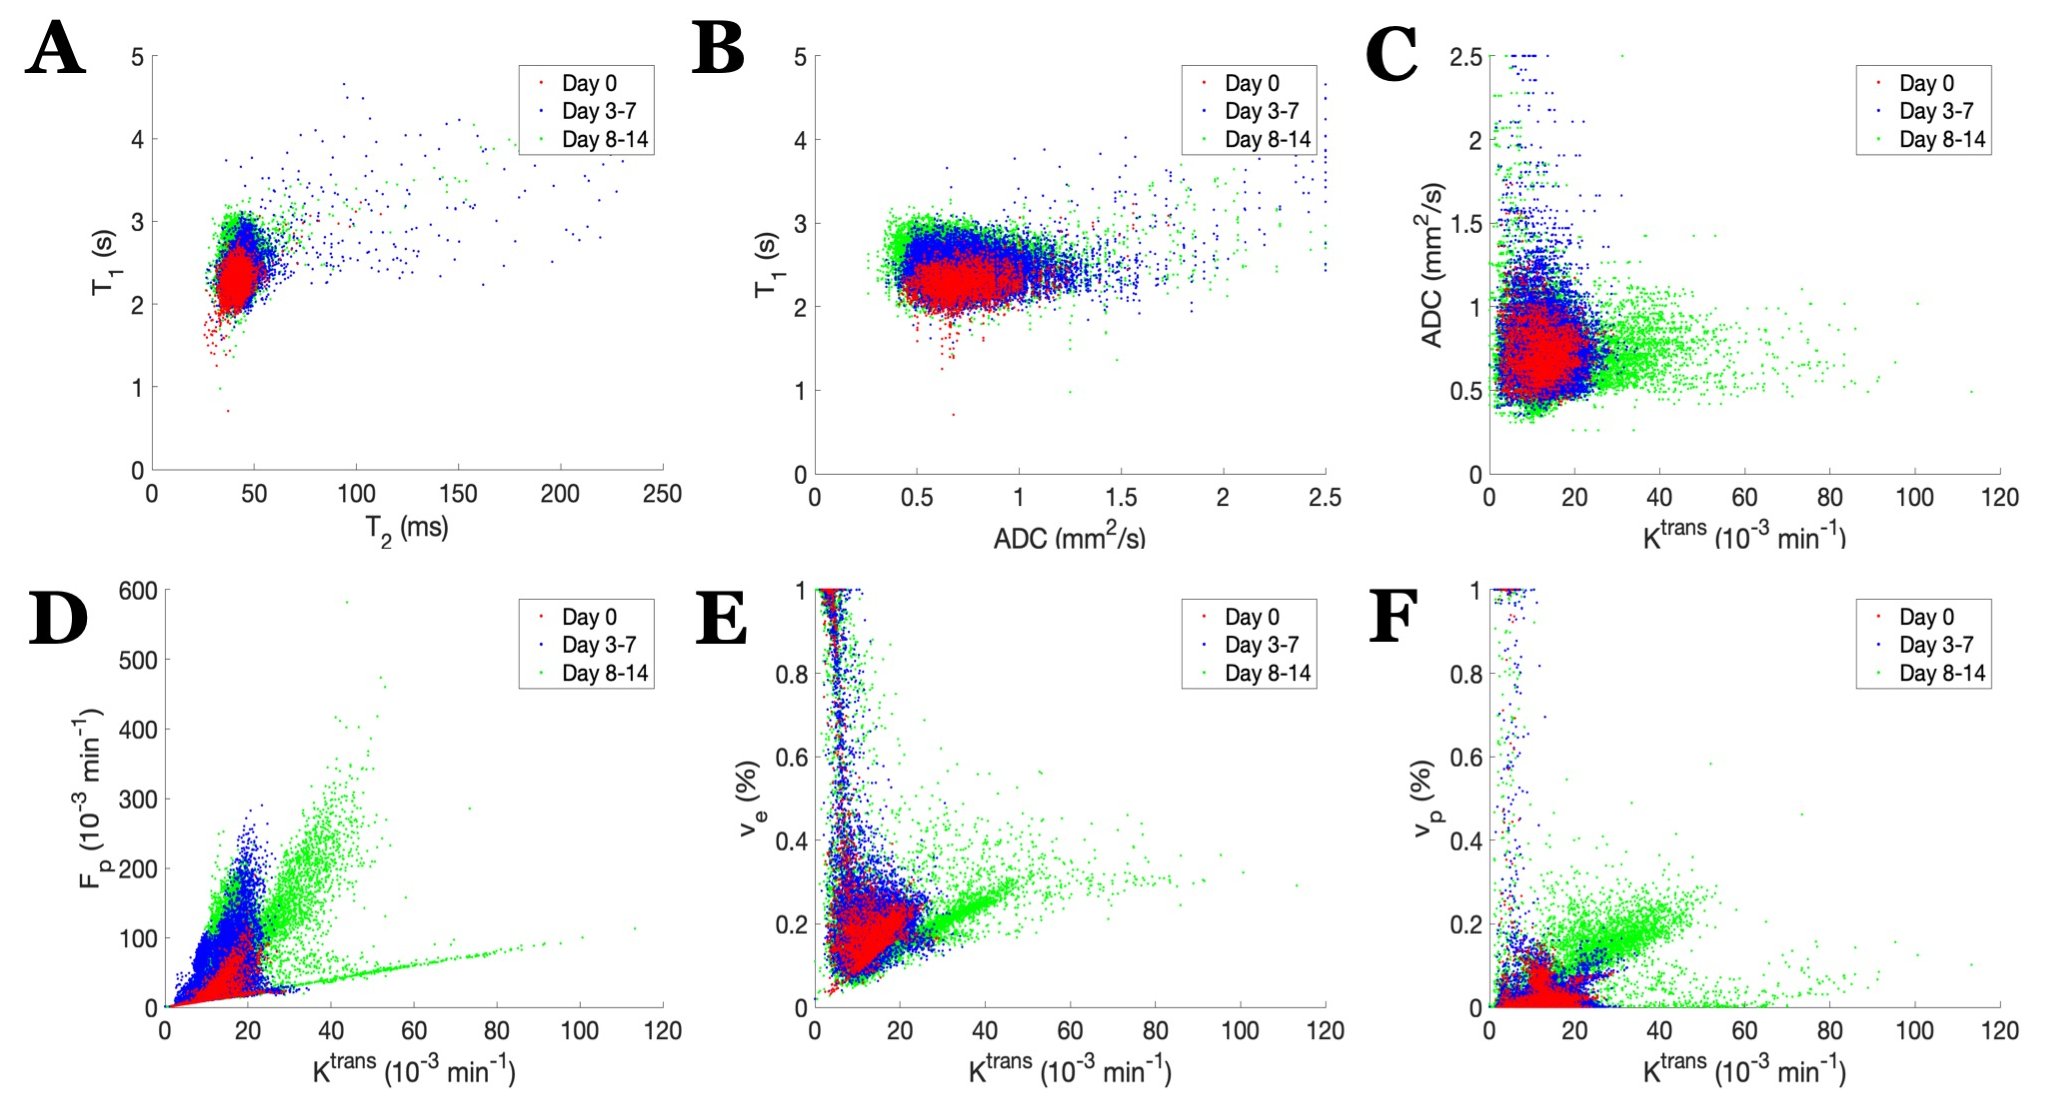
U87 tumor growth/progression, vascularity, and pHe were successfully monitored longitudinally and showed an exponential volume increase with time (Figure 1). Tumors had higher T1and T2 values compared to surrounding tissue, along with a decreased ADC, which is reflective of increased cellularity (Figure 2). Tumors displayed signal enhancement and significantly reduced T1 values within the tumor after gadobutrol infusion; however, larger tumors had higher post-contrast T1-values. There was heterogeneous dynamic uptake of gadobutrol within the tumor core as measured with DCE and reflected in the vascular parameters (Figure 2). Throughout tumor progression, T1 increased significantly (p<0.0001) and ADC trended towards lower values (Figure 3). Additionally, we detected extracellular volume reduction (p=0.088) and plasma flow increase (p=0.061), but vascular permeability as well as extracellular pH remain constant. Longitudinal pHe mapping using BIRDS revealed an acidic intratumoral microenvironment (pH 6.4-6.8) that developed early during tumor formation and remained acidic throughout tumor progression (Figure 3). Parameter distributions (Figure 4) revealed homogenous distributions of relaxation and diffusion measurements. Further, with tumor progression there is increased heterogeneity in the vascular parameters; however, there was no corresponding change in pHe distributions suggesting a homogenous and stable marker of tumor metabolic output. Although vascular permeability remained constant, there was an increase in heterogeneity such that regions with higher vascular permeability also had higher plasma volume fraction and plasma flow (Figure 5).Conclusion
Vascular and metabolic imaging provides rich information on the microenvironment during tumor progression in GBM. In addition to changing morphologic architecture and cellularity, the tumor vascular microenvironment showed a reduction in extracellular volume, increased plasma flow, and greater heterogeneity throughout tumor progression. Interestingly, despite the morphologic and vascular remodeling, metabolic output remains stable and equivalently glycolytic as evident by constant pHe, with the acidic microenvironment developing early in tumor growth. The dynamic processes regulating transformation of the tumor microenvironment suggests tumor characteristics that must be considered for targeted therapies and where the homogeneity of pHe during tumor progression may prove useful for evaluating therapeutic response in the context of heterogeneous and changing relaxation, diffusion, and vascular parameters.Acknowledgements
Supported by NIH (R01EB-011968, R01CA-140102, P30NS-052519) and Yale MSTP (T32GM-007205).References
1. Woehrer A, Bauchet L, and Barnholtz-Sloan JS. Glioblastoma survival: has it improved? Evidence from population-based studies. Curr Opin Neurol. 2014; 27:666-674.
2. Gatenby RA and Gillies RJ. Why do cancers have high aerobic glycolysis? Nature Reviews Cancer. 2004; 4:891-899.
3. Webb, BA, Chimenti M, Jacobson MP, and Barber DL. Dysregulated pH: A perfect storm for cancer progression. Nature Reviews Cancer. 2011; 11:671-677.
4. Ryken TC, Aygun N, Morris J, Schweizer M, Nair R, Spracklen C, Kalkanis SN, and Olson JJ. The role of imaging in the management of progressive glioblastoma: a systematic review and evidence-based clinical practice guideline. J Neurooncol. 2014; 118: 435-460.
5. Sourbron, SP & Buckley, DL. Classic models for dynamic contrast-enhanced MRI. NMR Biomed. 2013; 26: 1004-1027.
6. Barnes SR, Ng TSC, Santa-Maria N, Montagne A, and Zlokovic BV. Rocketship: a flexible and modular software tool for the planning, processing and analysis of dynamic MRI studies. BMC Medical Imaging. 2015; 15:19.
7. Coman, D, Trubel HK, Rycyna RE, and Hyder F. Brain temperature and pH measured by 1H chemical shift imaging of a thulium agent. NMR Biomed. 2009; 22:229-239.
8. Coman D, Huang Y, Rao JU, DeFeyter HM, Rothman DL, Juchem C, and Hyder F. Imaging the intratumoral-peritumoral extracellular pH gradient of gliomas. NMR Biomed. 2016; 29:309-319.
9. Coman D, De Graaf RA, Rothman DL, and Hyder F. In vivo three-dimensional molecular imaging with Biosensor Imaging of Redundant Deviation in Shifts (BIRDS) at high spatiotemporal resolution. NMR Biomed. 2013; 26:1589-1595.
10. Rao JU, Coman D, Walsh JJ, Ali MM, Huang Y, Hyder F. Temozolomide arrests glioma growth and normalizes intratumoral extracellular pH. Scientific Reports. 2017; 7(1):7865.
11. Huang Y, Coman D, Herman P, Rao JU, Maritim S, and Hyder F. Towards longitudinal mapping of extracellular pH in gliomas. NMR Biomed. 2016; 29(10):1364-1372.
Figures