4817
Investigating the correlation and repeatability of radiomic features derived from Apparent Diffusion Coefficient maps of Soft-Tissue Sarcoma1Division of Radiotherapy and Imaging, The Institute of Cancer Research, London, United Kingdom, 2Department of Radiology, The Royal Marsden NHS Foundation Trust, London, United Kingdom, 3Sarcoma Unit, The Royal Marsden NHS Foundation Trust, London, United Kingdom, 4Department of Pathology, The Royal Marsden NHS Foundation Trust, London, United Kingdom, 5Department of Surgery, The Royal Marsden NHS Foundation Trust, London, United Kingdom, 6Division of Molecular Pathology, The Institute of Cancer Research, London, United Kingdom
Synopsis
Soft-tissue sarcomas (STS) are highly heterogeneous and, except for myxoid liposarcomas, changes in size following radiotherapy do not correlate with outcomes or histopathological response. Therefore, conventional size-based criteria fail to accurately assess response. In this study we explore the correlation and repeatability of radiomic features derived from Apparent Diffusion-Coefficient maps in a cohort of 27 patients with confirmed STS with a variety of histopathological subtypes. 19 features were identified that had good repeatability and were considered uncorrelated using hierarchical clustering. These features could be used in future studies to investigate heterogeneous response of STS to radiotherapy.
Introduction
Soft-tissue sarcomas (STS) are highly heterogeneous tumours and conventional size-based criteria such as RECIST1.1 fail to accurately capture response1,2,3. Radiomic analysis4,5 measures a vast range of image characteristics, including spatial and textural features, and has the potential to provide a larger toolbox for assessing radiotherapy response. Identification of a subset of uncorrelated, repeatable radiomics features is a much-needed first step towards this goal. In this study, radiomic features are calculated using Apparent Diffusion-Coefficient (ADC) maps from 27 patients with STS. These features are analysed for correlation and their repeatability across 2 baseline scans is assessed.Method
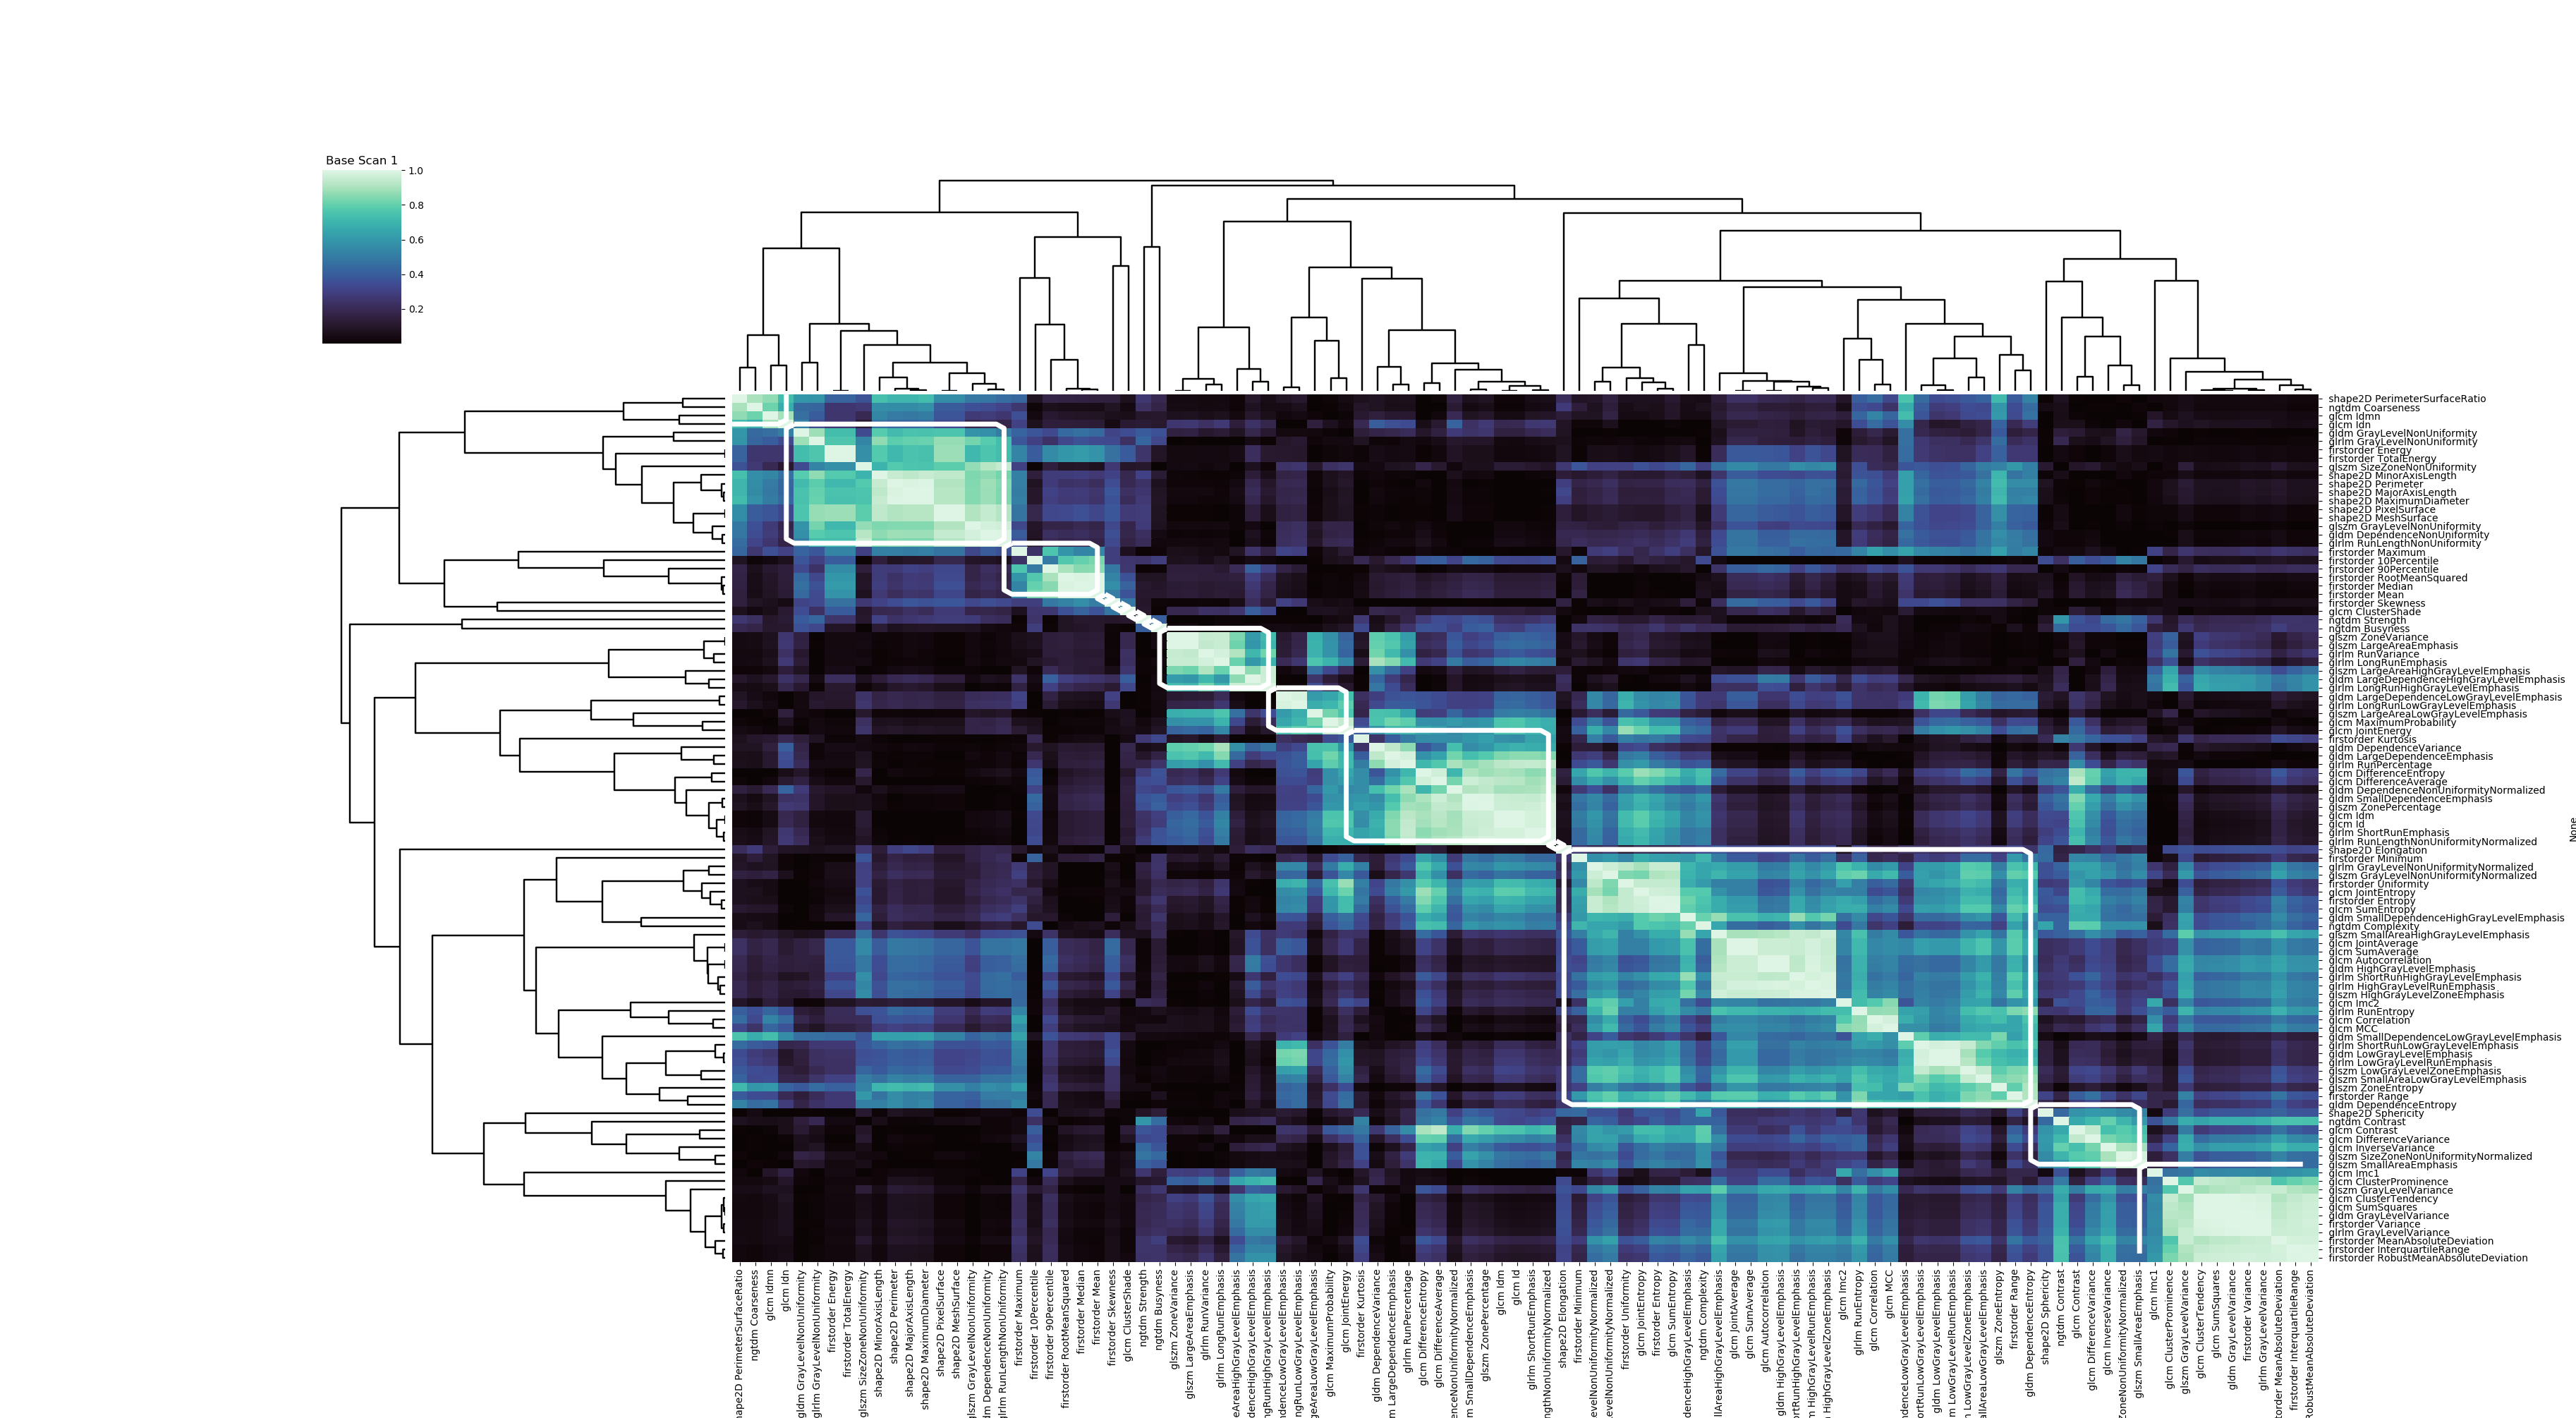
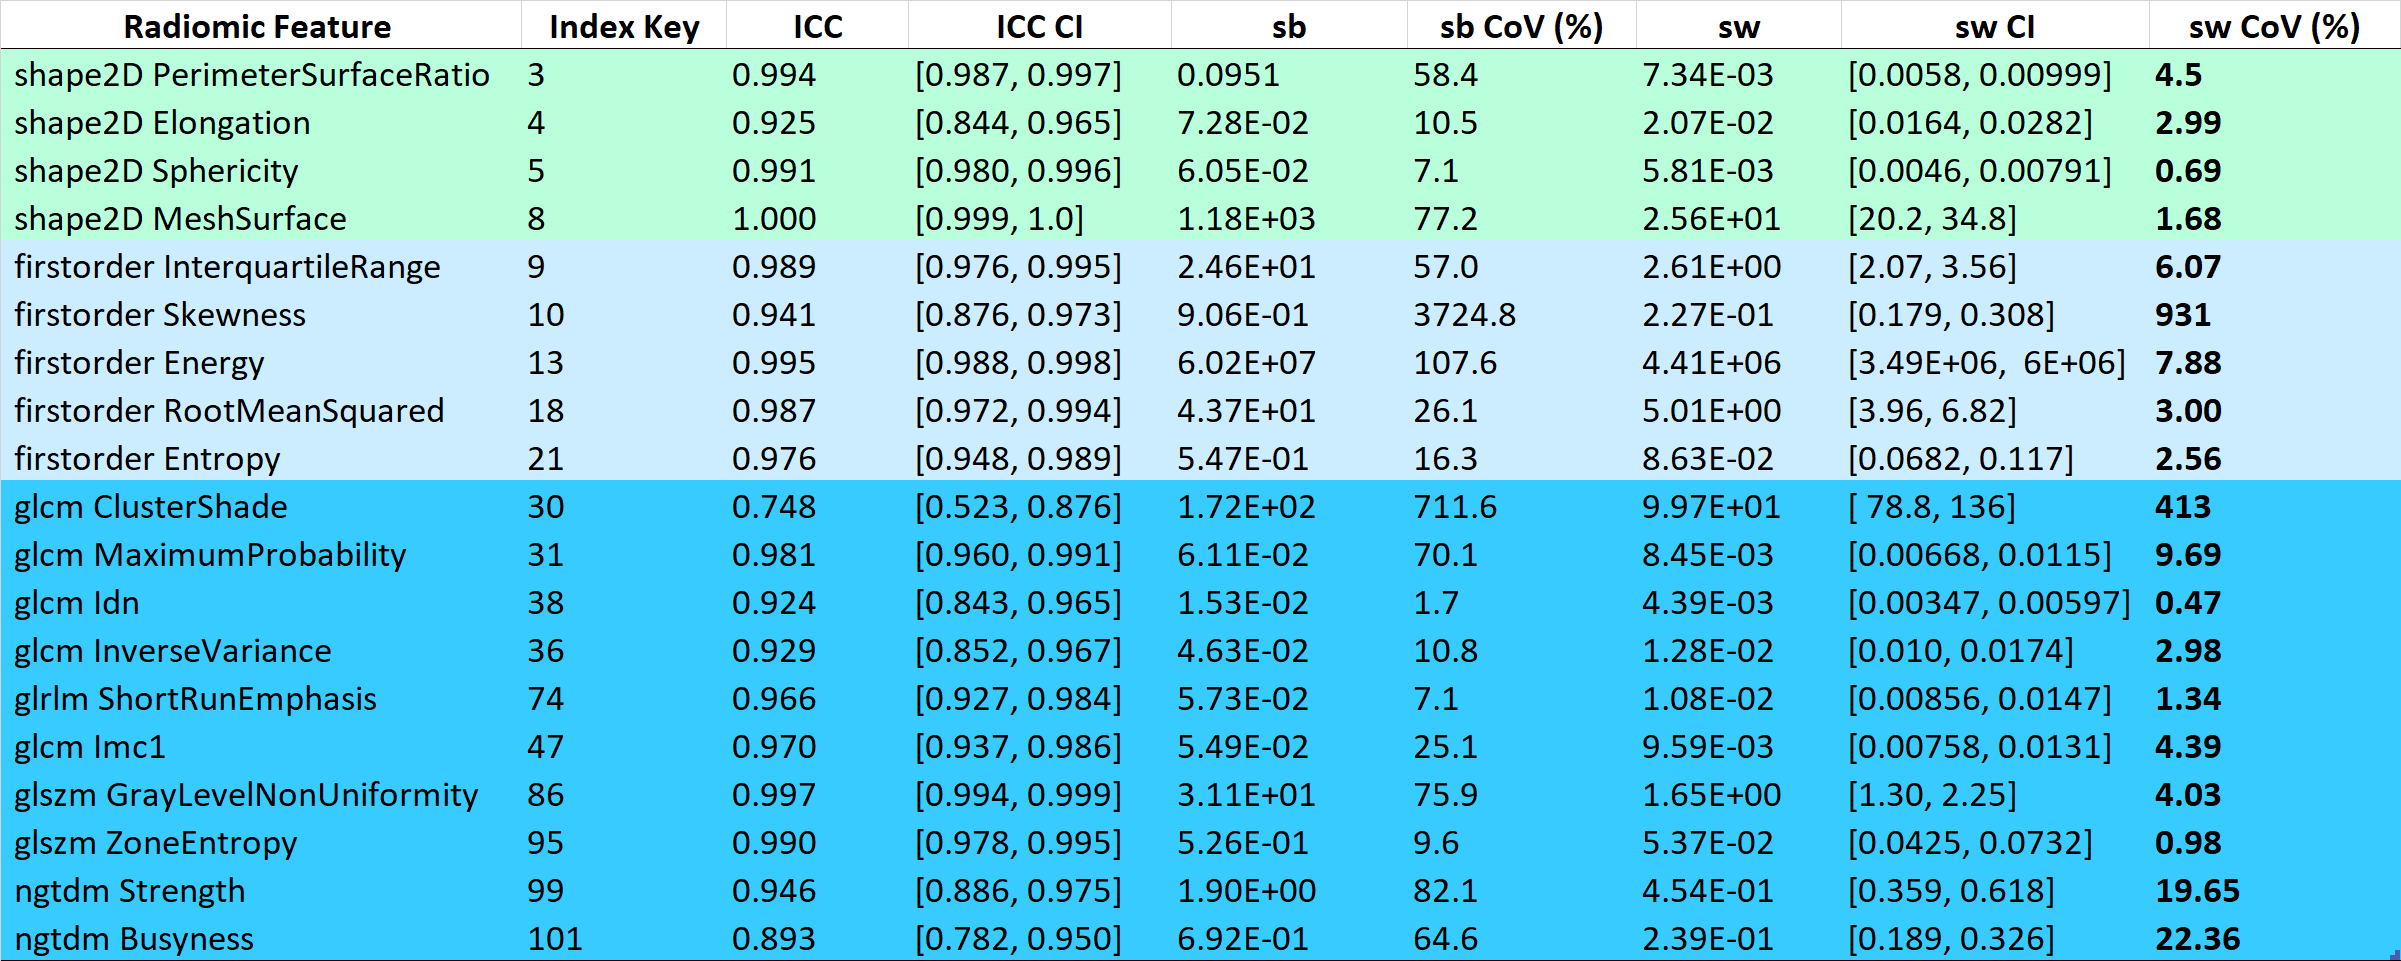
27 patients with retroperitoneal STS (20 liposarcomas, 3 leiomyosarcomas, 2 spindle-cell sarcomas, 1 synovial sarcoma, 1 pleomorphic sarcoma not-otherwise-specified) received two baseline (pre-treatment) MR examinations as part of a prospective single-centre study6 with institutional review board approval. Images were acquired using a 1.5T MR scanner (Aera, Siemens) including axial diffusion-weighted images (DWI) (b = 50,600,900 s/mm2). The second baseline acquisition was conducted after a contrast injection and short interval, after which the patient was repositioned on the scanner. Using in-house software, ADC maps were calculated using a monoexponential fit. Regions-of-interest (ROI) were drawn around the whole tumour on every slice in which the tumour appeared on T2-weighted images by a single radiologist and transferred to the ADC maps. For 25/27 patients the same number of imaging slices were acquired at both baseline scans to cover the tumour volume. In 2 patients only the central section of the tumour was examined during the second baseline scan. A sub-set of contiguous slices from the first examination were selected visually using HOROS7 software to match the slices acquired from the second examination; these slices were used for further analysis. The ADC estimates for each ROI were extracted and clipped to the range [0, 300x10-5 mm2/s]. Using the pyradiomics8 toolbox, each slice was gray-level discretized with a fixed bin width = 10x10-5 mm2/s. A total of 102 radiomic features were calculated for each slice (9 shape, 18 first order and 75 second order/textural features). The mean of each 2D radiomic feature was taken across all slices from each patient for each baseline scan to produce the final feature (this approach was used due to the large anisotropy in voxel resolution in the DWI protocol in the slice direction: 2.6x2.6x5mm3). Using the first baseline features a correlation heatmap between features was derived. Hierarchical agglomerative clustering was performed to identify clusters with a group Pearson correlation coefficient r2>0.5. For each feature, the within-patient standard deviation (sw) and between-patient standard deviation (sb) were calculated. Intra-class correlation (ICC) coefficient values were computed as $$$ICC=\frac{s_b^2}{s_b^2+s_w^2}$$$.Coefficients of variation (CoV) were calculated for each standard deviation (sw-CoV and sb-CoV) by dividing by the overall feature mean.
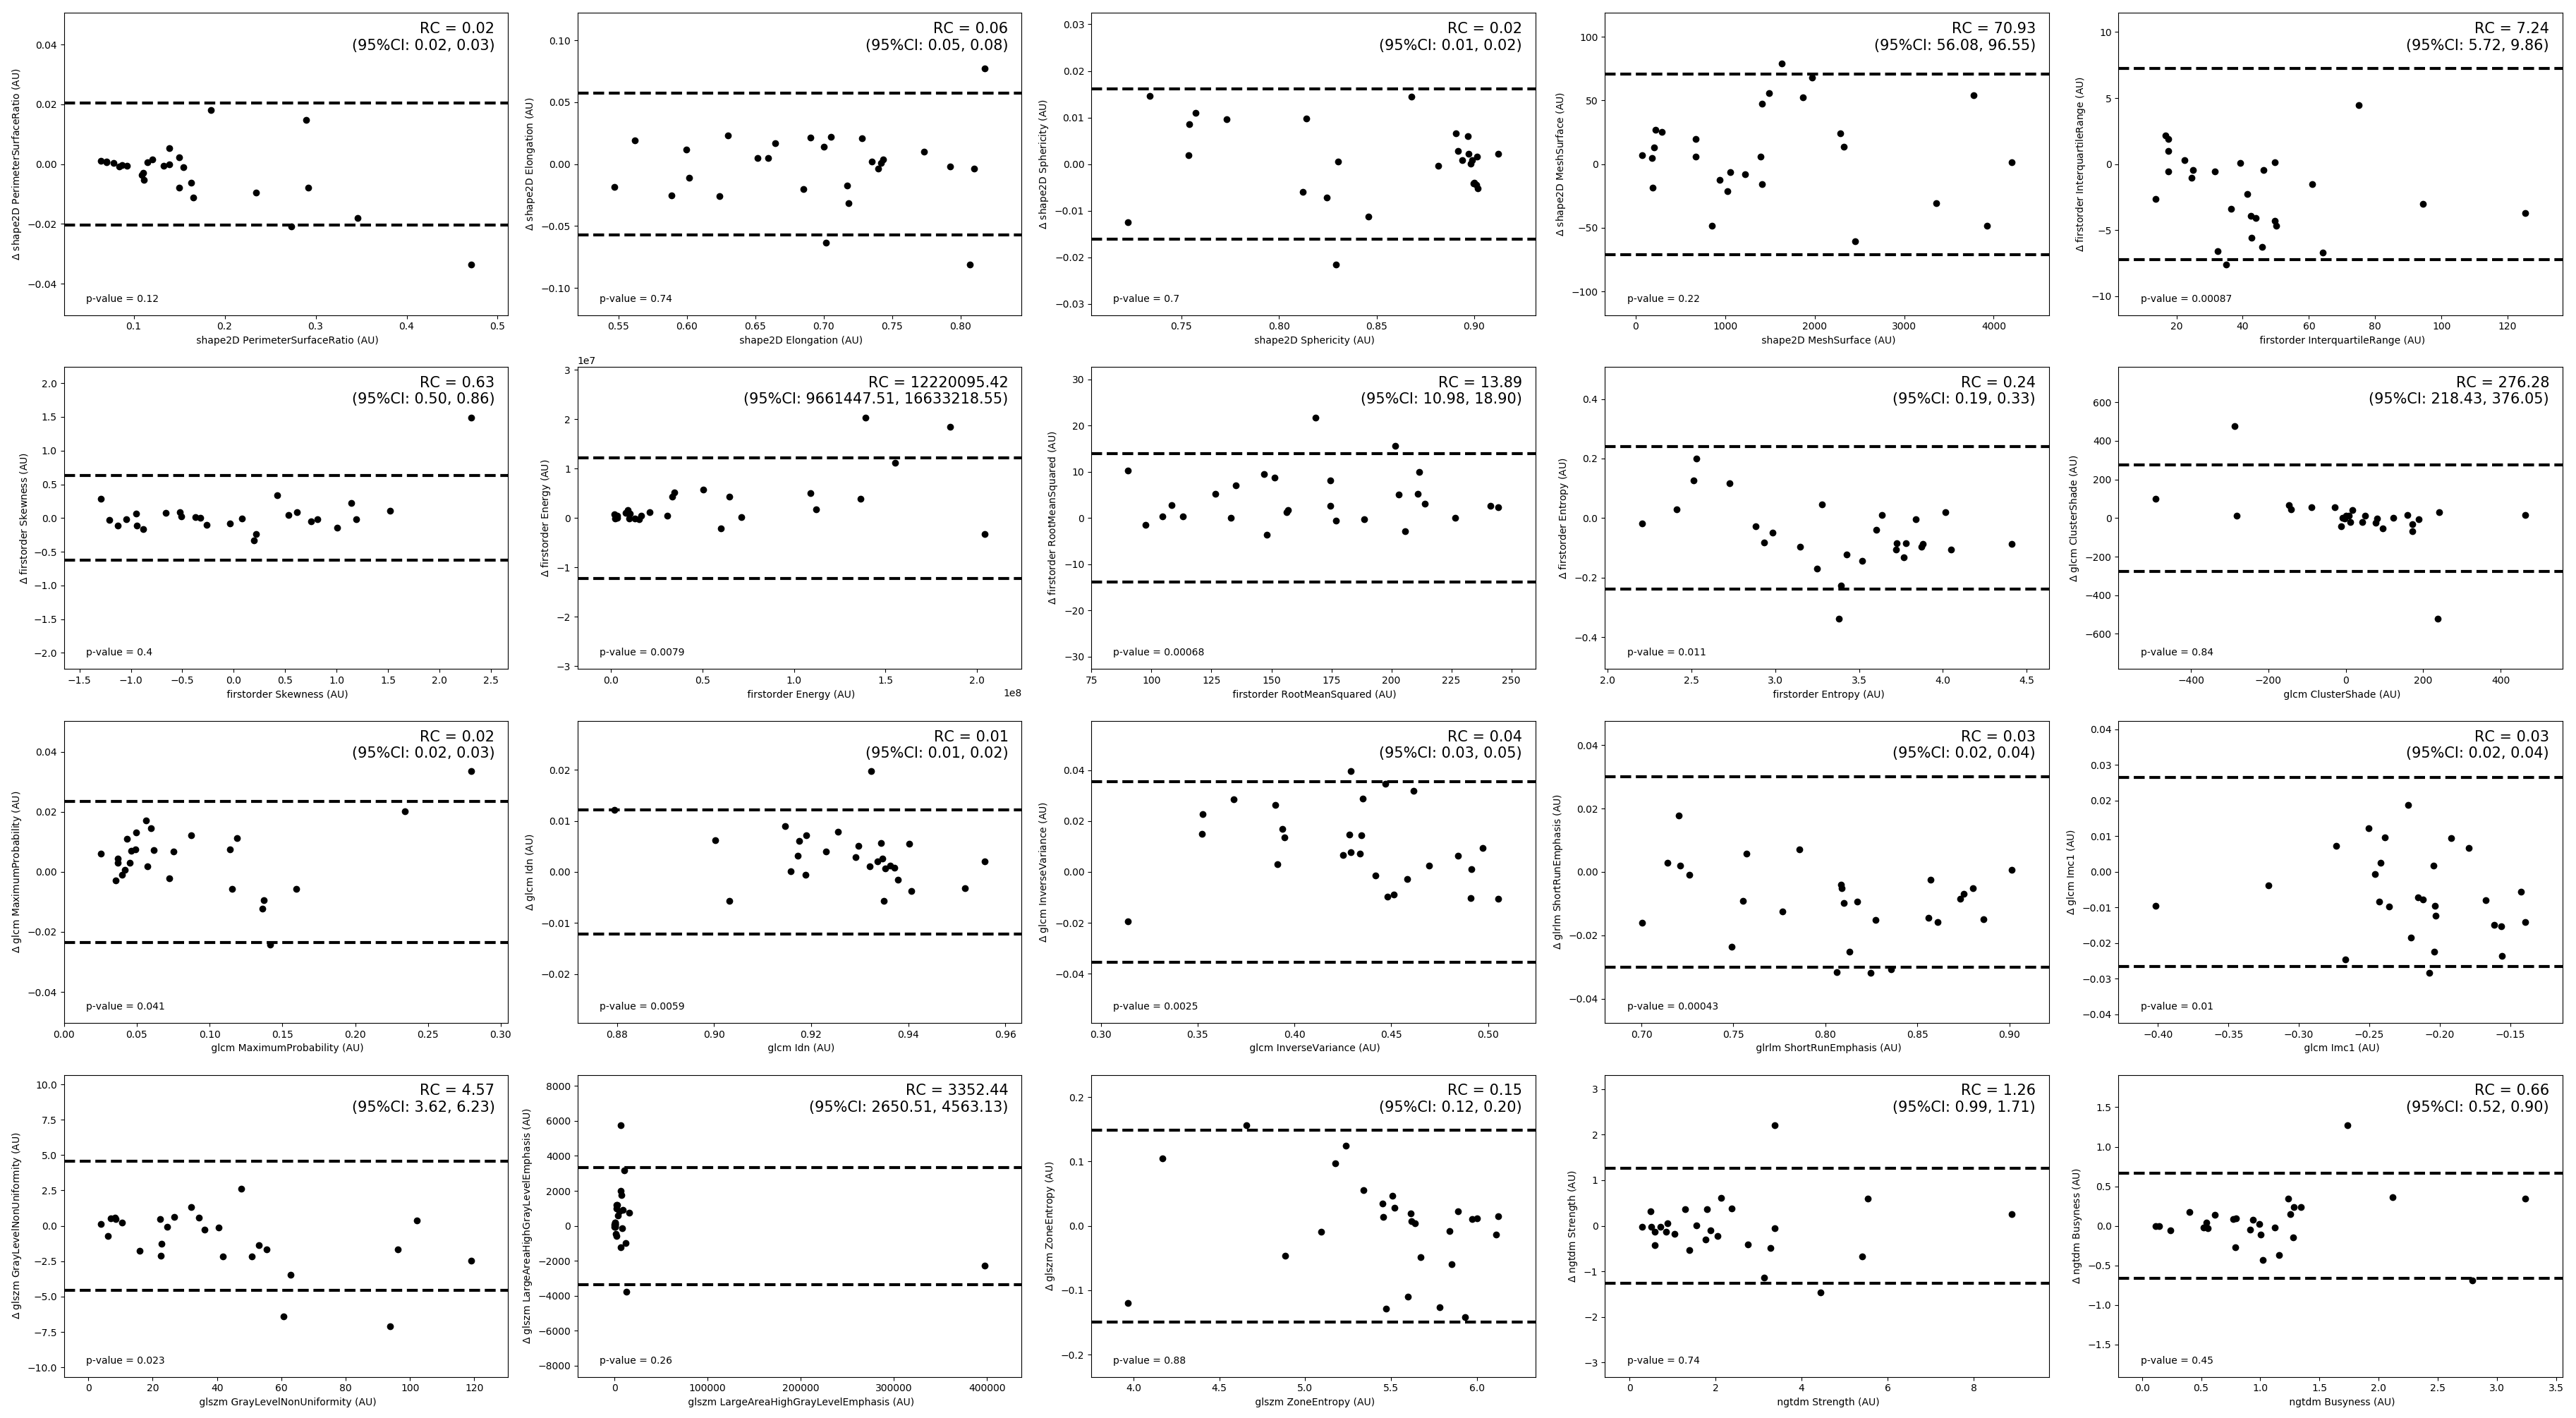
The sw and sb were used to select a subset of uncorrelated radiomic features. For the clusters with more than one radiomic feature: the minimum sw-CoV was identified and a group of features formed whose sw-CoV’s fell within 1% of the minimum value; the value from this group with the greatest sb-CoV was then selected. If the cluster contained more than one type of radiomic feature (for e.g. textural and first order) then one feature was selected for each type in the cluster. For the clusters that contained single features, the single feature was automatically selected. Bland-Altman plots9,10 were derived for the selected features.
Results
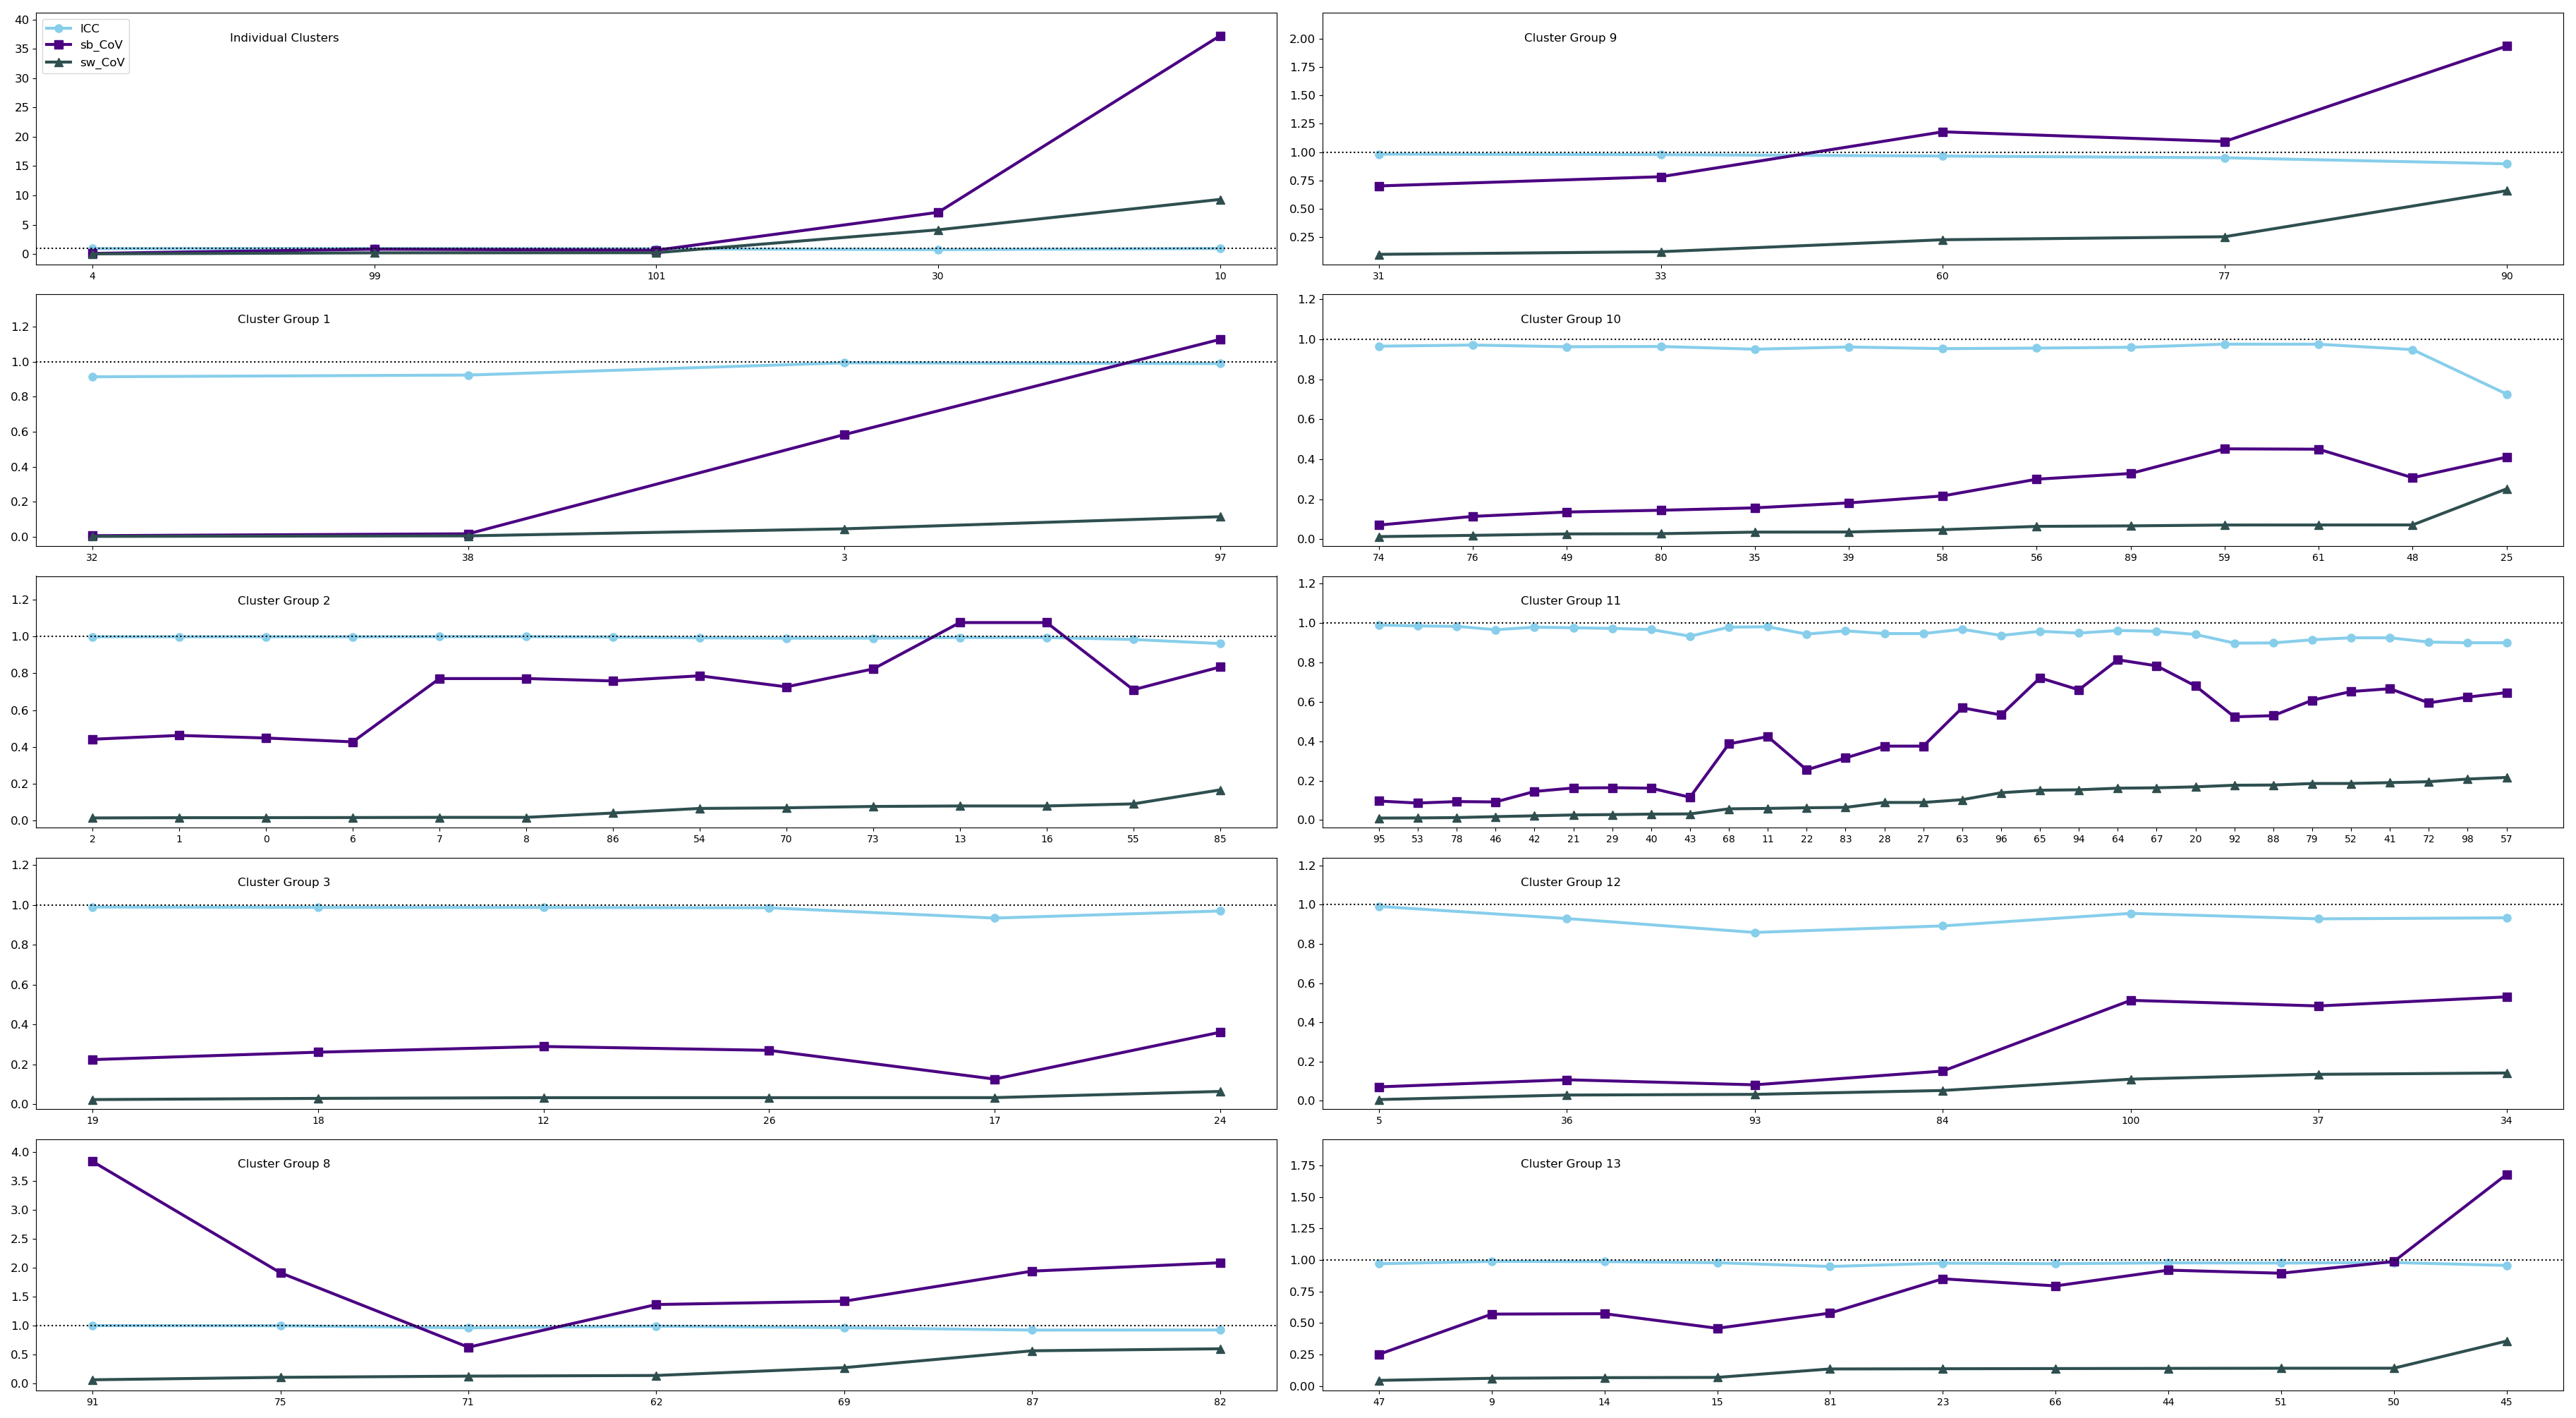
Clustering revealed 14 uncorrelated clusters (Figure 1), with 5 involving only a single feature.For each cluster, and each of the 5 single features, the ICC, sb-CoV and sw-CoV were plotted (Figure 2).
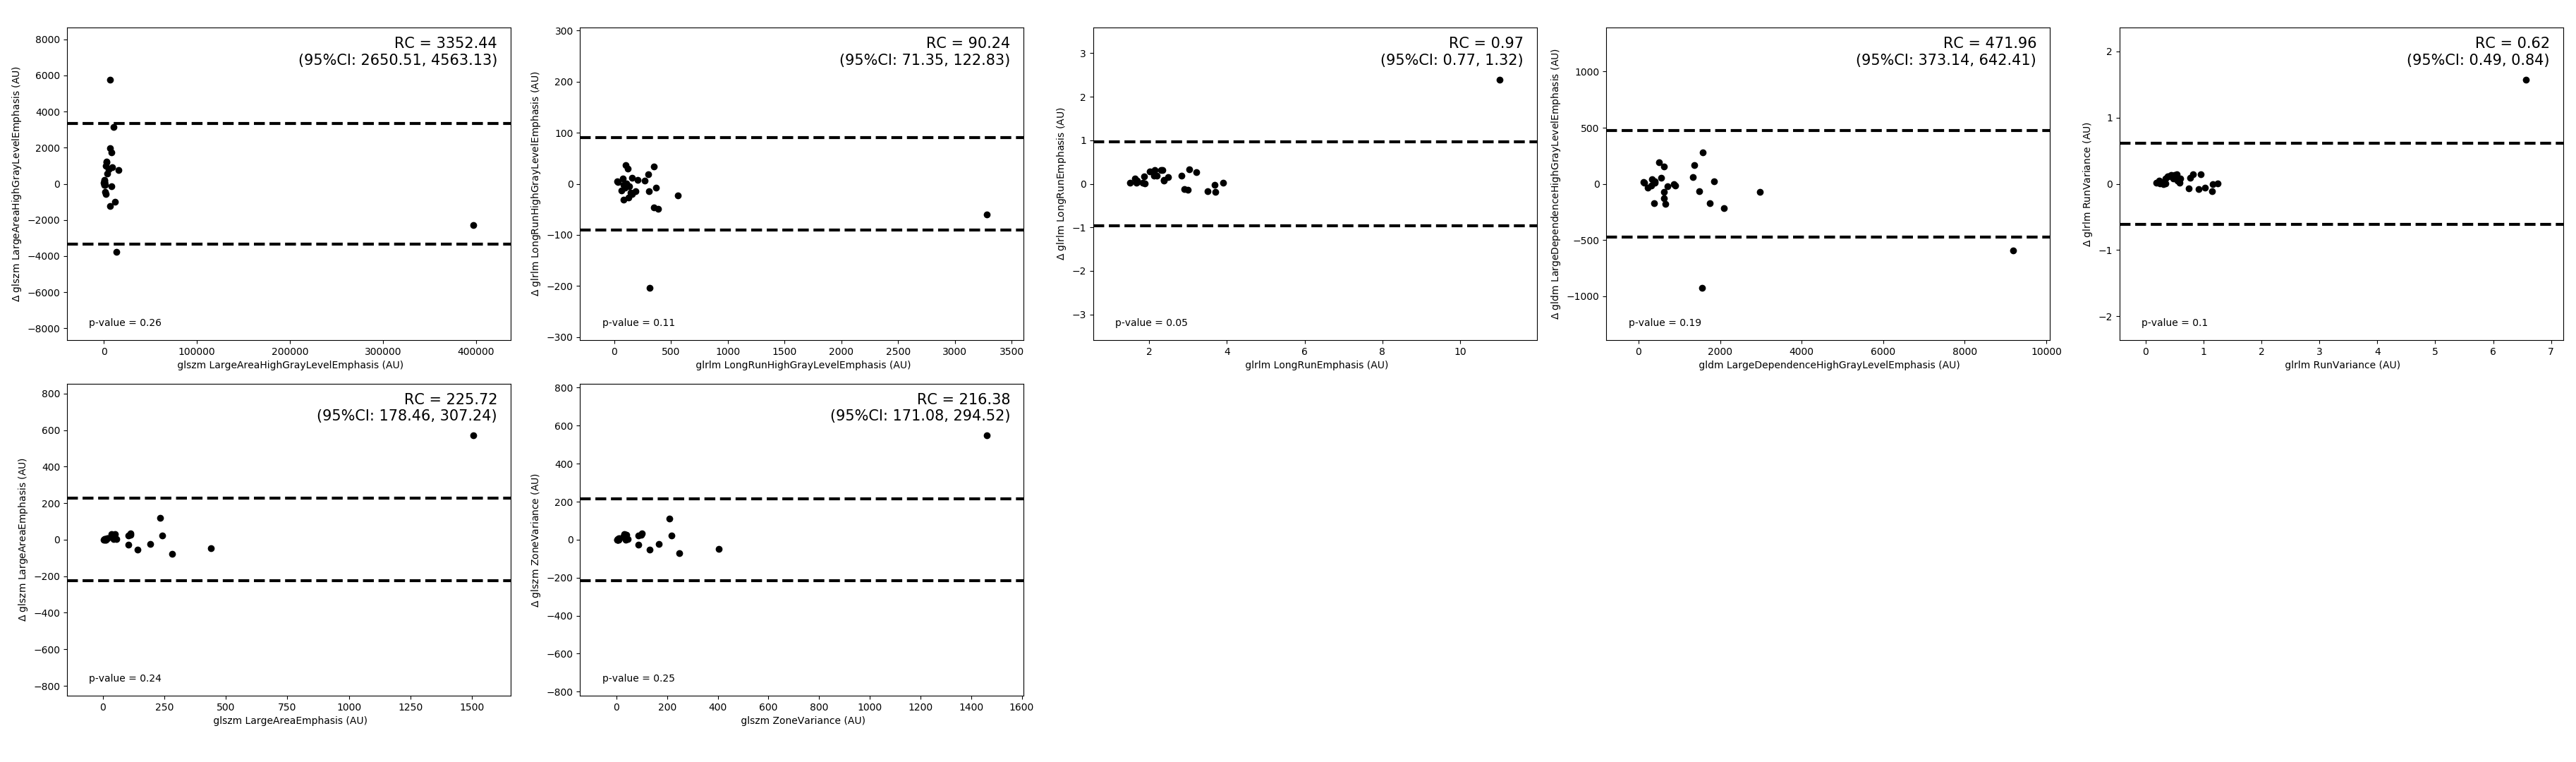
A total of 20 features were identified using the selection criteria above; Bland-Altman plots of these features (Figure 3) reveal that a particular cluster is influenced by a potential outlier. The Bland-Altman plots (Figure 4) for all features within this cluster demonstrate a similar pattern, suggesting that this group of correlated features is sensitive to patient outliers. This feature was removed from the selection leading to a final set of 19 features (Figure 5).
Discussion and Conclusions
This study identified a subset of 19 radiomic features from ADC maps of STS with good repeatability across 2 baseline scans. The subset-selection criteria described were designed to maximise the applicability of the features to track tumour changes: features that have a low sw-CoV and a large dynamic range (large sb-CoV) are thought to have good repeatability while allowing for the feature value to vary with tumour variation. Features with both a low sb-CoV and sw-CoV may have good repeatability but may be confined to a small dynamic range.It is worthwhile to note that the Bland-Altman analysis demonstrated a weak bias for some of the selected features. This bias may be attributable to contrast injection between baseline scans, though previous authors have not detected significant change in ADC following gadolinium chelate injection in healthy organs11. Future work will investigate the origin of this bias and methods for removing the bias including gray-level normalization techniques.
Investigating change in features post-treatment may provide a quantitative measure of the suitability of using radiomics to track STS radiotherapy response, resulting in better guided treatment plans and quicker identification of tumour resistance.
Acknowledgements
We acknowledge CRUK and EPSRC support to the Cancer Imaging Centre at ICR and RMH in association with MRC and Department of Health C1060/A10334, C1060/A16464 and NHS funding to the NIHR Biomedical Research Centre and the NIHR Royal Marsden Clinical Research Facility. This report is independent research funded by the National Institute for Health Research. The views expressed in this publication are those of the author(s) and not necessarily those of the NHS, the National Institute for Health Research or the Department of Health. Also support from The David and Ruth Lewis Family Charitable Trust.References
1. Canter R, Martinez S, Tamurian R, et al. Radiographic and histologic response to neoadjuvant radiotherapy in patients with soft tissue sarcoma. Ann Surg Oncol. 2010;17:2578-2584.
2. Roberge D, Skamene T, Nahal A, et al. Radiological and pathological response following pre-operative radiotherapy for soft tissue sarcoma. Radiother Oncol. 2010;97:404-407.
3. Messiou C, Bonvalot S, Gronchi A, et al. Evaluation of response after pre-operative radiotherapy in soft tissue sarcomas; The European Organisation for Research and Treatment of Cancer - Soft Tissue and Bone Sarcoma Group (EORTC - STBSG) and Imaging Group recommendations for radiological examination and reporting with an emphasis on magnetic resonance imaging. Eur J Cancer. 2016;56:37-44.
4. Aerts H, E R Velazquez, R Leijenaar et al. Decoding tumour phenotype by noninvasive imaging using a quantitative radiomics approach. Nat. Commun. 2014;5:4006.
5. Lerski RA, Straughan K, Schad LR et al. MR image texture analysis--an approach to tissue characterization. Magn Reson Imaging. 1993;11(6):873-887.
6. Winfield JM, Miah AB, Strauss D, et al. Utility of Multi-Parametric Quantitative Magnetic Resonance Imaging for Characterization and Radiotherapy Response Assessment in Soft-Tissue Sarcomas and Correlation With Histopathology. Front. Oncol. 2019;9:280.
7. https://horosproject.org/
8. van Griethuysen J, Fedorov A, Parmar C, et al. Computational Radiomics System to Decode the Radiographic Phenotype. Cancer Res. 2017;77(21):e104–e107.
9. Bland J and Altman D. Statistical methods for assessing agreement between two methods of clinical measurement. Lancet. 1986;8476:307–310.
10. Bland J and Altman D. Measuring agreement in method comparison studies. Stat Methods Med Res. 1999;8:135–160.
11. Wang CL, Chea YW, Boll DT et al. Effect of gadolinium chelate contrast agents on diffusion weighted MR imaging of the liver, spleen, pancreas and kidney at 3 T. Eur J Radiol 2011;80(2):e1-e7.
Figures