4815
Effect of hypoxia and choline kinase inhibitor on choline metabolism of brain tumour cells using high resolution ¹H NMR1Center for Preclinical Imaging, University of Liverpool, Liverpool, United Kingdom, 2Department of Radiology, University of Pennsylvania, Philadelphia, PA, United States, 3Institute of Integrative Biology, University of Liverpool, Liverpool, United Kingdom
Synopsis
High resolution ¹H NMR of cell extracts was used to assess the effects of hypoxia on choline metabolism in four glioblastoma (GBM) cell lines (9L, F98, U87 and U251). In addition, the effects of hypoxia on the efficacy of JAS239, a choline kinase alpha (ChoKα) inhibitor, was also assessed in these cell lines. Hypoxic preconditioning resulted in a decrease in phosphocholine (PC) in 9L, F98 and U251 cells. JAS239 significantly decreased PC/glycerophosphocholine (GPC) ratio in the hypoxic 9L and U251 cells compared to when these cells were grown in normoxic conditions.
Introduction
Oxygen is essential for cellular homeostasis, and when oxygen levels drop below physiological levels (hypoxic conditions), cellular dysregulation occurs.1 Hypoxia is a hallmark of Glioblastoma (GBM) and is responsible for its highly aggressive and invasive phenotype, along with chemo and radiotherapy resistance.2,3 Tumour cells respond and adapt to hypoxia via the hypoxia transcription factor HIF-1α, which regulates over 100 genes involved in cell survival pathways such as angiogenesis, proliferation and cell metabolism.4 Choline kinase alpha (ChoKa) has been shown to be regulated by HIF1α and is typically over-expressed under hypoxic conditions.5,6 ChoKα phosphorylates choline to phosphocholine (PC), the first committed step in the production of the cell membrane phospholipid, phosphatidylcholine (PtdCho).7 Inhibition of ChoKa has been shown to have therapeutic effects, however, the relationship of choline metabolism to hypoxia and its impact on ChoK inhibitors has not been reported.Methods
Cell CultureTwo rat GBM lines (F98, 9L) and two human GBM lines (U87, U251) were cultured in DMEM or MEM (+10% FBS). For preconditioning, cells were incubated for 3 days in either 21% O₂ (normoxia) or 1% O₂ (hypoxia) in a hypoxic workstation (Don Whitley, UK). Cells were treated with 10μM JAS239/0.1% DMSO or 0.1% DMSO control and incubated for 4 hours before harvesting.
Sample Preparation
Cells were harvested and metabolites extracted using Acetonitrile:water solution, sonication and freeze dried overnight and stored -80°C. Immediately prior to data acquisition, 200μl of a solution comprising of 89.8% ²H₂0, 10% (v/v) 100mM sodium phosphate (pH 7.4), 0.1% (v/v) 100μM deuterated trimethyl silyl propionate (TSP) and 0.1% (v/v) 12 mM sodium azide, were added.
Acquisition
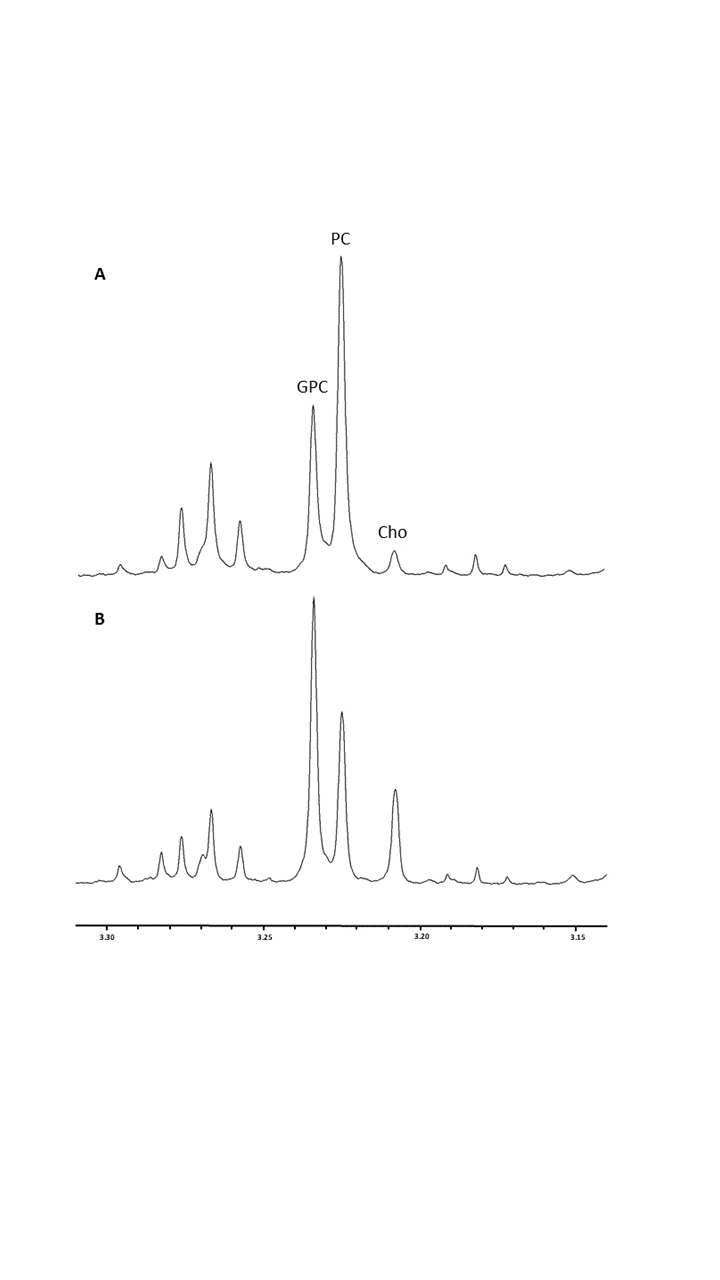
1D ¹H NMR spectra were acquired on a Bruker Avance III HD 700MHz spectrometer. 1D ¹H standard spectra were acquired via a Carr-Purcell-Meiboom-Gill (CPMG) sequence with 256 transients, 15 ppm spectral width, 32K points, 9.6ms echo time and a 3.1s acquisition time.
Spectral Processing
Initial processing and quality control of each spectrum were carried out in Topspin v3.2. Chenomx v8.2 software was used for metabolite identification. The spectra were normalised to the total signal intensity of each sample and bucketed per peak into metabolite specific intensities using AMIX v3.9.14 and an established metabolite pattern file.8 Statistical analysis was carried out using Graph Pad Prism software v6.
Results
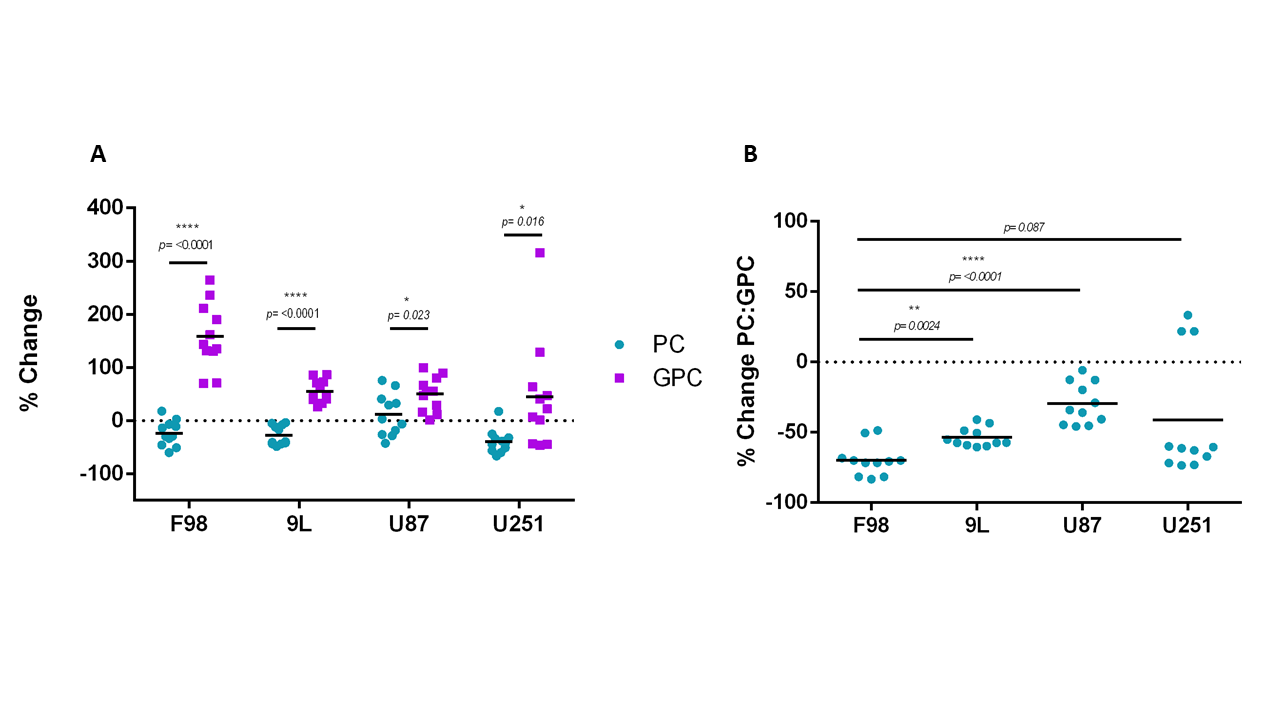
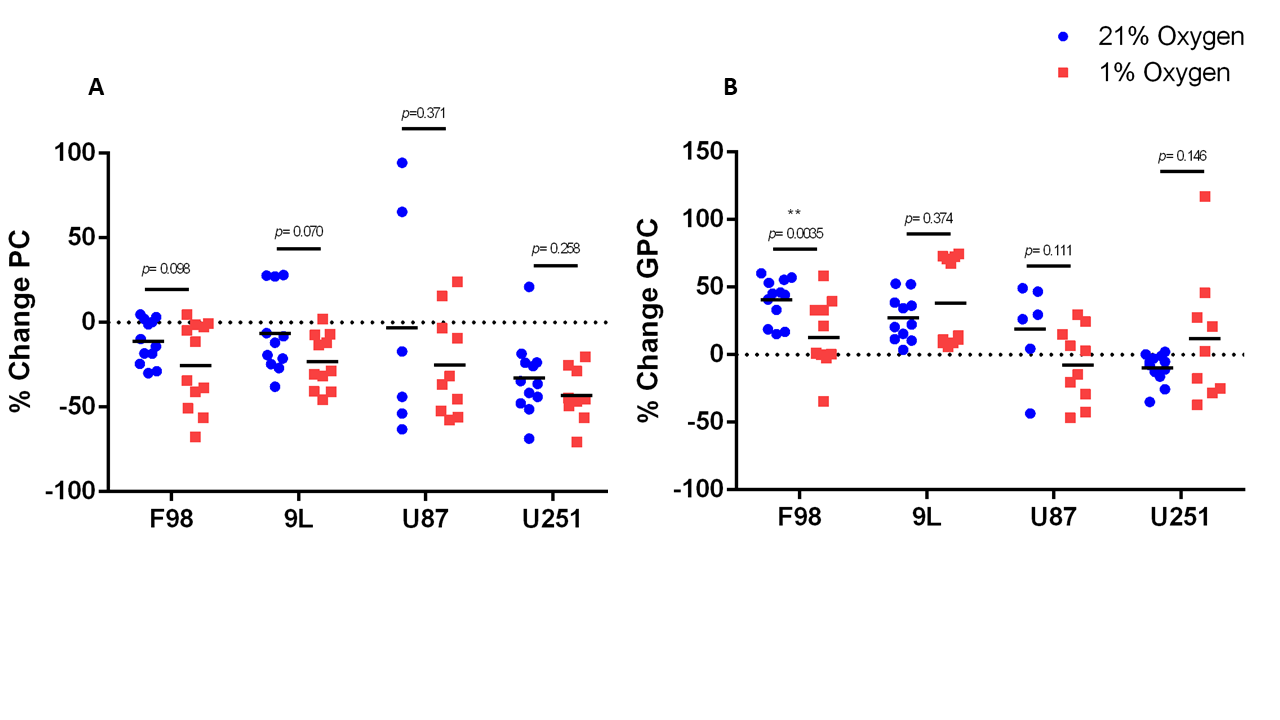
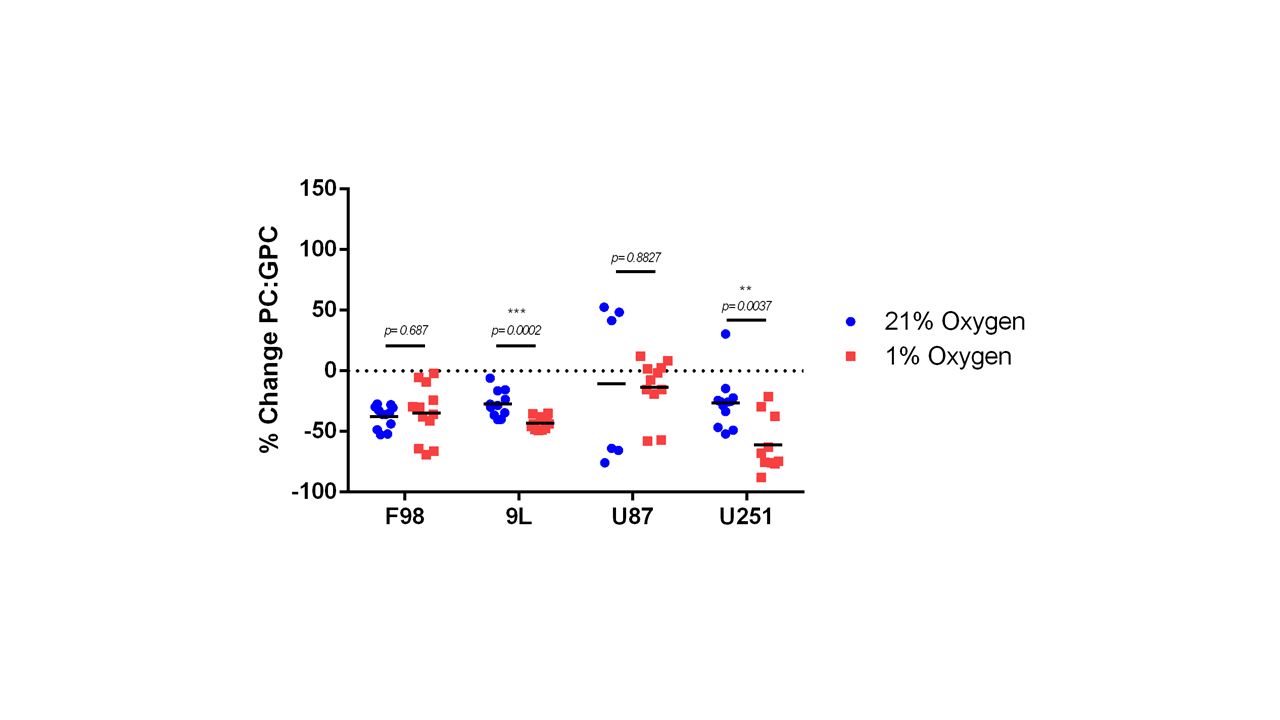
The % change in PC and GPC from all spectra (figure 1) were calculated between normoxic and hypoxic conditions for all four cell lines (figure 2a). In hypoxic conditions, GPC was significantly increased in all cell lines whereas PC decreased in F98 & 9L (p=<0.0001) and U87 (p=0.023), U251 (p=0.016), with rat GBM lines demonstrating a more pronounced change than the human lines. The % change in PC:GPC ratio was also calculated (figure 2b), elevated ratios of which have been proposed to be a marker of tumour progression, 9,10,11 while reduced PC:GPC ratios indicate a reduction in PC levels in response to environmental cues or drug treatment.12,13 Figure 2b shows F98 cells with the largest reduction in PC:GPC due to hypoxic incubation, compared to 9L (p=<0.0001) and U87 cells (p=0.0024). The efficacy of JAS239, a ChoK inhibitor, on these cells was then compared in hypoxic and normoxic conditions. JAS239 treatment led to a change in PC and GPC under both conditions (figure 3) whereby PC levels reduced (figure 3a) and GPC levels increased across all cell lines (figure 3b). Interestingly, the effect of JAS239 on PC and GPC levels was more pronounced in hypoxic conditions than normoxic conditions in 9L (p=0.0002) and U25 (p=0.0037) cell lines compared to F98 (p=0.687) and U87 (p=0.882) cell lines (figure 4).Discussion
Abnormal choline metabolism is a hallmark of cancer and the pathways involved in the synthesis of cell membrane phospholipids are well characterised.6,7 However, the regulation of such pathways in response to the microenvironment changes, such as hypoxia is under-studied. Hypoxic conditions develop within tumours due to the increasing diffusion distance between cancer cells and the nearest blood vessel.14 Tumour cells adapt to this environment through HIF1α, which has been shown to regulate the expression and activity of ChoKα.6 We observed decreased PC levels in response to hypoxia in F98, 9L and U251 GBM lines. U87 cells showed a slight increase in PC, but with increased variability. Interestingly, a previous study reported the opposite effect in a prostate cancer cell line where a significant increase in PC was reported under hypoxic conditions.6 The differences reported may be due to the shorter exposure to hypoxia, 24 hours compared to three days in our experiment. It has been shown that prolonged exposure to acute hypoxia can induce proliferative arrest via HIF1α mediated upregulation of p21, therefore indirectly reducing the cell’s requirement for membrane synthesis. However, some cancer types can maintain proliferation via mTOR or Notch pathways through acute hypoxia.15,16 Interestingly more pronounced effects on choline metabolism due to JAS239, was observed in hypoxia in the less aggressive GBM lines, 9L and U251. This could be due to both lines expressing mutated tumour suppressor p53, increasing genomic instability and increased apoptosis compared to U87 and F98 which express wild type p53.17,18 F98 and U87 are also widely reported to be aggressive and generally resistant GBM lines compared to 9L and U251.17,18Acknowledgements
All NMR data was acquired using the NMR metabolomics facility at the University of Liverpool.References
1. Koh, M. Y., Spivak-Kroizman, T. R., & Powis, G. (2008). HIF-1 regulation: not so easy come, easy go. Trends in Biochemical Sciences, 33(11), 526–534. https://doi.org/10.1016/j.tibs.2008.08.002
2. Fidoamore, A., Cristiano, L., Antonosante, A., D’Angelo, M., Di Giacomo, E., Astarita, C., … Cimini, A. (2016). Glioblastoma Stem Cells Microenvironment: The Paracrine Roles of the Niche in Drug and Radioresistance. Stem Cells International, 2016. https://doi.org/10.1155/2016/6809105
3. Jawhari, S., Ratinaud, M. H., & Verdier, M. (2016). Glioblastoma, hypoxia and autophagy: A survival-prone “ménage-à-trois.” Cell Death and Disease. https://doi.org/10.1038/cddis.2016.318
4. Masoud, G. N., & Li, W. (2015). HIF-1α pathway: Role, regulation and intervention for cancer therapy. Acta Pharmaceutica Sinica B. https://doi.org/10.1016/j.apsb.2015.05.007
5. Bansal, A., Harris, R. A., & DeGrado, T. R. (2012). Choline phosphorylation and regulation of transcription of choline kinase α in hypoxia. Journal of Lipid Research, 53(1), 149–157. https://doi.org/10.1194/jlr.M021030
6. Glunde, K., Shah, T., Winnard, P. T., Raman, V., Takagi, T., Vesuna, F., … Bhujwalla, Z. M. (2008). Hypoxia regulates choline kinase expression through hypoxia-inducible factor-1α signaling in a human prostate cancer model. Cancer Research, 68(1), 172–180. https://doi.org/10.1158/0008-5472.CAN-07-2678
7. Arlauckas, S. P., Popov, A. V., & Delikatny, E. J. (2016). Choline kinase alpha - Putting the ChoK-hold on tumor metabolism. Progress in Lipid Research, 63, 28–40. https://doi.org/10.1016/j.plipres.2016.03.005
8. Al-Mutawa, Y. K., Herrmann, A., Corbishley, C., Losty, P. D., Phelan, M., & Sée, V. (2018). Effects of hypoxic preconditioning on neuroblastoma tumour oxygenation and metabolic signature in a chick embryo model. Bioscience Reports, 38(4), 1–15. https://doi.org/10.1042/BSR20180185
9. Adam Moser, Kevin Range, and D. M. Y. (2014). Silencing of the glycerophosphocholine phosphodiesterase GDPD5 alters the phospholipid metabolite profile in a breast cancer model in vivo as monitored by 31 P Magnetic Resonance Spectroscopy. NMR in Biomedicine, 26(6), 692–699. https://doi.org/10.1038/jid.2014.371
10. Moestue, S. A., Borgan, E., Huuse, E. M., Lindholm, E. M., Sitter, B., Børresen-Dale, A. L., … Gribbestad, I. S. (2010). Distinct choline metabolic profiles are associated with differences in gene expression for basal-like and luminal-like breast cancer xenograft models. BMC Cancer, 10(August). https://doi.org/10.1186/1471-2407-10-433
11. Stewart, J. D., Marchan, R., Lesjak, M. S., Lambert, J., Hergenroeder, R., Ellis, J. K., … Hengstler, J. G. (2012). Choline-releasing glycerophosphodiesterase EDI3 drives tumor cell migration and metastasis. Proceedings of the National Academy of Sciences of the United States of America, 109(21), 8155–8160. https://doi.org/10.1073/pnas.1117654109
12. Aboagye, E. O., & Bhujwalla, Z. M. (1999). Malignant transformation alters membrane choline phospholipid metabolism of human mammary epithelial cells. Cancer Research, 59(1), 80–84.
13. Kumar, M., Arlauckas, S. P., Saksena, S., Verma, G., Ittyerah, R., Pickup, S., … Poptani, H. (2015). Magnetic Resonance Spectroscopy for Detection of Choline Kinase Inhibition in the Treatment of Brain Tumors. Molecular Cancer Therapeutics, 14(4), 899–908. https://doi.org/10.1158/1535-7163.MCT-14-0775
14. Ortmann, B., Druker, J., & Rocha, S. (2014). Cell cycle progression in response to oxygen levels. Cellular and Molecular Life Sciences, 71(18), 3569–3582. https://doi.org/10.1007/s00018-014-1645-9
15. Seim, J., Graff, P., Åmellem, Landsverk, K. S., Stokke, T., & Pettersen, E. O. (2003). Hypoxia-induced irreversible S-phase arrest involves down-regulation of cyclin A. Cell Proliferation, 36(6), 321–332. https://doi.org/10.1046/j.1365-2184.2003.00288.x
16. Eales, K. L., Hollinshead, K. E. R., & Tennant, D. A. (2016). Hypoxia and metabolic adaptation of cancer cells. Oncogenesis, 5(1), e190–e190. https://doi.org/10.1038/oncsis.2015.50
17. Li, H., Lei, B., Xiang, W., Wang, H., Feng, W., Liu, Y., & Qi, S. (2017). Differences in protein expression between the U251 and U87 cell lines. Turkish Neurosurgery, 27(6), 894–903. https://doi.org/10.5137/1019-5149.JTN.17746-16.1
18. Barth, R. F. (2010). Rat brain tumor models in experimental neuro-oncology. Neuro-Oncology, 94(3), 299–312. https://doi.org/10.1007/s11060-009-9875-7.Rat
Figures