4814
Augmented magnetic resonance spectra to differentiate metastasis from glioblastoma brain tumours1University of Surrey, Guildford, United Kingdom
Synopsis
Metabolic processes monitored by MRS precede micro-structural changes visualised by imaging. The high noise and the overlapping spectra of metabolites affect the accurate quantification of metabolite’s concentration. This work hypothesizes that each tissue has a unique metabolic fingerprint and a diagnostic model could be built based on tissue spectra. The MRS datasets however are usually small and acquired with different parameters. This work quantum-mechanically simulates spectra and uses the augmented spectra to train a model that can differentiate metastasis from glioblastoma brain cancer. The trained model was tested on acquired spectra from the INTERPRET single-voxel dataset and illustrated a ROC-AUC=0.90.
Introduction
Magnetic Resonance spectroscopy can noninvasively evaluate the metabolic activity in human brain tumours. The quantification of the metabolites concentration however is affected by limitations in the acquisition and overlapping spectra of the metabolites. The hypothesis behind this project is that tumour types will have a unique spectroscopic fingerprint and their classification could be achieved based on the pattern of the spectra. This works focusses on the differentiation of metastasis from glioblastomas, as it affects the patient’s treatment. Glioblastomas are commonly treated with surgical resection whereas the treatment of metastasis can vary based on the primary site of the tumour and its grade. This work is based on the INTERPRET single voxel dataset [1-5] where each patient went through two different sequences using a short (STE) and a long echo time (LTE). STE spectra include more metabolites than LTE, but in LTE key metabolites like Creatine and Choline are visible [6]. This work generated augmented spectra based on a quantum mechanical model, trained 1D Convolutional Neural Network (CNN) models on the augmented data and tested it on the acquired INTERPRET single voxel dataset.INTERPRET single voxel dataset
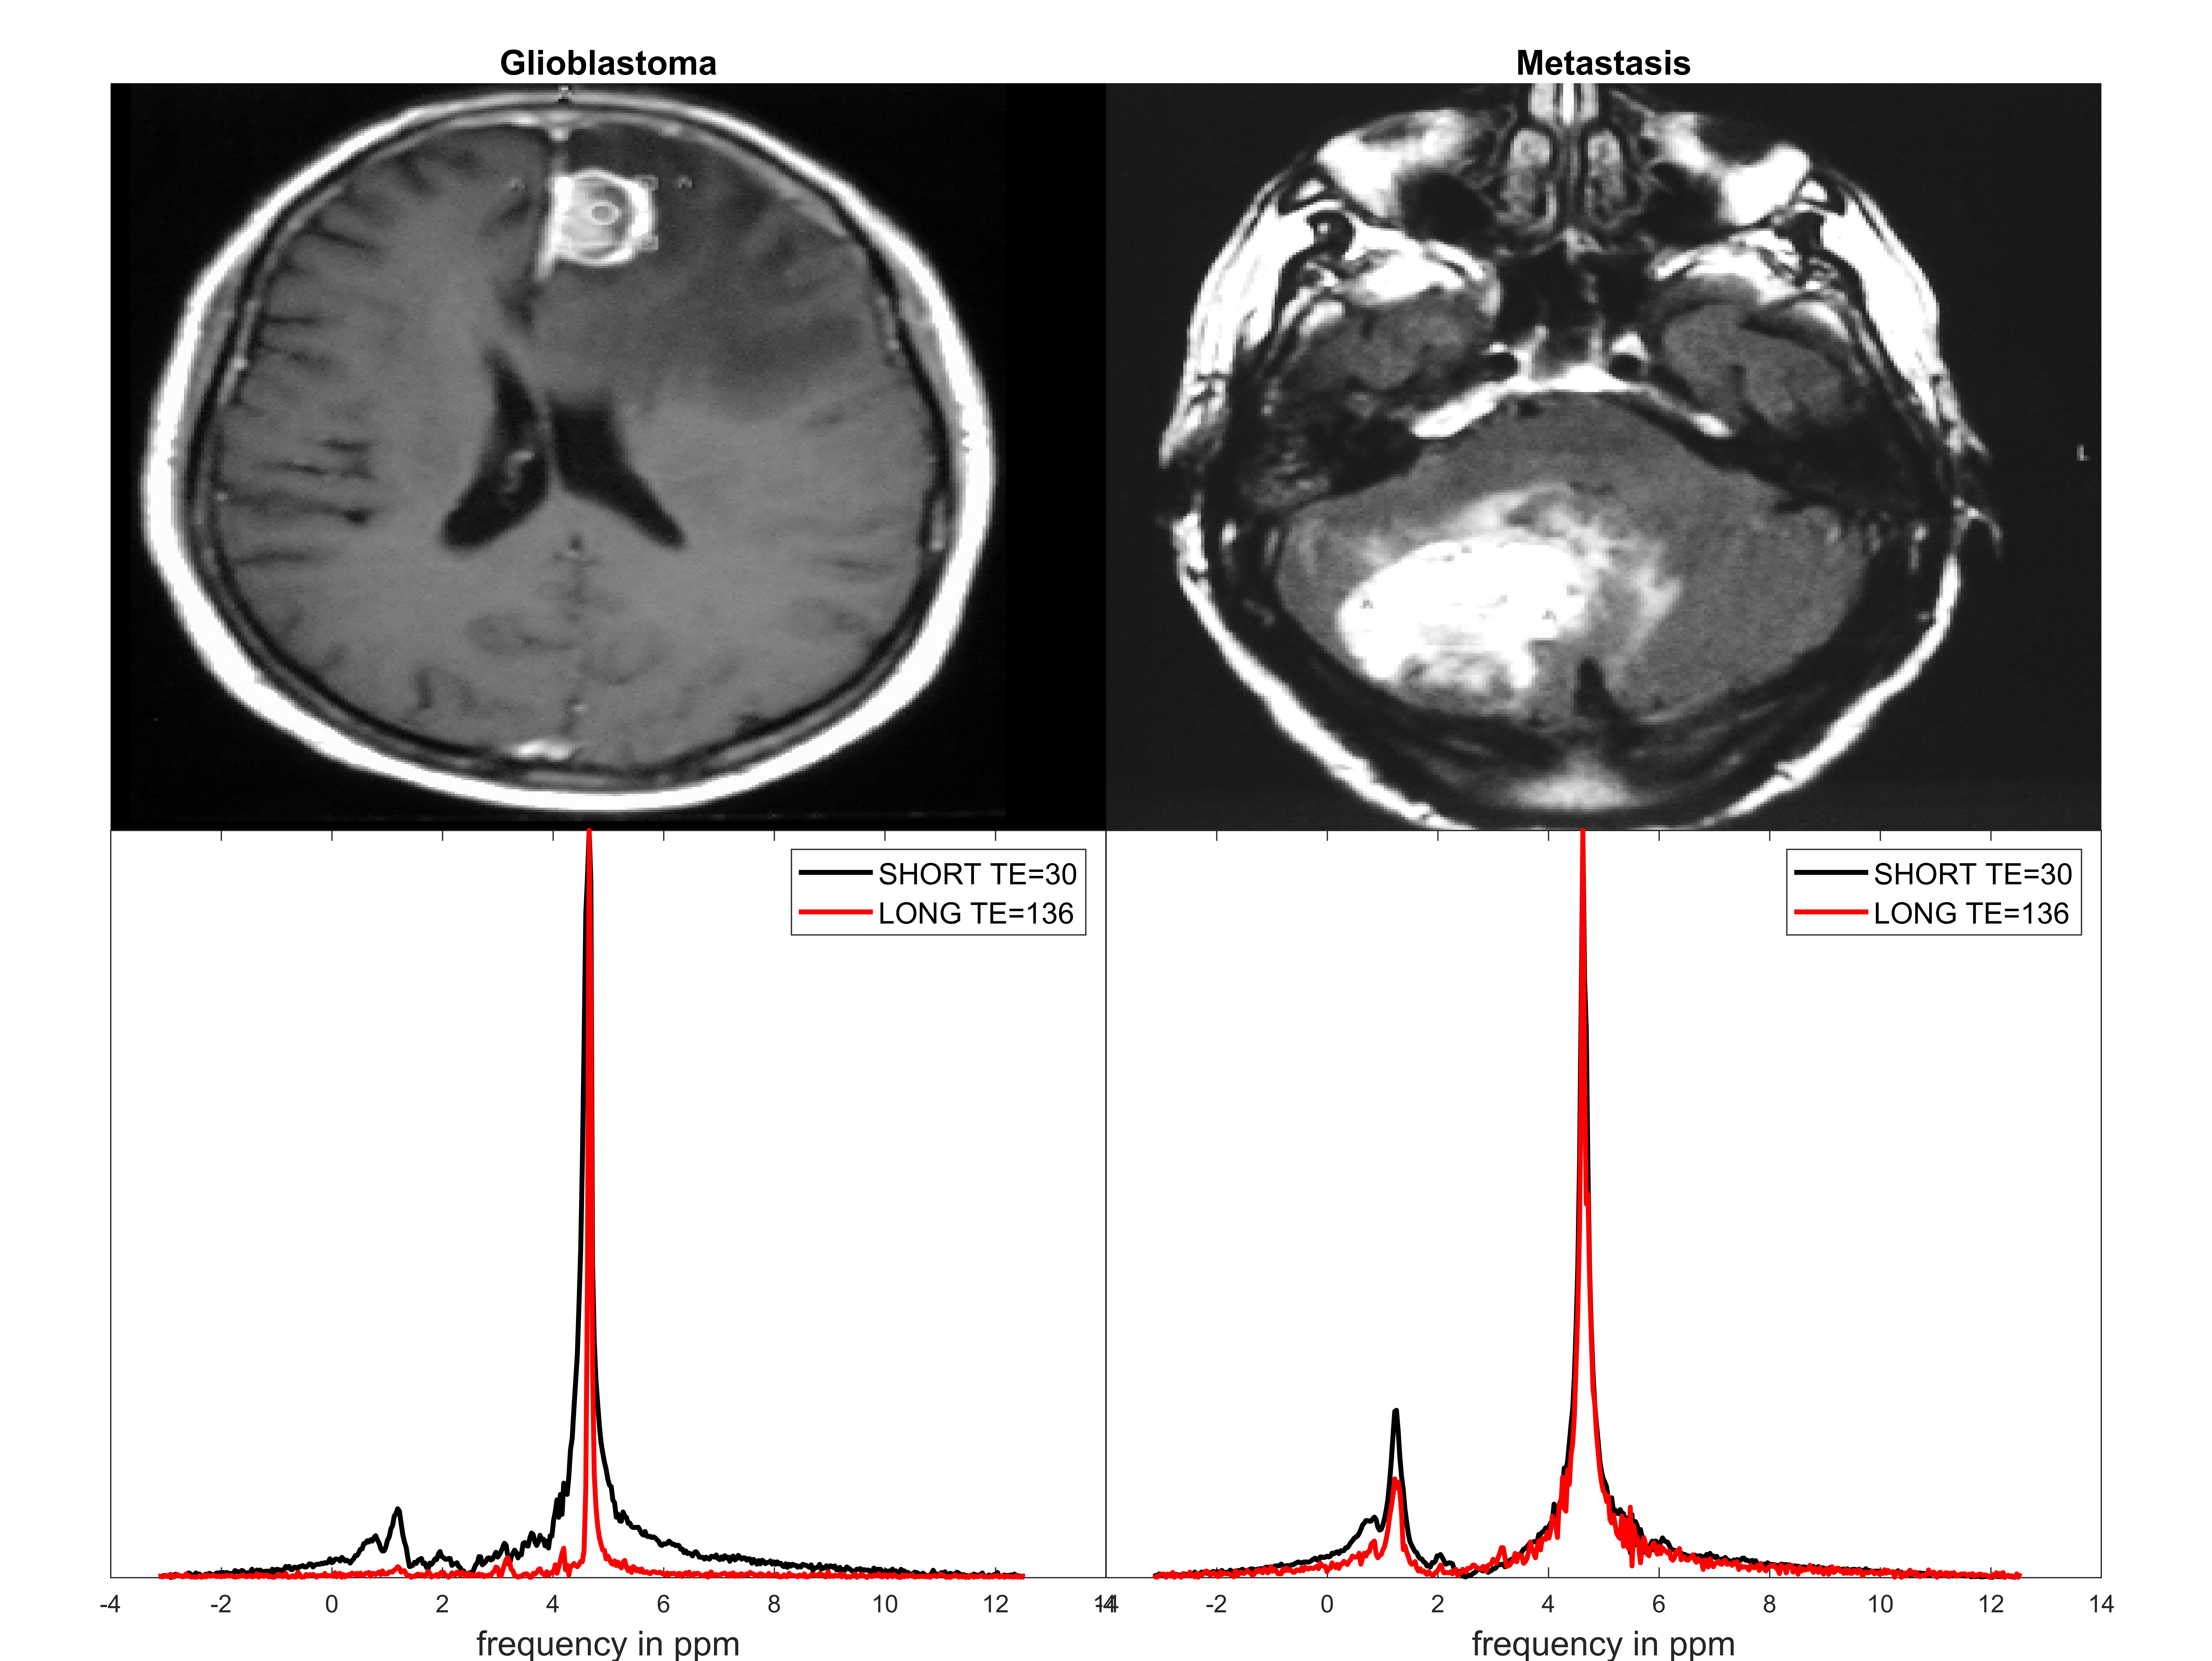
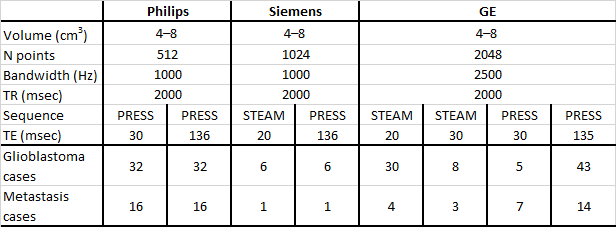
The INPERPRET study consists of data from 8 different clinical centres using 3 different 1.5T MR scanners, namely: GE Signa Advantage and LX CV/i 1.5T, Philips NT and ACS NT 1.5T, and Siemens Vision 1.5T. This work included 112 patients, i.e. 81 Glioblastoma and 31 Metastasis cases histopathologically confirmed. Each patient was imaged using a PRESS LTE protocol and either STE STEAM or PRESS protocol. Table 1 summarises the details of the acquisition and patient population. Figure 1 shows a T1 weighted image and short/long echo time spectra for a glioblastoma and metastasis cancer case.Model MRS signal
Both STEAM and PRESS have been quantum mechanically simulated using the density matrix formalism to better depict the signal especially from brain metabolites with strongly coupled AB system such as citrate [7,8]. The time evolution of the density matrix, σ(t) is described by $$$\sigma(t)=e^{-itH}\sigma(0)e^{itH}$$$ following the solution of Liouville-von Neumann equation, where H is the time dependent Hamiltonian. The Hamiltonian of a two spin-½ nudei system (I and S respectively) with isotropic strong coupling, without RF pulses is represented by $$$H=\omega_{A}I_{z}+\omega_{B}S_{z}+J_{AB}(I\cdot S)$$$, where JAB is the coupling constant. The quantum mechanical simulation was implemented in Python similarly to the work by Simpson et al (2017) [9].Generate MRS spectra to discriminate cancers
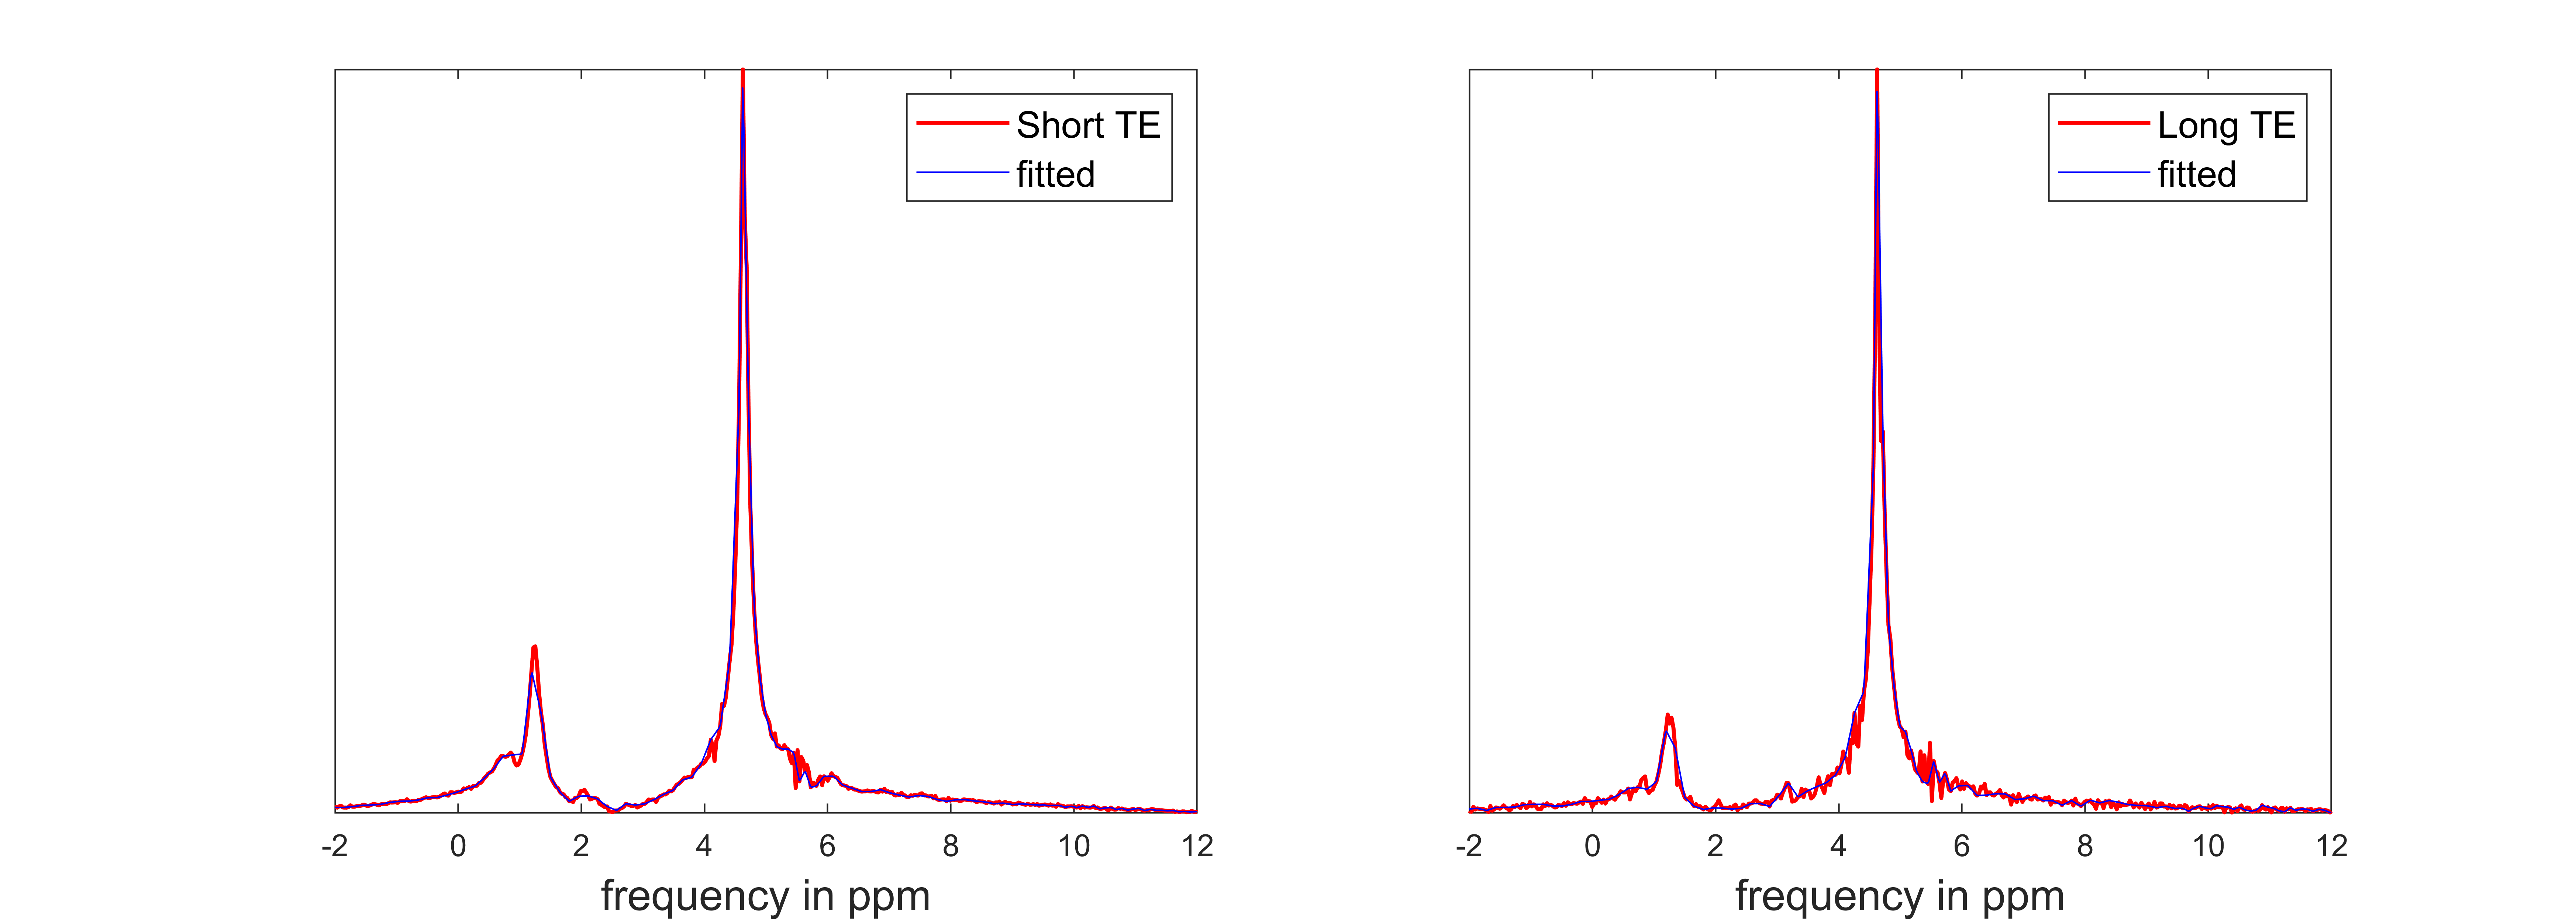
The MRS model depends on the number of atoms of the different metabolites and was fit to the acquired spectrums of the brain. A multi start optimization fitting method was used to avoid local minima. Figure 2 illustrates two fitting examples for a short and a long echo time. A two-sample Kolmogorov-Smirnov test was used to assess the goodness-of-fit and based on the 5% significance level 77 of the 112 spectra were successfully fitted for the STE and 82 of the 112 for the LTE. Noise was added to the simulated MRS signal to resemble the acquired spectra. The noise levels were estimated from the acquired spectra [10]. The augmented data were generated based on the estimated number of atoms for the different metabolites from the 83 spectra using the MRS model. The noise level of the simulated MRS signal and the number of atoms for water varied to generate ~14500 spectra Three different 1D Convolutional Neural Network (CNN) were used to train using the augmented (i) ~7000 STE spectra, (ii) ~7500 LTE spectra and (iii) ~7000 STE+LTE spectra. CNN is configured with 4 convolutional layers with numbers of filter 8,8,16,16 respectively, followed by a ReLU layer and 1 × 3 Max pooling layer. There are 2 fully connected layers with 32 and 16 fully connected neurons respectively with a ReLU layer in between, followed by a softmax and classification layer. Adaptive Moment Estimation (ADAM) method was used for optimization.Results
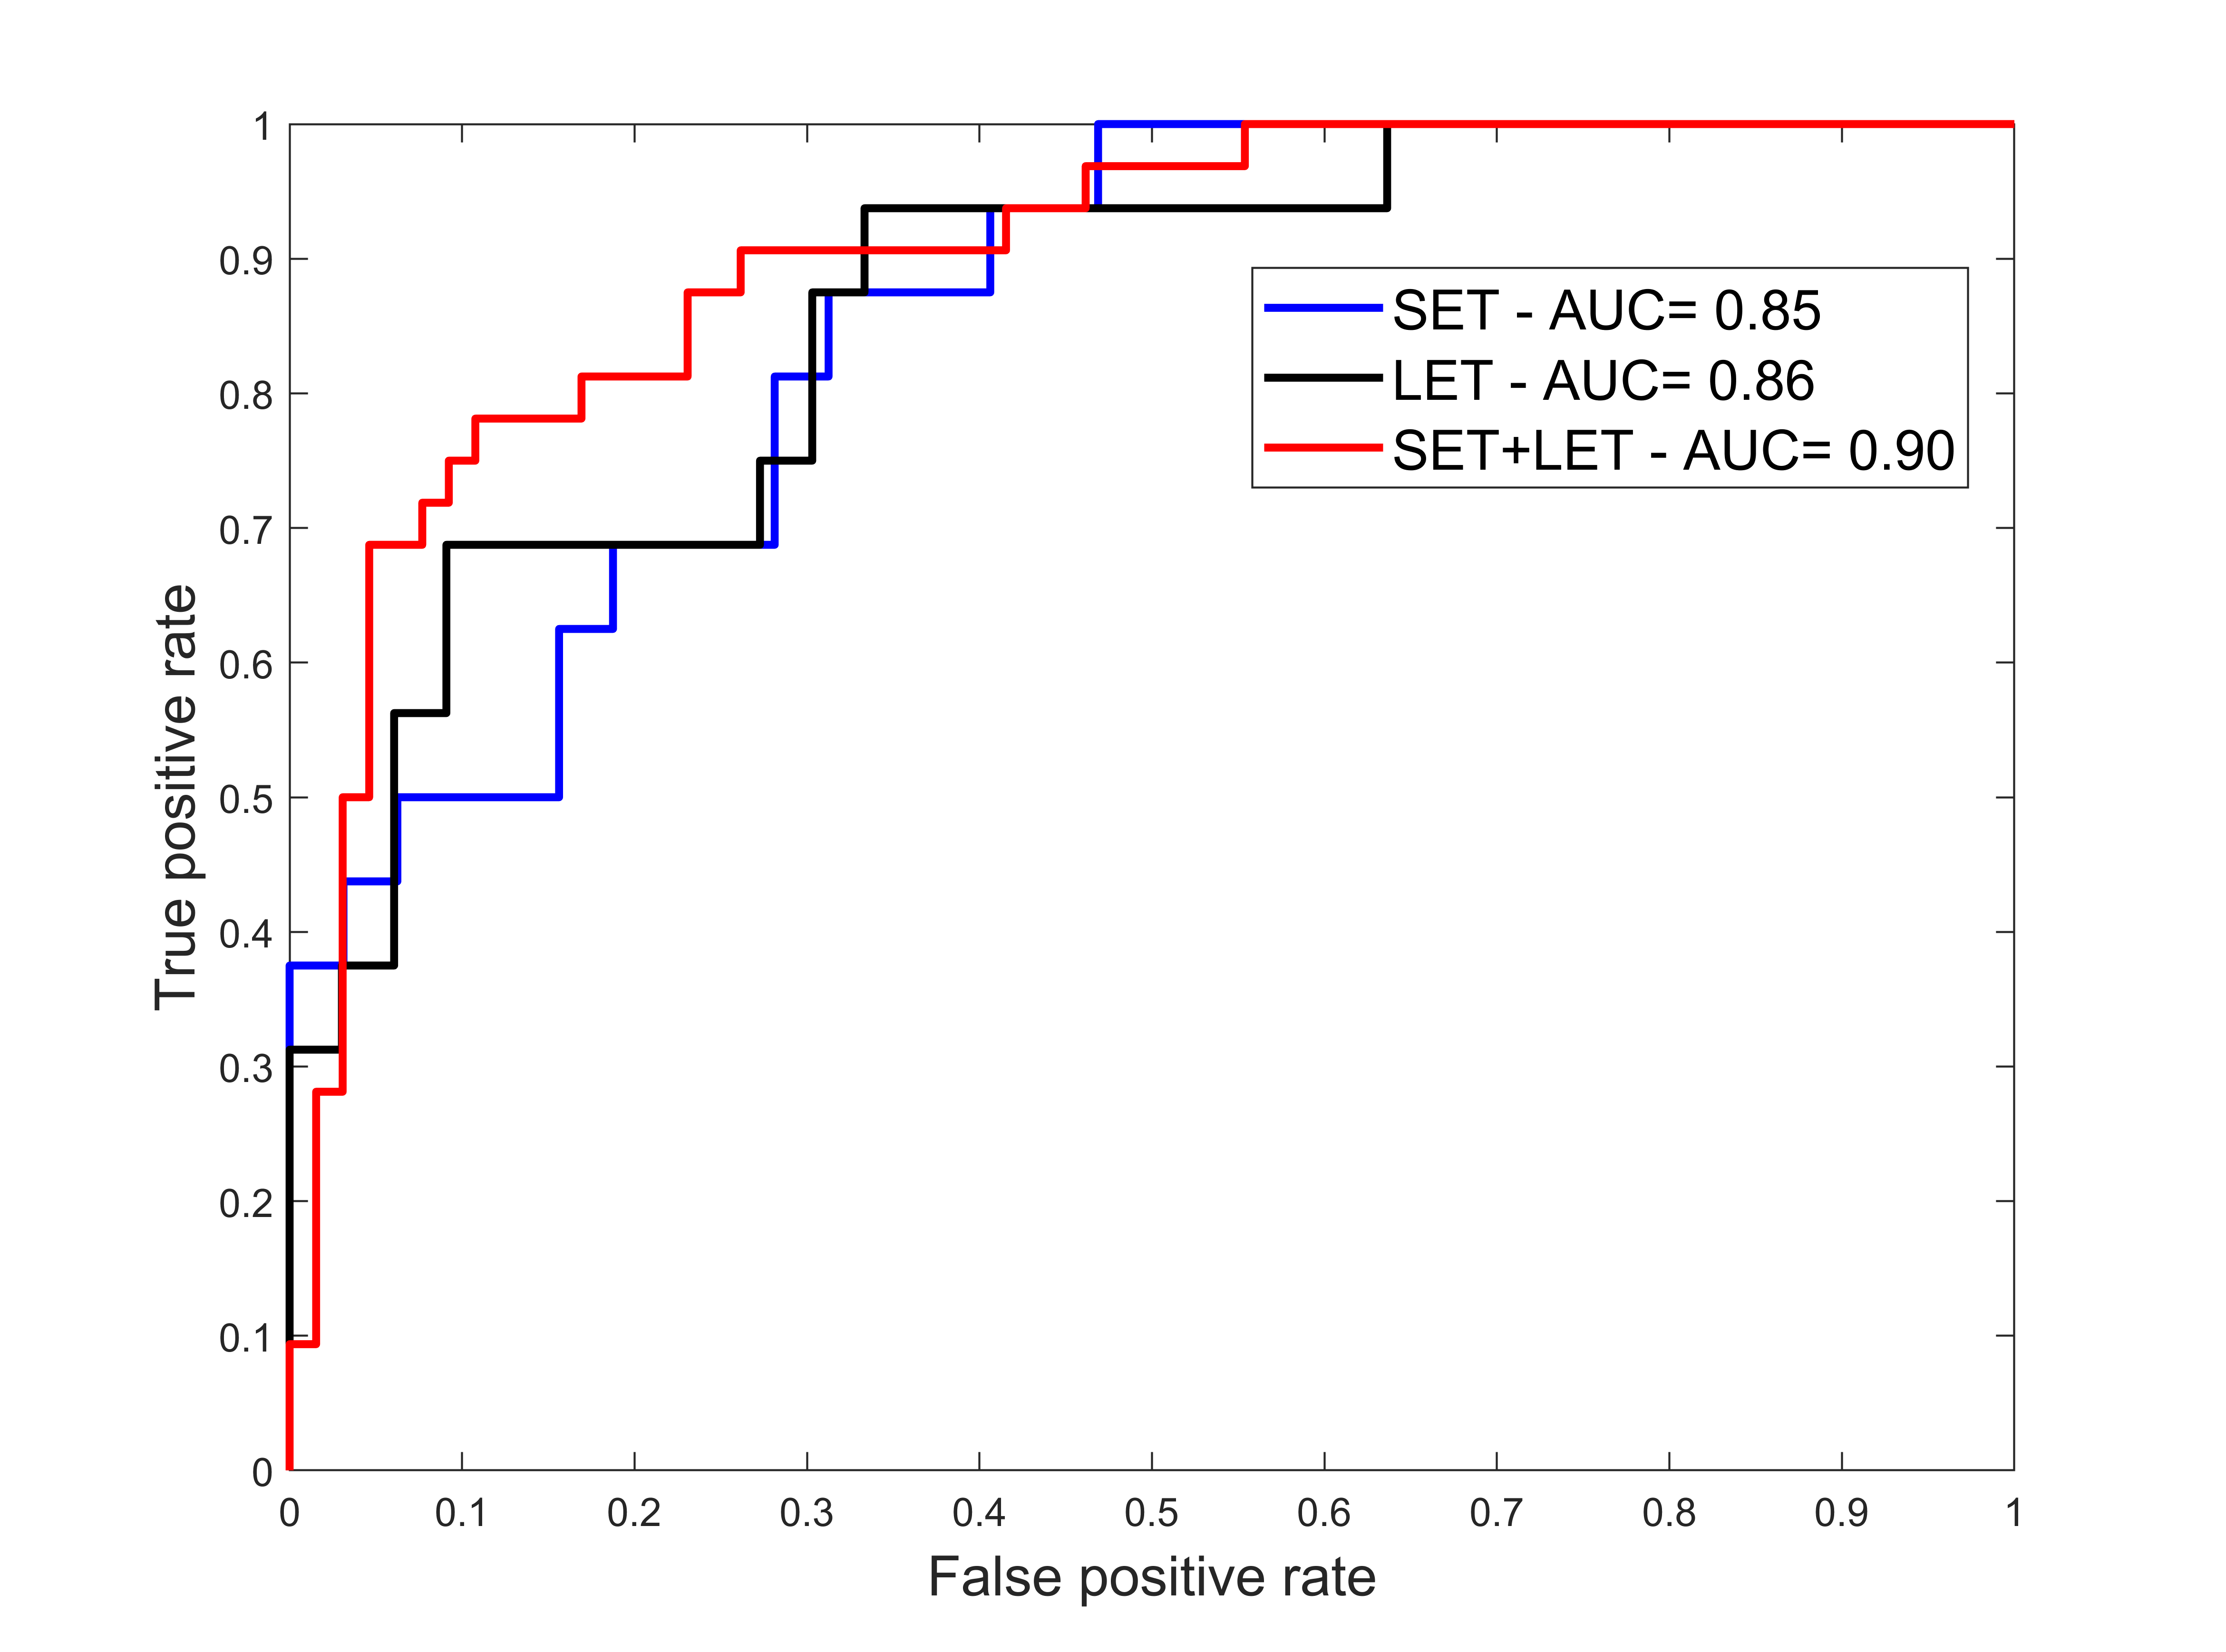
The trained 1D CNN model was applied on the 112 LTE and STE acquired brain spectra. Its ability to discriminate metastasis from glioblastoma was assessed based on the receiver operating characteristic (ROC) curve (Figure 3).Discussion
The ROC area under the curve was similar for the STE and the LTE trained 1D CNN model (0.85 and 0.86 respectively). The performance did not significantly improve for the STE+LTE model. The reported results are in accordance with ROC AUC reported in the literature in the same dataset [11]. The difference in this work is that the proposed model is based solely on augmented data. A key advantage of the proposed methodology is that augmented data could be generated for different acquisition protocols. Generating big data is particularly important especially when deep neural networks are used for training.Acknowledgements
The author is grateful to Dr Margarida Julià-Sapé for her invaluable help with the INTERPRET dataset and to Prof John Griffith for suggesting the dataset. Dr Nikolaos Dikaios has been supported by Royal Society (INF\R1\191030)References
1.Tate AR, Underwood J, Acosta DM, et al (2006) Development of a decision support system for diagnosis and grading of brain tumours using in vivo magnetic resonance single voxel spectra. NMR Biomed. 19(4):411-34.
2.García-Gómez JM, Luts J, Julià-Sapé M, et al (2009) Multiproject-multicenter evaluation of automatic brain tumor classification by magnetic resonance spectroscopy. MAGMA. 22(1):5-18.
3.Pérez-Ruiz A, Julià-Sapé M, Mercadal G, et al. (2010) The INTERPRET Decision-Support System version 3.0 for evaluation of Magnetic Resonance Spectroscopy data from human brain tumours and other abnormal brain masses. BMC Bioinformatics. 11:581.
4.Julià-Sapé M, Majós C, Camins À, et al (2014) Multicentre evaluation of the INTERPRET decision support system 2.0 for brain tumour classification. NMR Biomed. 27(9):1009-18.
5.Julià-Sapé M, Griffiths JR, Tate AR, et al (2016) Classification of brain tumours from MR spectra: the INTERPRET collaboration and its outcomes. NMR Biomed. 28(12):1772-87.
6.Bogdan, AA, Kataeva, GV, Khomenko JG et al. (2017) Diagnostic Value of Short and Long Echo Time in 1H-MRS for Patients with Multiple Sclerosis. Appl Magn Reson 48: 707-14.
7.Mulkern, RV, & Bowers, JL (1993). Calculating spectral modulations of AB systems during PRESS acquisitions. Magnetic resonance in medicine, 30(4), 518-519.
8.Mulkern, RV, Bowers, JL, Peled, S., & Williamson, D. S. (1996). Density-matrix calculations of the 1.5 T citrate signal acquired with volume-localized STEAM sequences. Journal of magnetic resonance, Series B, 110(3), 255-266.
9.Simpson R, Devenyi GA, Jezzard P, Hennessy TJ, and Near J (2017) Advanced Processing and Simulation of MRS Data Using the FID Appliance (FID-A)—An Open Source, MATLAB-Based Toolkit. Magnetic Resonance in Medicine 77:23–33 (2017)
10.Dikaios N, Punwani S, Hamy V, et al (2014) Noise estimation from averaged diffusion weighted images: Can unbiased quantitative decay parameters assist cancer evaluation? Magn Reson Med. 71(6):2105-17.
11.Vellido A, Romero E, Julià-Sapé M, et al (2012) Robust discrimination of glioblastomas from metastatic brain tumors on the basis of single-voxel (1)H MRS. NMR Biomed. 25(6):819-28
Figures