4812
Glioblastoma Characterization with Hyperpolarized [1-13C]Pyruvate MRSI, DWI and 18F-FDG PET1Department of Nuclear Medicine, Klinikum rechts der Isar, Technical University of Munich, Munich, Germany, 2Neurosurgical Research, University Clinics Munich, Ludwig Maximilian University, Munich, Germany
Synopsis
Multimodal imaging has the potential for non-invasive assessment of imaging biomarkers that guide and monitor treatment of glioblastoma tumours. In this work, an imaging protocol for characterization of implanted patient-derived and murine glioblastoma tumours (GBM2, GBM14, and U87) was established using T2-weighted MRI, DWI, hyperpolarized 13C-pyruvate-lactate CSI, and 18F-FDG PET. Tumours were visible in T2-weighted MRI as high-signal regions with poorly defined borders. Compared with shams and non-tumour brain, all tumour lines had elevated ADC, 18F-FDG Ki, and lactate-to-pyruvate ratio. GBM2 had particularly high and variable lactate-to-pyruvate ratio, despite relatively low variability in ADC.
Introduction
Glioblastoma is an aggressive brain cancer with poor clinical outcomes. Multimodal imaging offers promise of non-invasive tumour assessment using structural and metabolic biomarkers to guide and monitor treatment. This study’s goal was to establish a preclinical model and protocol for characterizing and differentiating glioblastoma types in mice with diffusion weighted imaging (DWI) and hyperpolarized 13C pyruvate-lactate spectroscopic imaging at 7T, and 18F-FDG PET.Methods
Cell Implantation: Nude-Foxn1nu (~6 weeks of age, female, Envigo), were injected with 105 primary glioblastoma stem cell cultures derived from classical (GBM2), proneural genetic subtype (GBM14), or an established (U87MG) cell lines1, targeting the caudate putamen of the right brain hemisphere. Other Black‑6 C57BL and Nude‑Foxn1nu mice received sham PBS injections.Imaging Systems: Small animal 7 T preclinical scanner (Agilent/GE magnet, Bruker AVANCE III HD electronics) using a dual-tuned 1H/13C volume coil (31 mm ID; RAPID Biomedical). Small animal PET/CT scanner (Siemens Inveon). Isoflurane anesthesia (~2% v/v) was used as needed.
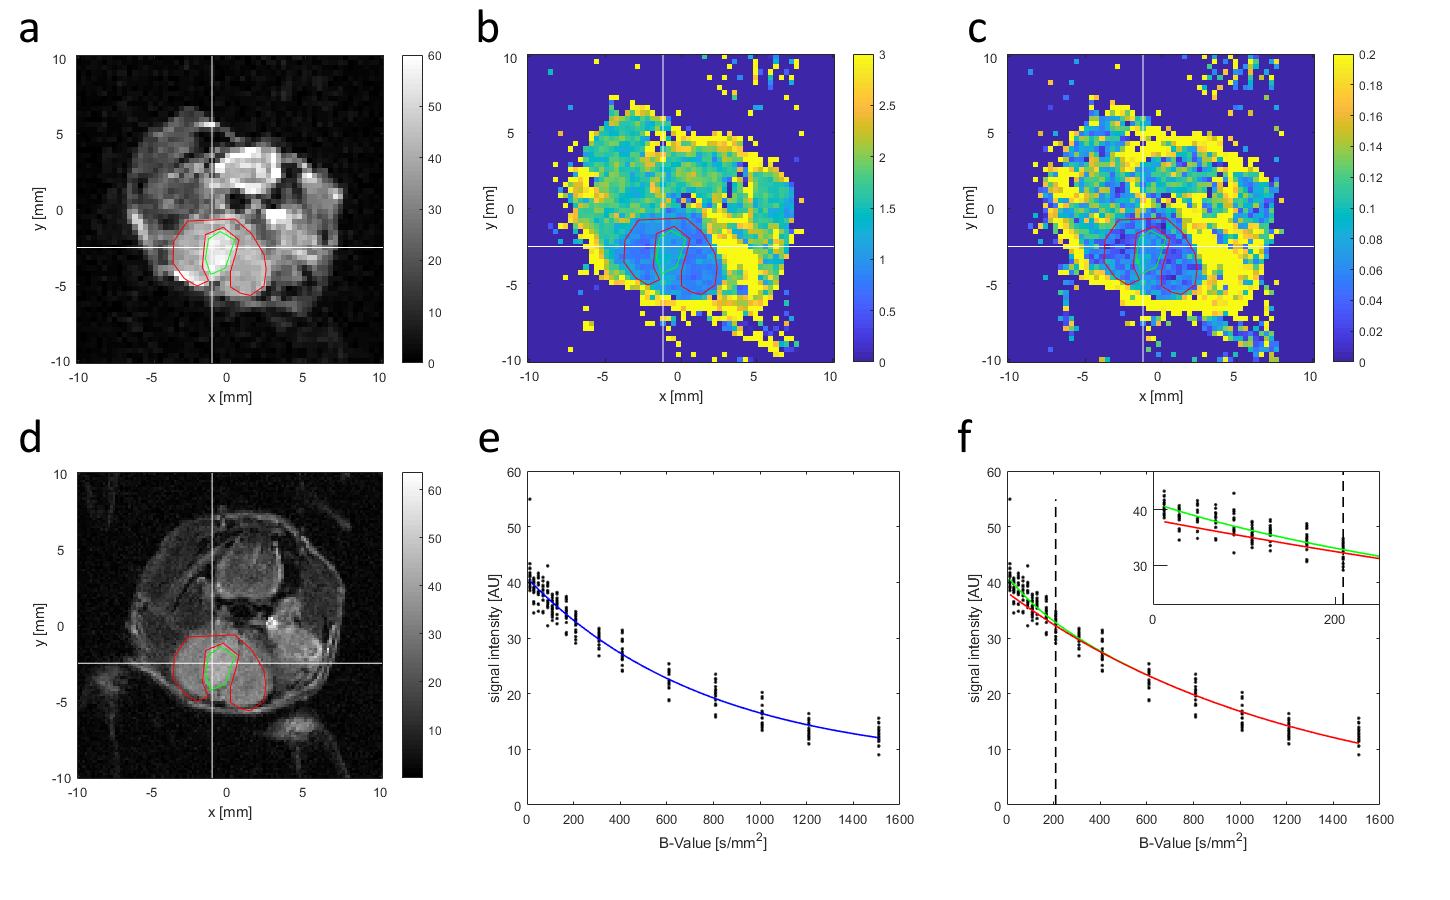
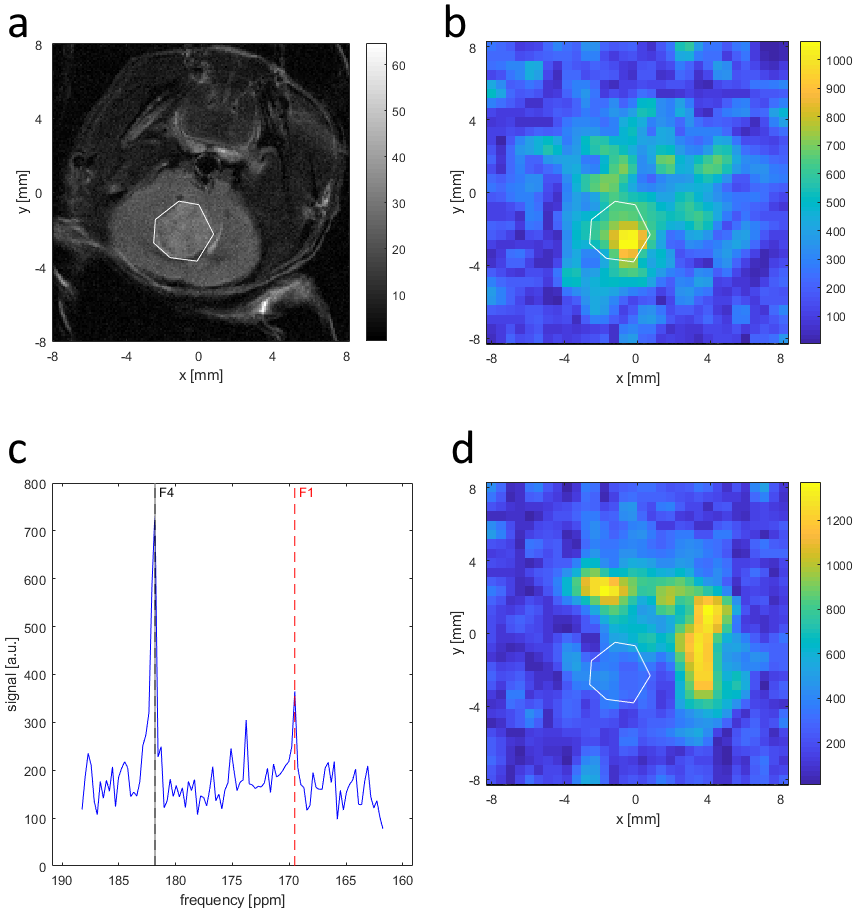
MR Screening: Mice were screened with T2-weighted MRI to follow tumour development. Mice with tumours observed as bright regions of >4 mm diameter in the target region were selected for subsequent imaging. MR Imaging: T2-weighted axial anatomical RARE, DWI, and 13C CSI were acquired. DWI used an EPI readout with 11 b-values (up to 1500 s/mm2) and, for a subset of subjects, an additional 5 b-values (below 210 s/mm2), field of view 20x20 mm2, matrix 60x60 or 80x80, 10 repetitions, and slice thickness 1 mm. Voxels were fit with a mono-exponential plus constant offset model for the apparent diffusion coefficient (ADC) and, when additional low b-values were acquired, also with a bi-exponential model for the fast diffusion fraction to assess intra-voxel incoherent motion (IVIM). [1-13C]-pyruvate was hyperpolarized (Oxford Instruments HyperSense DNP), injected by tail vein (80 mM, 260 µl), and imaged with single-slice single-frame CSI with field of view 16x16 mm2, matrix 16x16, and 3 mm thick slices, starting 15 s after end of injection.
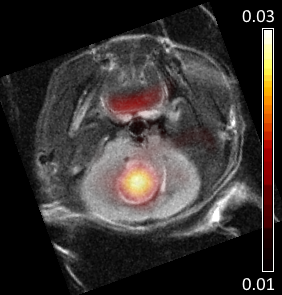
PET-CT Imaging: 18F-FDG (approx. 12 MBq) was injected by tail vein, and data were acquired for 85 min. Pixel activity time-courses were fit for the influx rate constant Ki, using the Patlak model and an input function from early peak blood vessel activity. X-ray CT images were also acquired for anatomical reference.
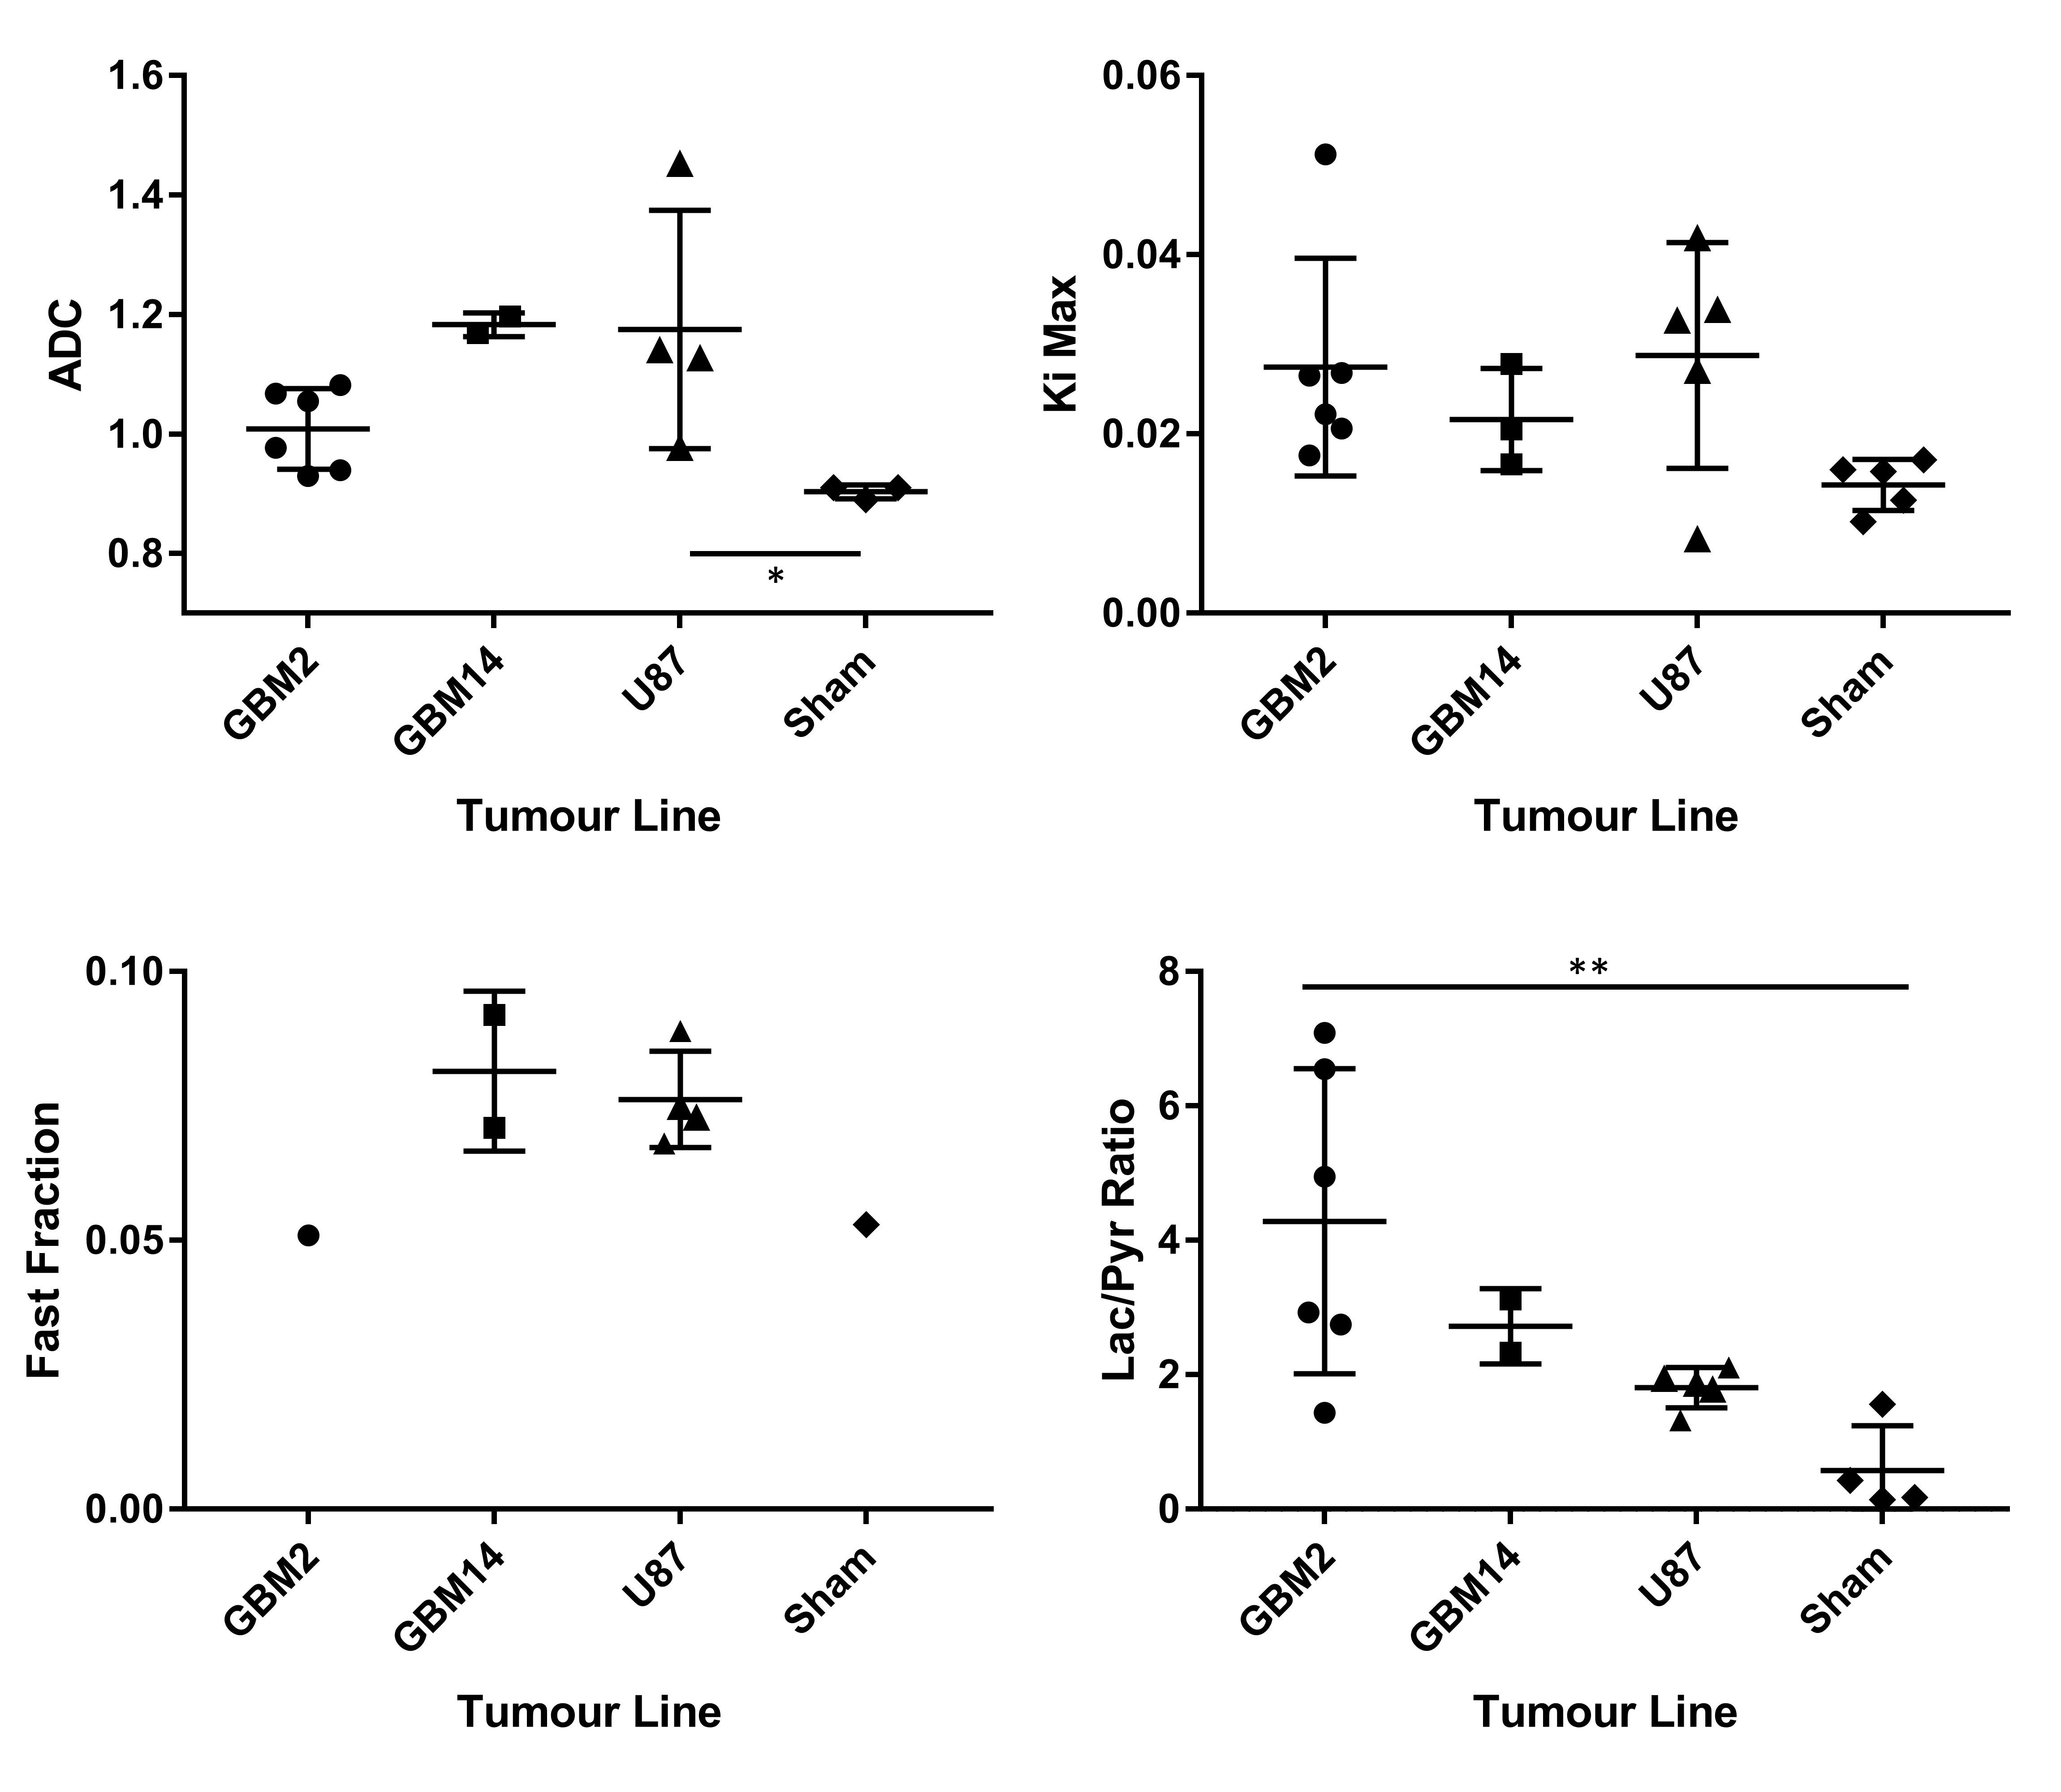
Analysis: Ki maps and CT images were manually coregistered with anatomical MRI. Regions of interest (ROIs) were drawn over tumours in Ki maps, 13C CSI, ADC, and diffusion fast fraction maps using T2w for anatomical reference. Within ROIs, the ADC, fast fraction, and lactate-to-pyruvate spectral peak intensities were averaged, and the maximum Ki was found. For sham-injected animals, ROIs were placed over normal brain tissue.
Results
Glioblastoma growth after implantation was unpredictable, with some tumours appearing outside the target region, often in the ventricles. Successfully scanned subjects were: 6x GBM2, 3x GBM14, 5x U87, and 5x sham, with various subsets of modalities.Tumours were visible as bright regions in T2-weighted images, but generally poorly delineated with unclear edges (Fig. 1 and 2). Compared with non-tumour brain tissue, tumours generally had higher Ki (Figs. 3 and 4), higher ADC and biexponential fast compartment fraction (Figs. 1 and 4), and higher 13C-lactate signal (Figs. 2 and 4). GBM2 tumours had especially high values and variability of lactate-to-pyruvate ratios.
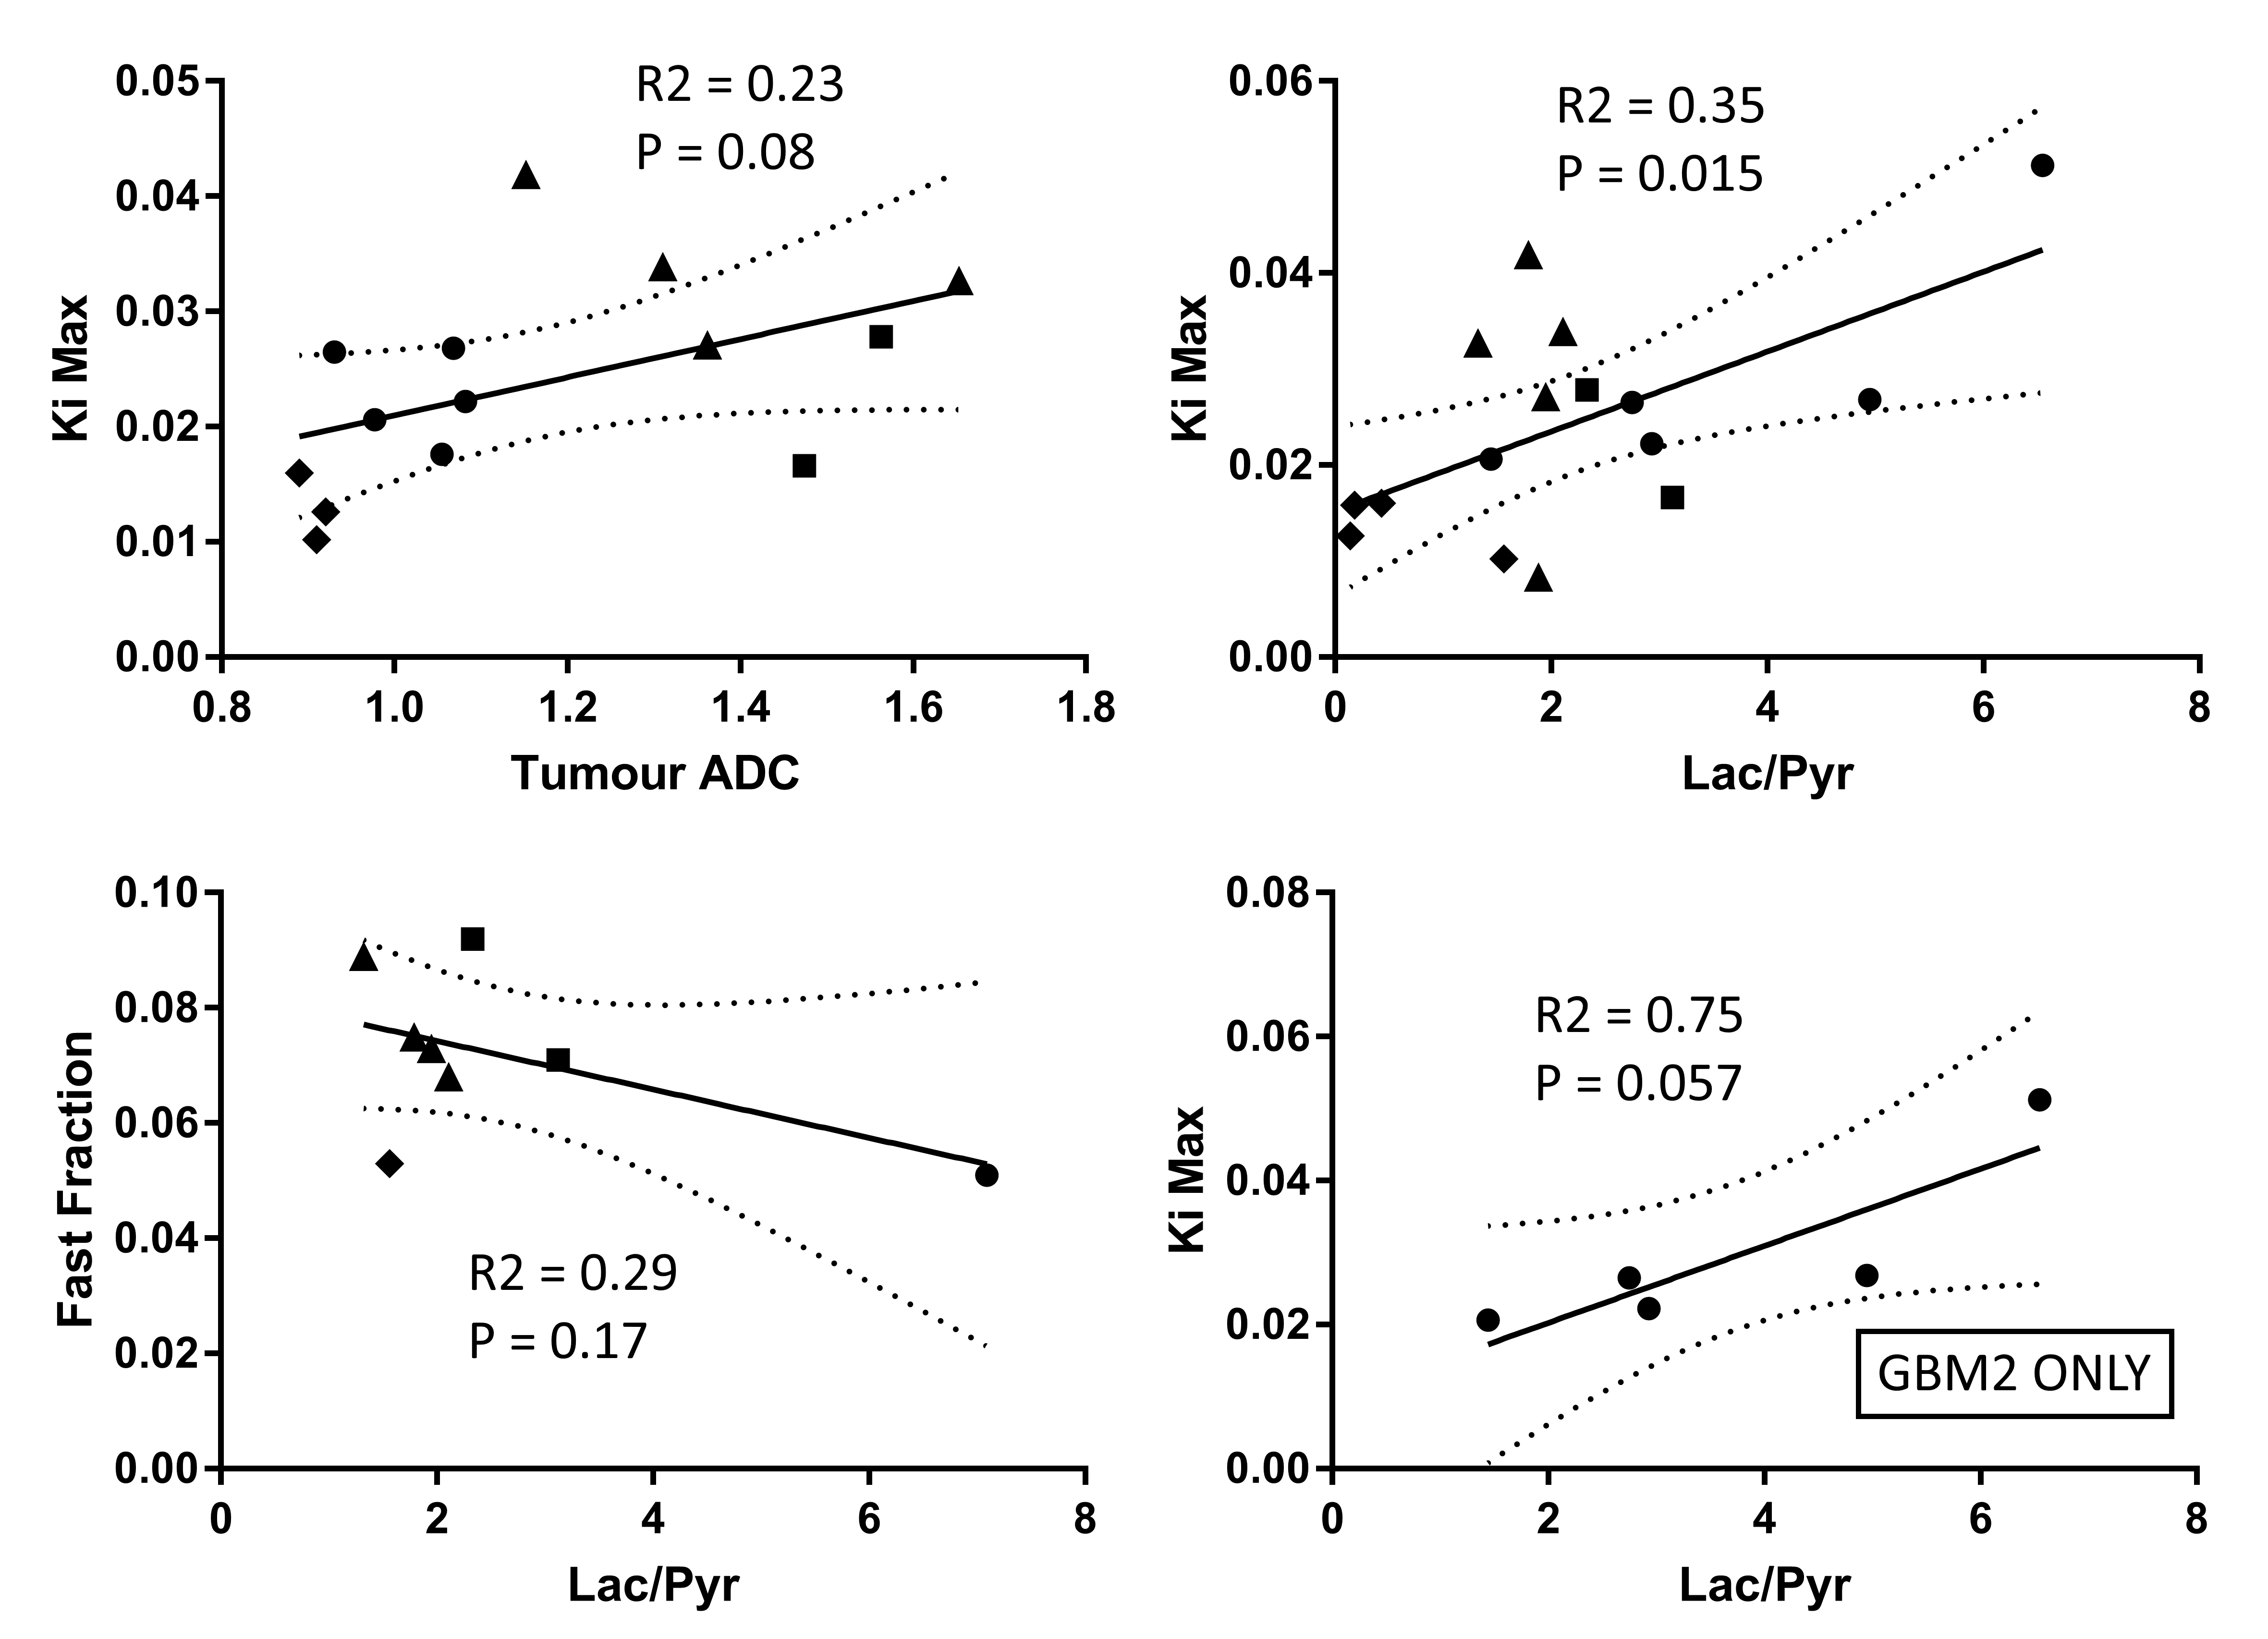
Correlations between modalities (Fig. 5) for all tumours grouped together are poor or insignificant. For just GBM2 tumours, correlation between Ki and lactate-to-pyruvate ratio is relatively high (R2 = 0.75), bordering on significance (P=0.057).
Discussion
Higher ADC and T2 contrast in tumours than non-tumour brain suggests that tumours have localized edema or low cellular density and less-restricted diffusion. Poorly defined tumour boundaries suggests infiltration rather than encapsulated tumour growth.Higher Ki and lactate-to-pyruvate ratio in tumours indicates altered metabolism compared with normal brain tissue. GBM2 tumours had higher and more-variable lactate-to-pyruvate ratio than other tumour lines, despite similar PET Ki values and consistently low tumour ADC, suggesting 13C CSI may provide complementary metabolic information.
Although subject numbers were limited for low-b DWI, the observed variations between tumours and sham injected animals warrants further investigation.
Acquisition of the results reported here was complicated by the unpredictable and invasive growth of glioblastoma tumours, and the multi-modality imaging protocol, which required long anesthesia durations and multiple injections in fragile immune-compromised mice.
Conclusion
Patient-derived GBM2, GBM14, and U87 glioblastoma tumours implanted in mice were imaged with DWI, hyperpolarized 13C-pyruvate CSI, and 18F-FDG PET. Each biomarker revealed patterns of variation between tumours, and their combination may provide complimentary information and allow differentiating glioblastoma types.Acknowledgements
We acknowledge support from the Deutsche Forschungsgemeinschaft (DFG, German Research Foundation – 391523415, SFB 824).
Jorge Cabello wrote the software used for Patlak fitting PET data.
Sandra Sühnel performed screening scans and assisted with CSI and DWI acquisition.
Sybille Reder and Markus Mittelhäuser performed PET measurements.
References
1. Mastrella G, Hou M, Li M, et al. (2019) Targeting APLN/APLNR Improves Antiangiogenic Efficiency and Blunts Proinvasive Side Effects of VEGFA/VEGFR2 Blockade in Glioblastoma. Cancer Research 79(9):2298-2313Figures