4811
Elevation in lactate concentration and intracellular pH is less pronounced in IDH mutant compared to IDH wildtype glioma patients1Neuroradiology, Goethe-University Frankfurt, Frankfurt, Germany, 2Neurooncology, Goethe-University Frankfurt, Frankfurt, Germany
Synopsis
Preclinical evidence points towards a metabolic reprogramming in isocitrate dehydrogenase mutated tumor cells with downregulation of the expression of genes that encode for glycolytic metabolism. We non-invasively investigated lactate concentrations, as well as intracellular pH using 1H and 31P MRS in a glioma patient cohort. At TE 97 ms, lactate peaks can be fitted with little impact of lipid/macromolecule contamination. We found a significant difference in lactate concentrations and intracellular pH comparing tumor voxels of IDH mutatet to IDH wildtype patients, with reduced lactate levels and near normal intracellular pH in IDHmut patients.
Introduction
Preclinical evidence points towards a metabolic reprogramming in isocitrate dehydrogenase mutated tumor cells with downregulation of the expression of genes that encode for glycolytic metabolism.1-3 We applied SVS 1H MR spectroscopy optimized for detecting 2-hydroxyglutarate (2-HG)4 at TE of 97 ms to monitor non-invasively mutation status and lactate concentration in a glioma patient cohort. Glycolytic cancer cells utilize overexpressed and/or overactivated H+‐ATPases, Na+‐H+ exchangers, carbonic anhydrases IX and XII, and monocarboxylate‐H+ efflux cotransporters to export protons and lactate produced by lactate dehydrogenases.5-7 As a result, the proton gradient between intracellular and extracellular space is reversed causing an acidification of the extracellular space. Therefore, we also measured the intracellular pH using 31P MRSI.Methods
30 prospectively enrolled, mostly untreated glioma patients(WHO °II n=7, °III n=16, °IV n=7; IDHmut n=23, IDHwt, n=7; 1p/19q codeletion n=9) met the spectral quality criteria. The MRI protocol included 3D 31P MRSI and 1H single voxel spectroscopy employing PRESS at TE 30 ms and TE 97 ms. The long TE was applied with optimized echo spacing for detection of 2-hydroxyglutarate (2-HG)4 from the tumor area. The spectra were analyzed with LCModel using simulated basis sets. Values for absolute metabolite concentrations were calculated (phantom replacement method) while the intracellular pH was determined from signal position of inorganic phosphate in 31P MRSI.Results
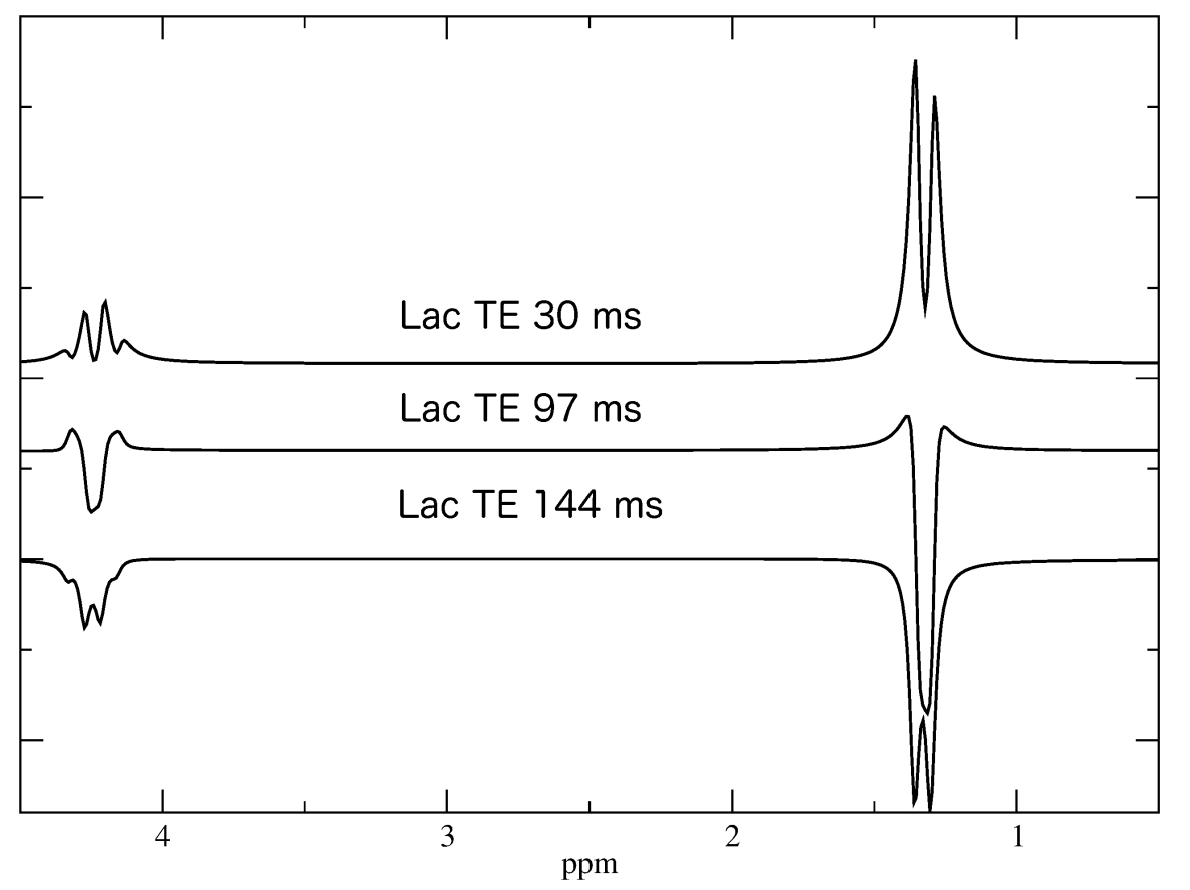
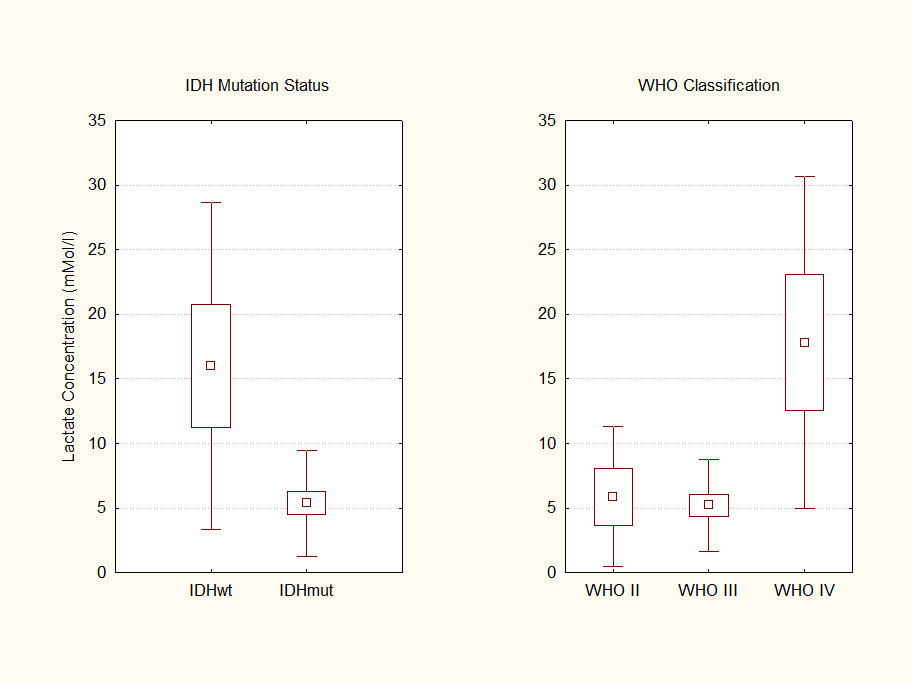
Simulated lactate spectra at the different TEs indicate a prominent negative signal at 1.3 ppm (in contrast to the dublet at TE 30 s or 144 s) when using the sequence optimized for 2-HG detection (Figure 1). This enables the quantification of lactate even in the presence of those lipids which are not be completely suppressed by the long TE (Figure 2).As shown in Figure 3 lactate concentrations in IDHwt gliomas are significantly higher compared to IDHmut (p<0.003). Since most WHO °IV tumors from our cohort are IDHwt, this finding coincides with higher lactate concentrations in WHO °IV. We also found a significant difference between IDHmut patient with chromosomal losses 1p/19q and IDHmut patients without chromosomal losses with regard to lactate concentration (p<0.038, data not shown).
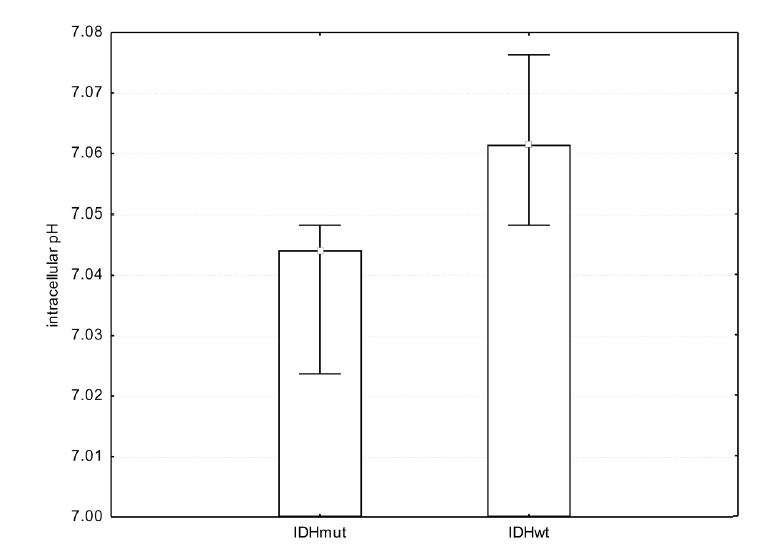
The intracellular pH was significantly different comparing tumor voxels of IDHmut glioma patients to respective voxels for IDHwt patients (p<0.002, Figure 4). Further results regarding metabolite ratios obtained from 3D 31P MRSI have been published previously.8
Discussion
The presented data clearly point towards an IDH genotype dependence of intratumoral lactate levels. We additionally found evidence for codependent effects of 1p/19q codeletion and IDH mutations with regard to lactate concentrations for tumor grades WHO °II and °III. This points towards IDH gene mutations and 1p/19q codeletion as two contributing factors to changes in cell metabolism independent of WHO grade. A lower lactate production (and possibly excretion) is in line with the near normal intracellular pH in IDHmut tumors while the reversal of the proton gradient between intracellular and extracellular space with acidification of the extracellular space is a characteristic feature of IDHwt tumors.Conclusion
Using a PRESS sequence optimized for detection of 2-HG also enables the quantification of lactate even in the presence of lipids. We found indirect evidence for metabolic reprogramming in IDHmut tumor cells with a significantly decreased lactate concentrations compared to IDHwt cells. Our findings suggest that the prediction of IDH mutational status can be supported by reporting lactate levels (e.g. as Lac/Cr ratios) in addition to 2-HG.Acknowledgements
Grant support: Stiftung Tumorforschung Kopf-Hals (Wiesbaden, Germany), Frankfurter Forschungsfoerderung (Frankfurt, Germany)References
1. Chesnelong C, Chaumeil MM, Blough MD, et al. Lactate dehydrogenase A silencing in IDH mutant gliomas. Neuro-oncology 2014;16:686–95.
2. Chaumeil MM, Radoul M, Najac C, et al. Hyperpolarized (13)C MR imaging detects no lactate production in mutant IDH1 gliomas: Implications for diagnosis and response monitoring. Neuroimage Clin 2016;12:180–9.
3. Izquierdo-Garcia JL, Viswanath P, Eriksson P, et al. Metabolic reprogramming in mutant IDH1 glioma cells. PLoS ONE 2015;10:e0118781.
4. Choi C, Ganji SK, DeBerardinis RJ, et al. 2-hydroxyglutarate detection by magnetic resonance spectroscopy in IDH-mutated patients with gliomas. Nat Med 2012;18:624–9.
5. Harguindey S, Orive G, Luis Pedraz J, et al. The role of pH dynamics and the Na+/H+ antiporter in the etiopathogenesis and treatment of cancer. Two faces of the same coin--one single nature. Biochim Biophys Acta 2005;1756:1-24.
6.. McLean LA, Roscoe J, Jorgensen NK, et al. Malignant gliomas display altered pH regulation by NHE1 compared with nontransformed astrocytes. Am J Physiol, Cell Physiol 2000;278:C676-688.
7. Swietach P, Hulikova A, Vaughan-Jones RD, et al. New insights into the physiological role of carbonic anhydrase IX in tumour pH regulation. Oncogene 2010;29:6509–21.
8. Wenger KJ, Hattingen E, Franz K, et al. In vivo Metabolic Profiles as Determined by 31P and short TE 1H MR-Spectroscopy : No Difference Between Patients with IDH Wildtype and IDH Mutant Gliomas. Clin Neuroradiol 2019;29:27–36.
Figures