4809
Association of tumor metabolites with inflammation in the glioma microenvironment studied with HRMAS NMR
Selin Ekici1 and Candace C. Fleischer1
1Department of Radiology and Imaging Sciences, Emory University School of Medicine, Atlanta, GA, United States
1Department of Radiology and Imaging Sciences, Emory University School of Medicine, Atlanta, GA, United States
Synopsis
Evidence suggests that inflammation and metabolic dysregulation in the tumor microenvironment are related, yet the mechanistic relationship is not well characterized. Our goal was to utilize ex vivo 1H high resolution magic angle spinning (HRMAS) nuclear magnetic resonance (NMR) spectroscopy to study the relationship between metabolism and tumor inflammation in gliomas. We observed that multiple inflammatory markers were positively associated with glutamine, glutathione, and lactate. C-reactive protein was positively associated with myo-inositol and aspartate. These results support the hypothesis that inflammation may drive metabolic changes in gliomas and supports the use of HRMAS NMR in studies of the tumor microenvironment.
INTRODUCTION
NMR-based metabolomics has the potential to discriminate tumor grades, predict treatment targets, and characterize metabolic pathways essential for tumor growth.1 One property closely associated with tumor progression is inflammation in the microenvironment which has been shown to dysregulate the metabolism of tumor cells.2-3 Multi-parametric studies that employ NMR metabolomics, complemented by immunoassays, can uncover relevant relationships between the inflammatory and metabolic aspects of tumor growth and response to treatment. Here, we present an ex vivo approach to study the tumor microenvironment and characterize the relationship between inflammation and metabolic changes in gliomas (Figure 1).METHODS
Ex vivo glioma samples with histologically confirmed tumor grade (WHO grade II=5; grade III=6; grade IV=5) were acquired from surgical resection. Solid state HRMAS NMR spectra were acquired at 4 ⁰C using a 600 MHz NMR spectrometer (Bruker) and the CPMG pulse sequence with a pre-saturation water suppression pulse under the following conditions: MAS spinning speed = 4 kHz; complex data points = 16,384; bandwidth = 8013 Hz; n=512. Metabolite concentration ratios over total creatine were estimated with LCModel using a gamma-simulated 26-metabolite basis set containing MR-detectable metabolites present in gliomas.4 Inflammatory markers were quantified from homogenized frozen tissue (10-15 mg) and quantified according to manufacturer’s instructions with an electrochemiluminescence assay (Meso Scale Diagnostics). Concentrations were obtained for interleukin (IL)-1A, IL-1B, IL-8, IL-6, tumor necrosis factor-α (TNF-α), and C-reactive protein (CRP). Statistical analysis was performed with IBM SPSS v26.0. Non-parametric Kruskal-Wallis tests were used with post-hoc comparisons to determine differences in metabolite and inflammatory marker concentrations as a function of grade. To limit multiple comparisons for the six inflammatory markers, principal component analysis (PCA) was performed on log-transformed inflammatory marker values to identify principal components (PCs) with more variance than the original variables (eigenvalues >1). PC scores were calculated for each subject, and inflammatory markers with loading components greater than |0.45| were used to determine the significant contributions to each PC. Associations between tumor metabolites and PCs were determined with linear regressions. Significance for all analyses was determined using p<0.05.RESULTS
Significant concentration changes in alanine (Ala), glutamine (Gln), glutamate (Glu), glutathione (GSH), lactate (Lac), and N-acetylaspartylglutamate (NAAG) + NAA were observed as a function of WHO grade (Table 1). Aspartate (Asp), creatine + phophocreatine, γ-aminobutyric acid (GABA), 2-hydroxyglutarate, and myo-inositol (myo-I) did not change significantly. Inflammatory markers including IL-1B, IL-6, IL-8, and TNF-α concentrations increased significantly with grade (Table 1). PCA resulted in two PCs (PC-1 and PC-2) with eigenvalues greater than 1, with PC-1 containing contributions from IL-1A, IL-1B, IL-6, IL-8, TNF-α, and PC-2 containing the contribution from CRP (Table 2). PC regressions were used to determine associations between inflammation and each of the NMR-measured metabolites (Table 3, Figure 2). Gln, GSH, and Lac concentration ratios were positively associated with PC-1, while myo-I and Asp were positively associated with PC-2.DISCUSSION
Inflammation is a well-characterized property of the tumor microenvironment, but the link between inflammation, metabolic dysregulation, and tumor progression is poorly understood.2 Key inflammatory markers increased significantly with grade and were correlated with metabolite concentration changes. PC-1 was mainly described by IL-8, IL-1B, IL-6, IL-1A, and TNF-α, and positively correlated with Gln, GSH, and Lac, providing evidence of the link between tumor inflammation and metabolic dysregulation. Evidence of inflammation-driven reprogramming of tumor cell metabolism away from a glucose-dependent metabolism to favor a Gln-dependent metabolism is a well-characterized property of many cancers, including gliomas.5 This is supported by our data, as we observed that Gln-associated metabolites including Glu, GSH, Ala, and Lac are all significantly associated with the inflammatory markers represented by PC-1.2,5 While choline measured with in vivo MRS is often used as a tumor biomarker, we did not observe significant associations between choline and the inflammatory PCs. Interestingly, myo-I and Asp were positively associated with PC-2, comprised of CRP with a loading component of 0.819. This is consistent with previous observations that myo-I increases significantly with CRP while other metabolites including NAA and Glu do not.6 These results emphasize the importance of multi-parametric studies in the study of the tumor microenvironment and support the presence of inflammation-driven metabolic reprogramming in gliomas.CONCLUSIONS
We observed significant relationships between tumor metabolites and inflammatory markers in gliomas, consistent with previous research supporting the role of inflammation in metabolic reprogramming. This study illustrates how NMR can be utilized in a study of the tumor microenvironment and provides further evidence for the relationship between inflammation and metabolism in tumor progression.Acknowledgements
The immunoassays were performed with support by the Emory Multiplexed Immunoassay Core (EMIC) and the NIH National Center for Georgia Clinical & Translational Science Alliance (UL1TR002378). Solid-state HRMAS NMR experiments were performed with the support of the Emory NMR Center.References
- Horská A, Barker, P. Imaging of brain tumors: MR spectroscopy and metabolic imaging. Neuroimaging Clin N Am. 2010;20(3):293-310.
- Afrasiabi K, Zhou YH, Fleischman, A. Chronic inflammation: Is it the driver or is it paving the road for malignant transformation? Genes Cancer. 2015;6(5-6):214-219.
- Ferreira LM. Cancer metabolism: The Warburg effect today. Exp Mol Pathol. 2010;89(3):372-380.
- Provencher S.W. Estimation of metabolite concentrations from localized in vivo proton NMR spectra. Magn Reson Med. 1993;30(6):672-679.
- Phan LM, Yeung, SC, Lee, MH. Cancer metabolic reprogramming: importance, main features, and potentials for precise targeted anti-cancer therapies. Cancer Biol Med. 2014;11(1):1–19.
- Eagan DE, Gonzales MM, Tarumi T, Tanaka H, Stautberg S, Haley AP. Elevated serum C-reactive protein relates to increased cerebral myoinositol levels in middle-aged adults. Cardiovasc Psychiatry Neurol. 2012;2012:120540.
Figures
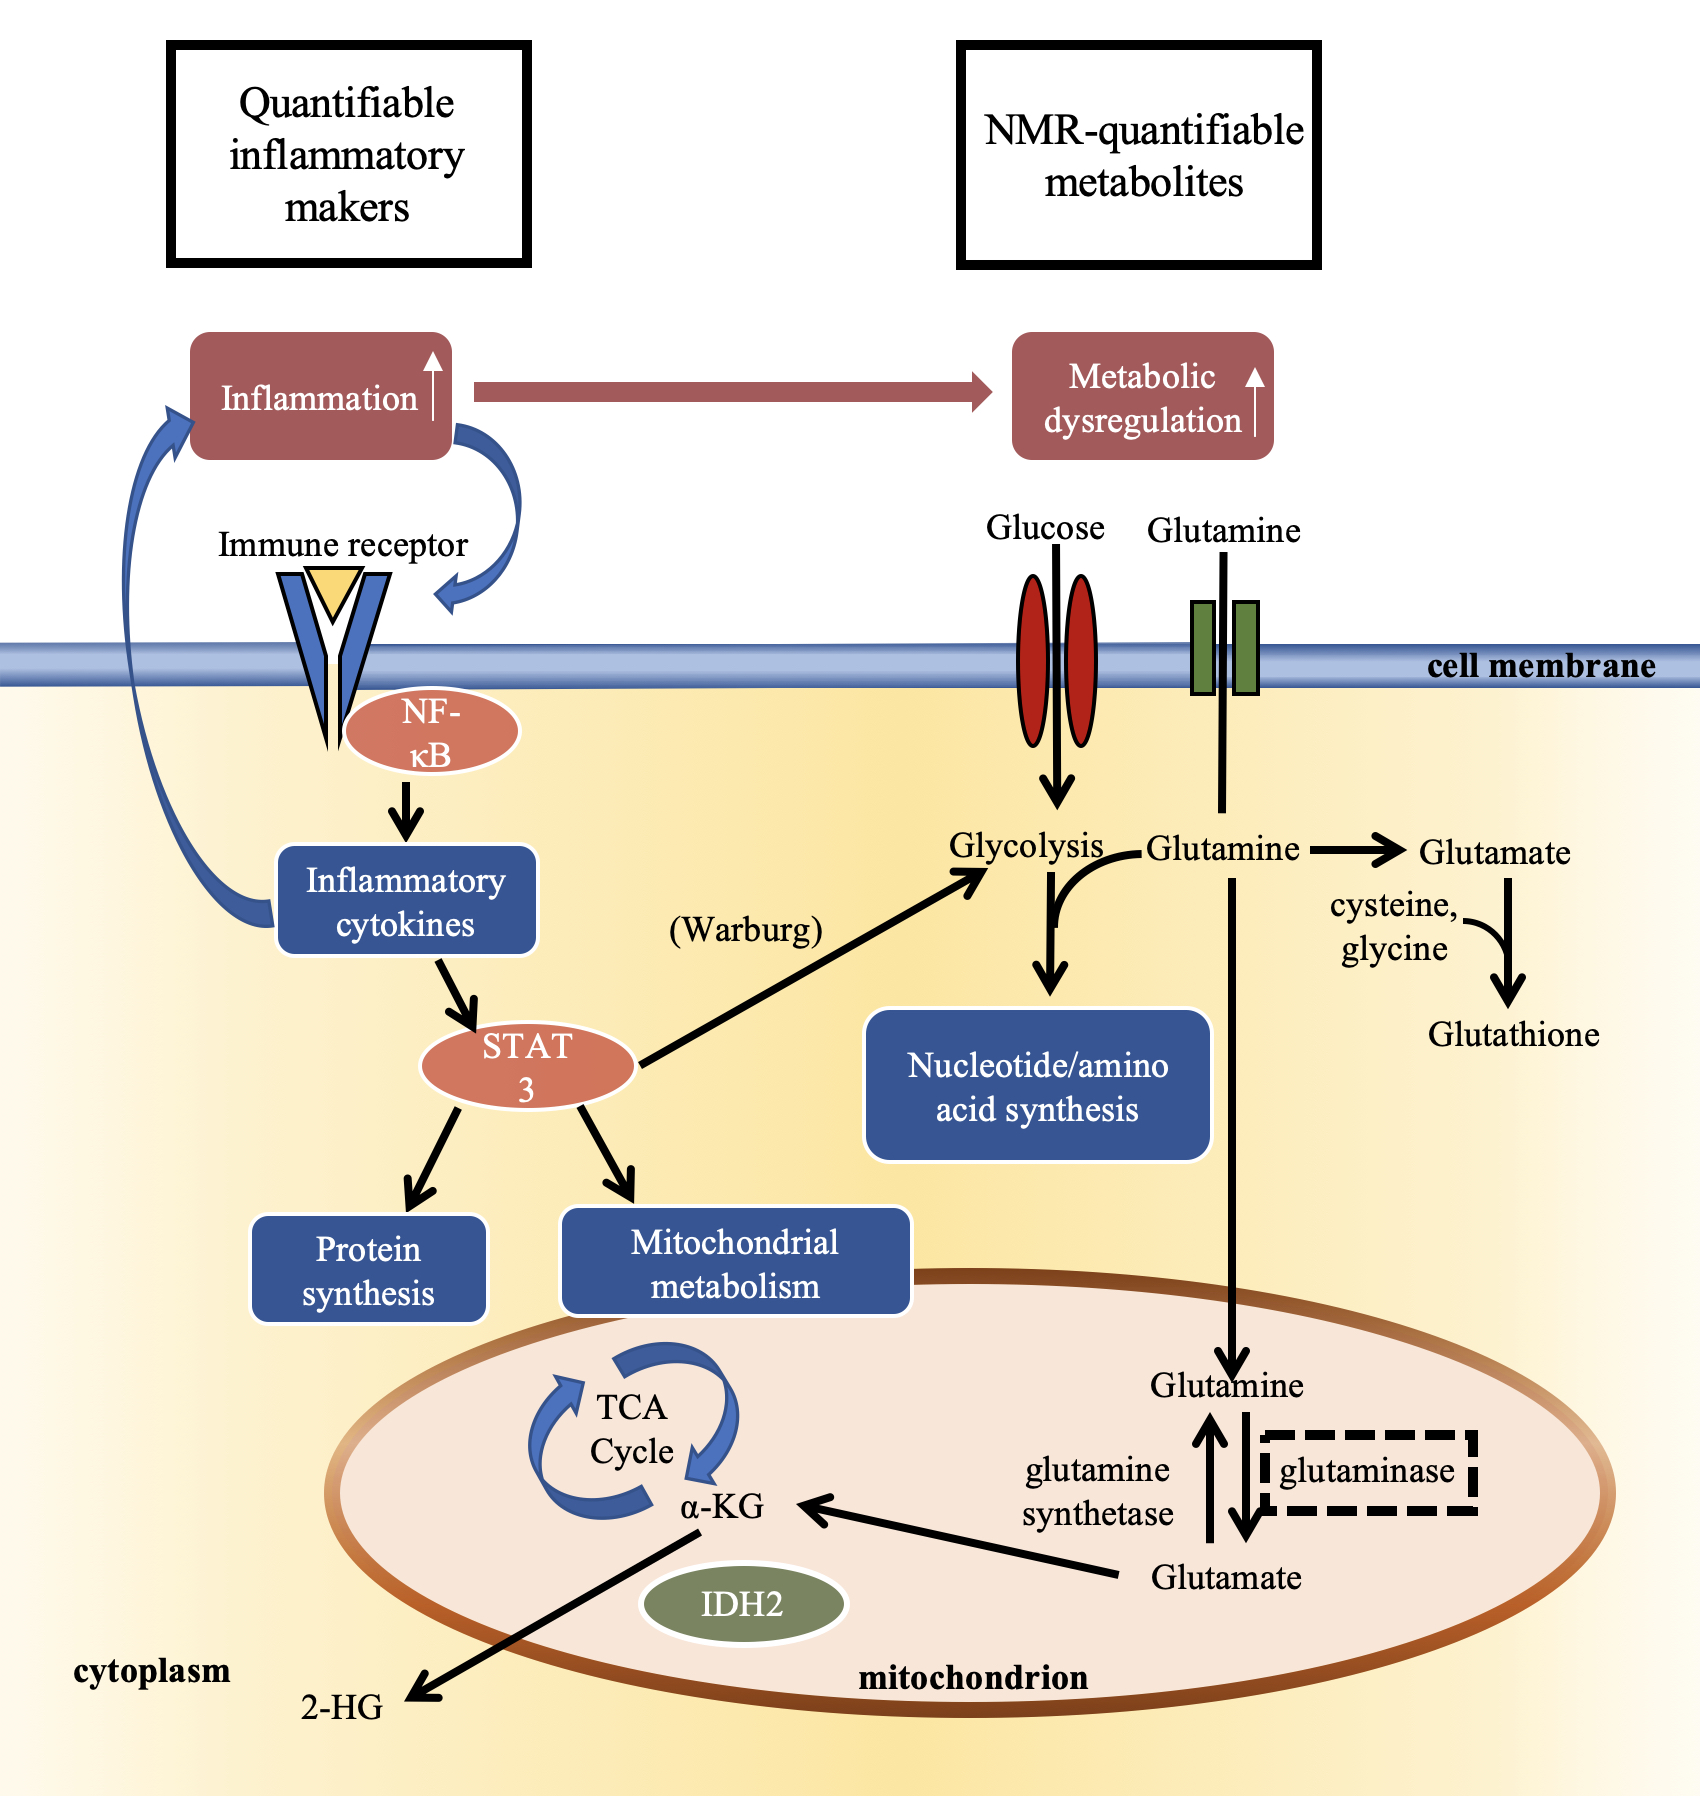
Figure
1. Schematic
representing the relationship between inflammation and metabolic dysregulation
in the tumor microenvironment.
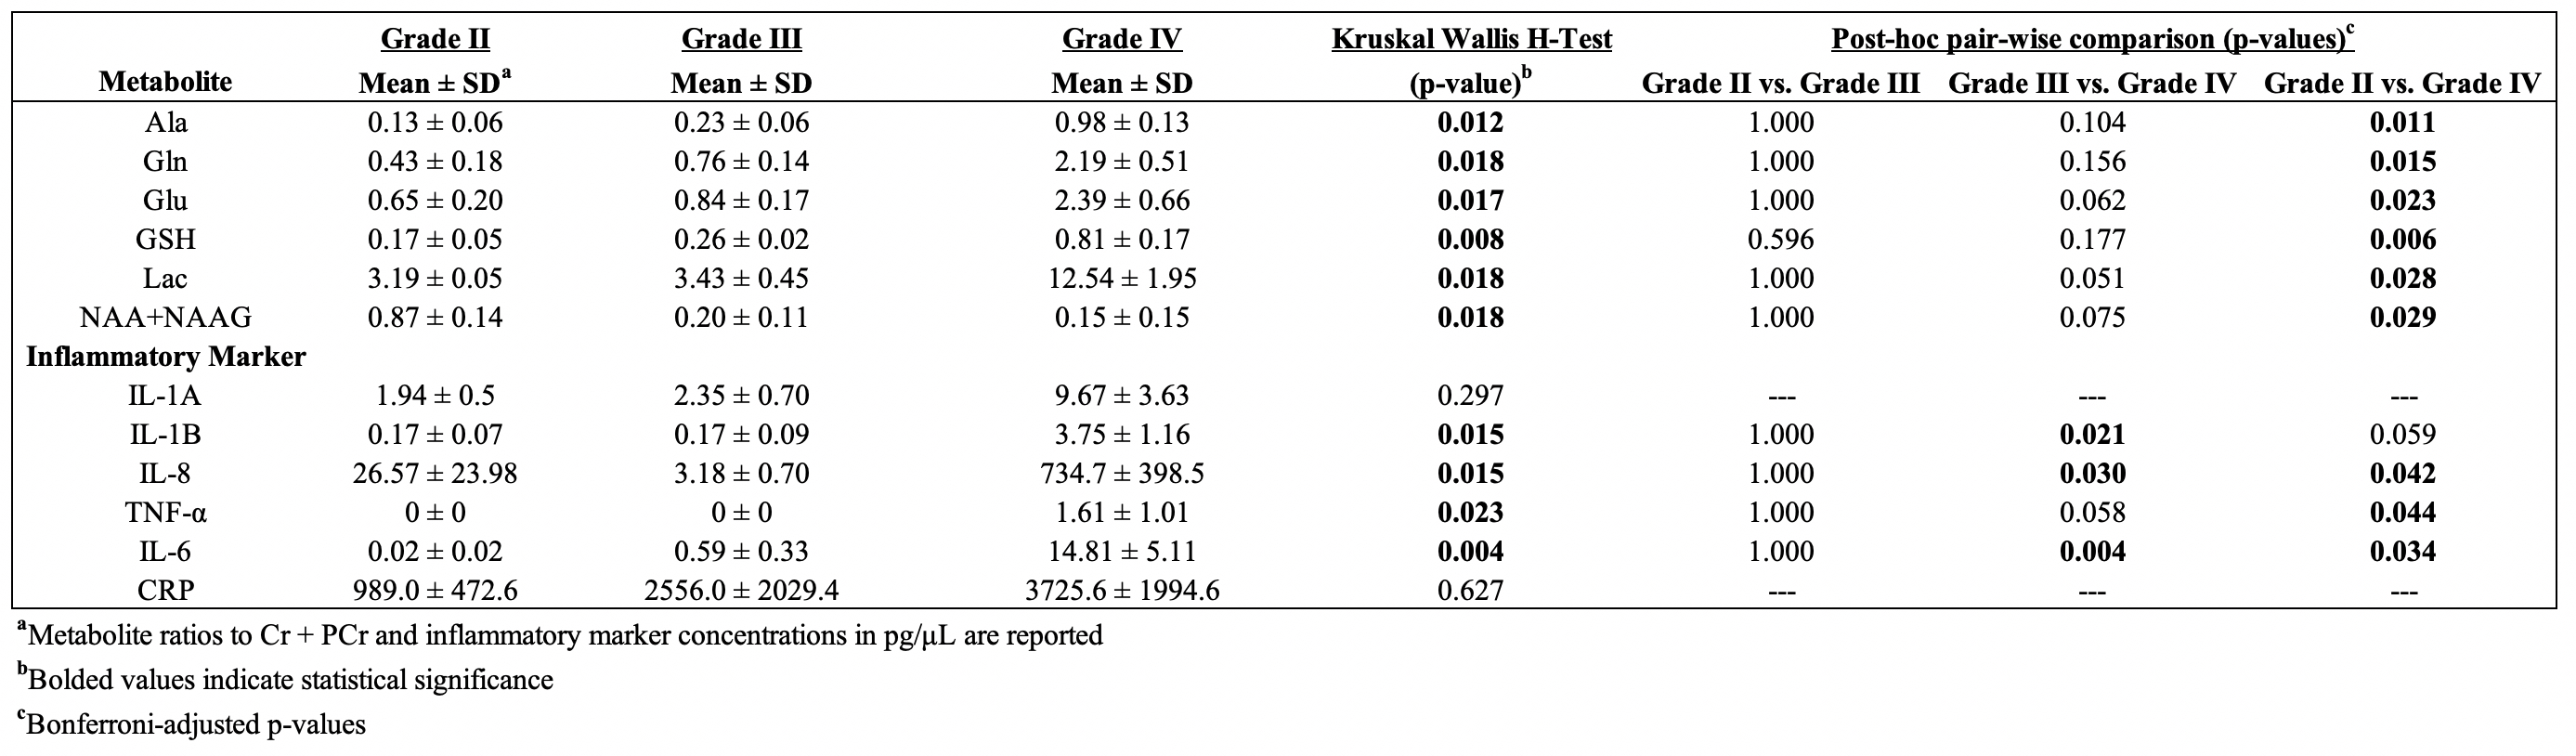
Table 1.
Metabolite concentration ratios and inflammatory markers as a function of WHO
grade
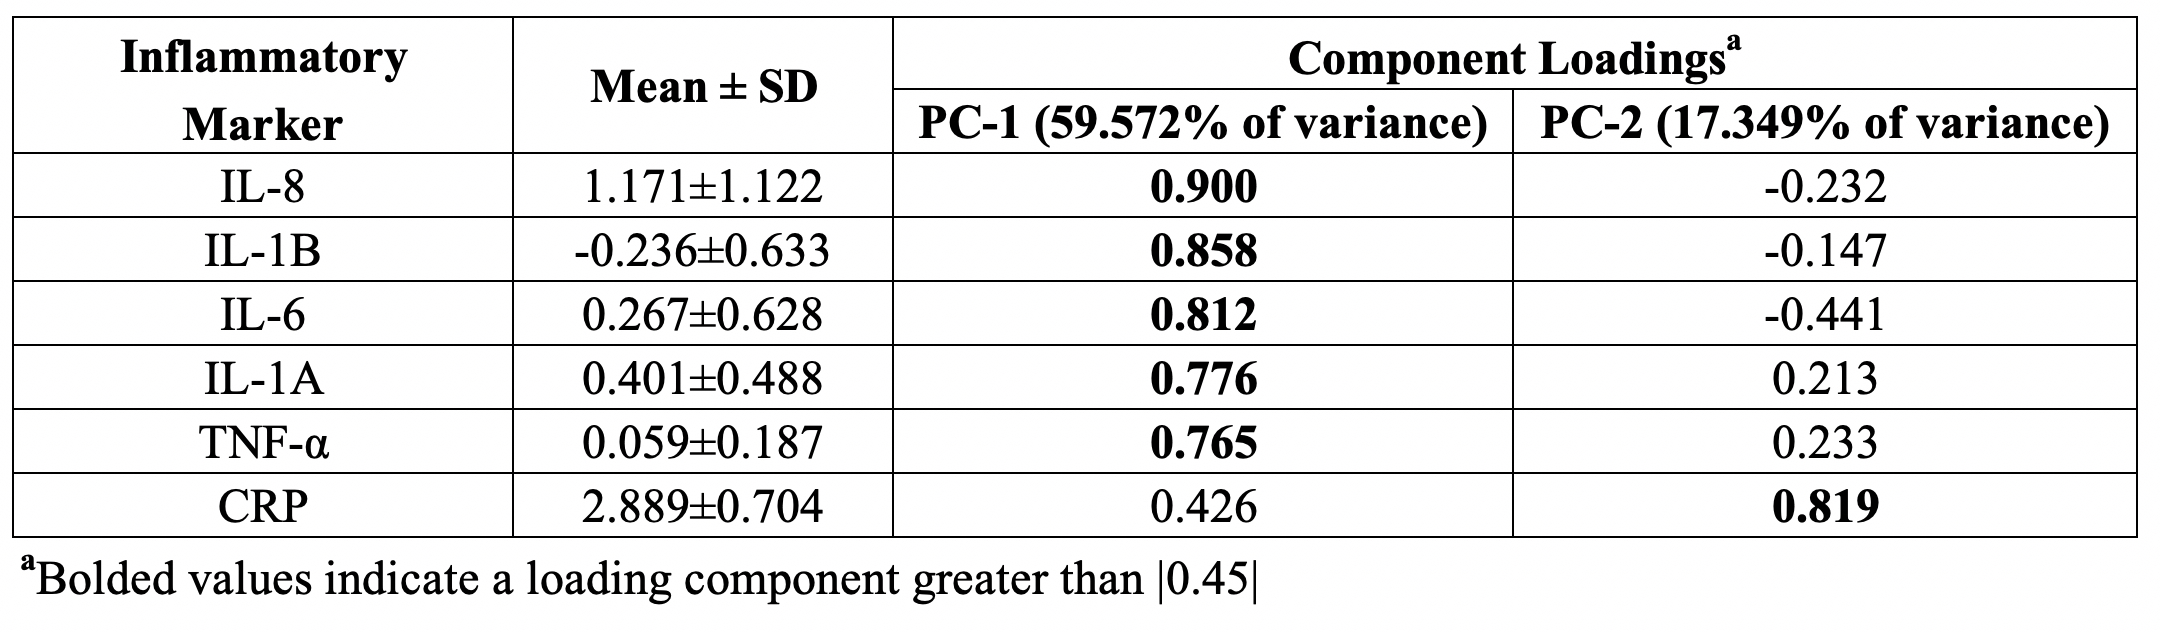
Table 2. Inflammatory
marker loadings onto individual principal components.
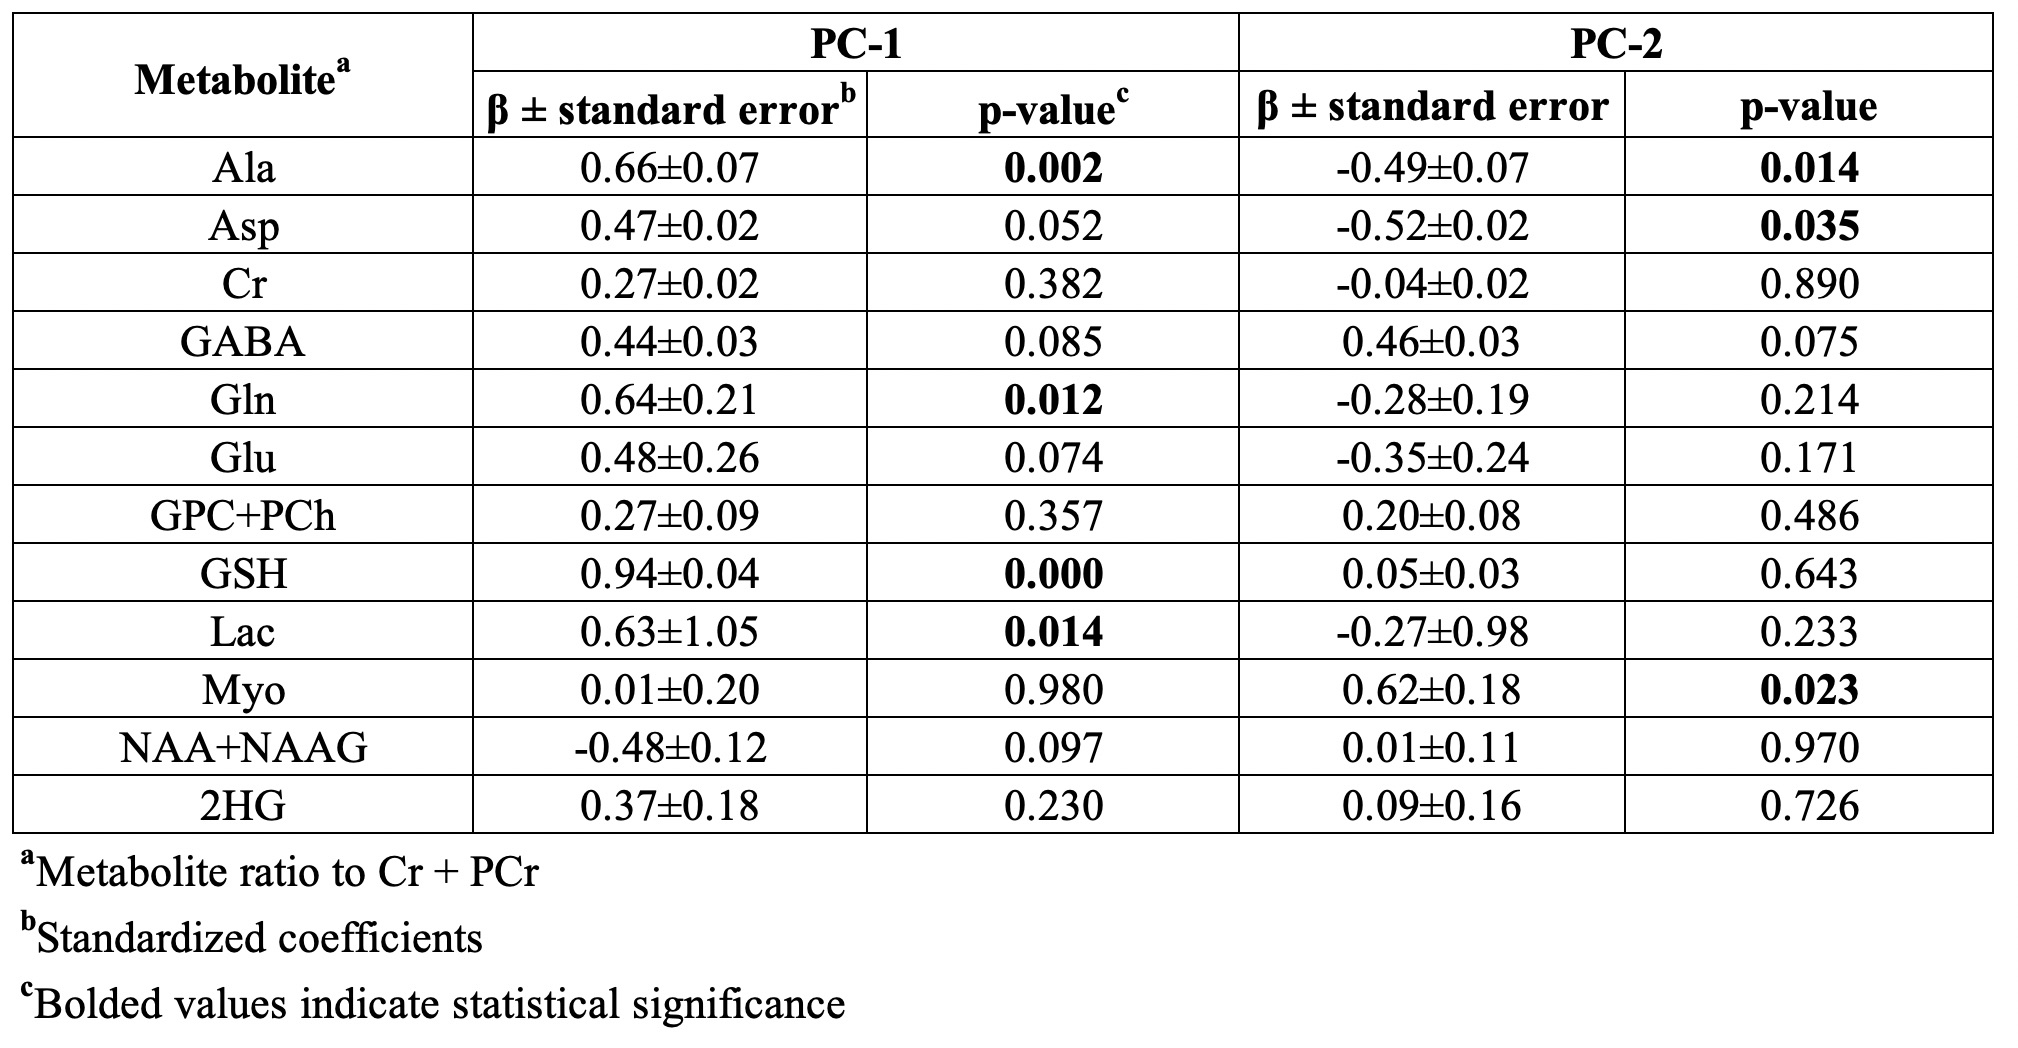
Table 3. Linear regressions of metabolite
concentrations and inflammatory principal component scores.
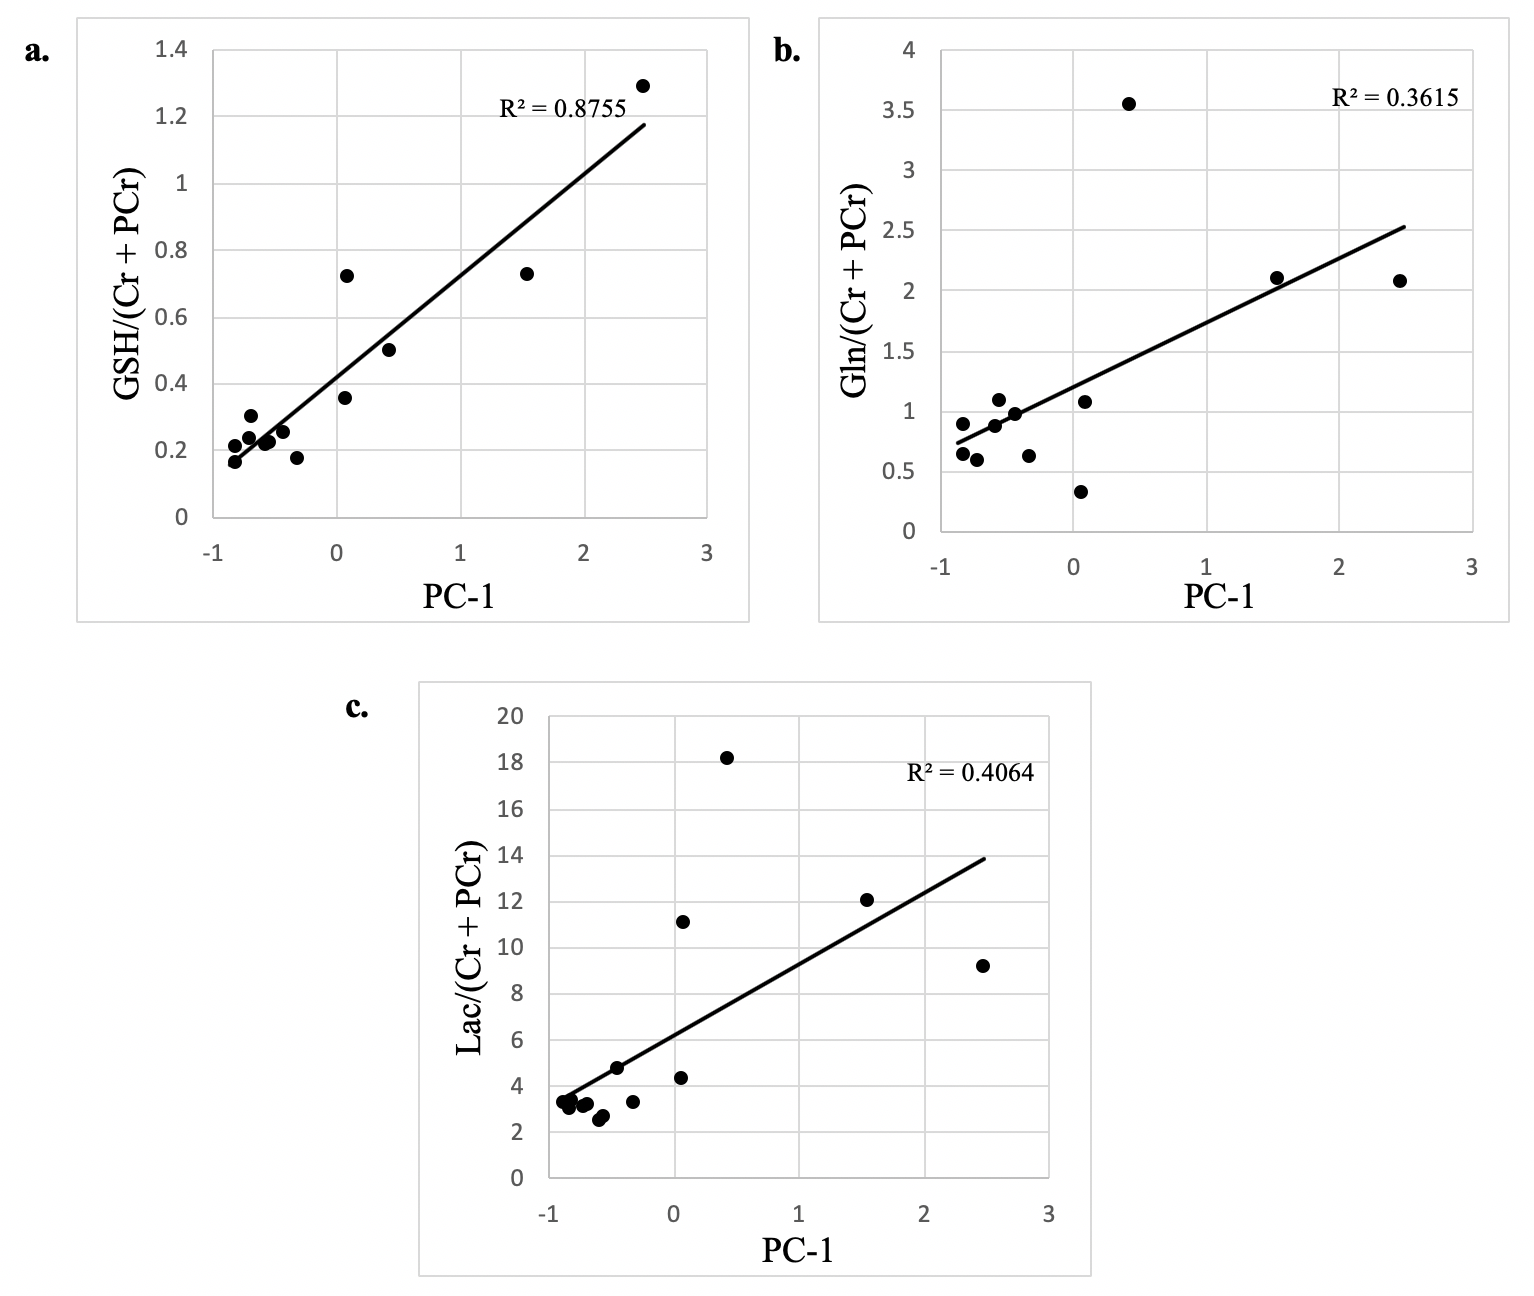
Figure 2. Significant
associations between tumor metabolite concentrations and the first principal component.
PC-1 contains contributions from IL-1A, IL-1B, IL-6, IL-8, and TNF-α.