4808
2-Hydroxyglutarate detection with semi-LASER and MEGA-sLASER at 7T1Radiology, University Medical Center Utrecht, Utrecht, Netherlands, 2School of Health Sciences, College of Health and Human Sciences, Purdue University, West Lafayette, IN, United States
Synopsis
This study evaluates the performance of semi-LASER and MEGA-sLASER for 2-hydroxyglutarate (2-HG) detection at 7T. We compared a semi-LASER with TE of 110ms with editing of 2-HG at 4.02 ppm using MEGA-sLASER with TE of 74ms in phantoms with different concentrations of 2-HG. Both methods were able to detect 2-HG concentrations as low as 0.5mM. MEGA-sLASER provided a clean 2-HG signal. Contrary, the fact that the fitting accuracy for 2-HG in semi-LASER is similar to MEGA-sLASER promotes to choose for a semi-LASER implementation.
Introduction
The onco-metabolite 2-hydroxyglutarate (2-HG), a biomarker of IDH-mutant gliomas1-3, can be detected with 1H-MRS. Assesment of 2-HG is complicated by spectral overlap with other brain metabolites, such as g-aminobutyric acid(GABA), glutamate(Glu) and glutamine(Gln). Therefore, spectral editing at long echo time (TE) and J-difference spectroscopy became of interest to achieve the reliable detection of 2-HG2,3. Recent studies showed measurements of 2-HG at 7T with substantial gain in SNR and spectral resolution, offering higher specificity and sensitivity than 3T as well4. Here we compare spectral editing at long TE and J-difference spectroscopy using TE-optimized semi-LASER5 with MEGA-sLASER for detection of 2-HG at 7T in-vitro to assess the sensitivity of 2-HG detection and robustness against B0 inhomogeneity of each method.Methods
Phantom preparationWe prepared four phantoms (pH=7.2; diameter=4cm) with different concentrations of 2-HG (5, 1.5, 1 and 0.5mM) and Glycine (Gly) (10, 10, 10 , 5mM). Another phantom (pH=7.2; diameter=4cm) was prepared with 2-HG (5mM), GABA (1mM), Glu (5mM), Gln (5mM), NAA (10mM), Creatine (Cr) (10mM) and myo-Inositol (7mM). PBS (Phosphate-buffered saline) was used as buffer solution and the acidity was adjusted using HCl and NaOH to pH7.
Experiments
MR experiments were performed on a 7T MR scanner (Philips, Achieva, Best, NL) equipped with a 32-channel receive-only and 8-channel transmit coil. Semi-LASER voxel localization was used with four FOCI pulses for the semi-LASER and MEGA-sLASER acquisitions (Figure 1). For semi-LASER measurements, we tuned the timing between the pulses to achieve optimized J-coupling patterns for 2-HG at a TE of 110ms5. For MEGA-sLASER, the 2-HG Hα resonance (Figure 1C) was edited at echo time of 74ms using a 13.9ms Gaussian RF pulse tuned to 1.78 and 7.38ppm respectively, i.e. shifted -0.12ppm from the in vivo values of 1.9 and 7.5 ppm, because of the lower temperature of the phantom. The number of averages (64), TR (5s), spectral bandwidth (6kHz), voxel size (8cm3 isotropic) and voxel orientation for all experiments were kept the same. We used VAPOR water suppression and automatic volume shimming using second order shim terms. Additionally, we assessed the performance of the two methods in less optimal shimming condition, as to mimic in-vivo experiments. The local B0 field in the voxel was perturbed by changing the z-component of the shim gradients.
Preprocessing and Analysis
Channel combination, frequency and phase alignment of the data was performed with the FID-A toolbox6. For MEGA-sLASER, the on and off spectra were subtracted after alignment and averaging. Spectral simulation was done using the Vespa library of pyGAMMA7 for creating the basis sets for LCModel analysis8. Spectra were analyzed using LCModel. Differences in T1 and T2 relaxation times were ignored.
Results
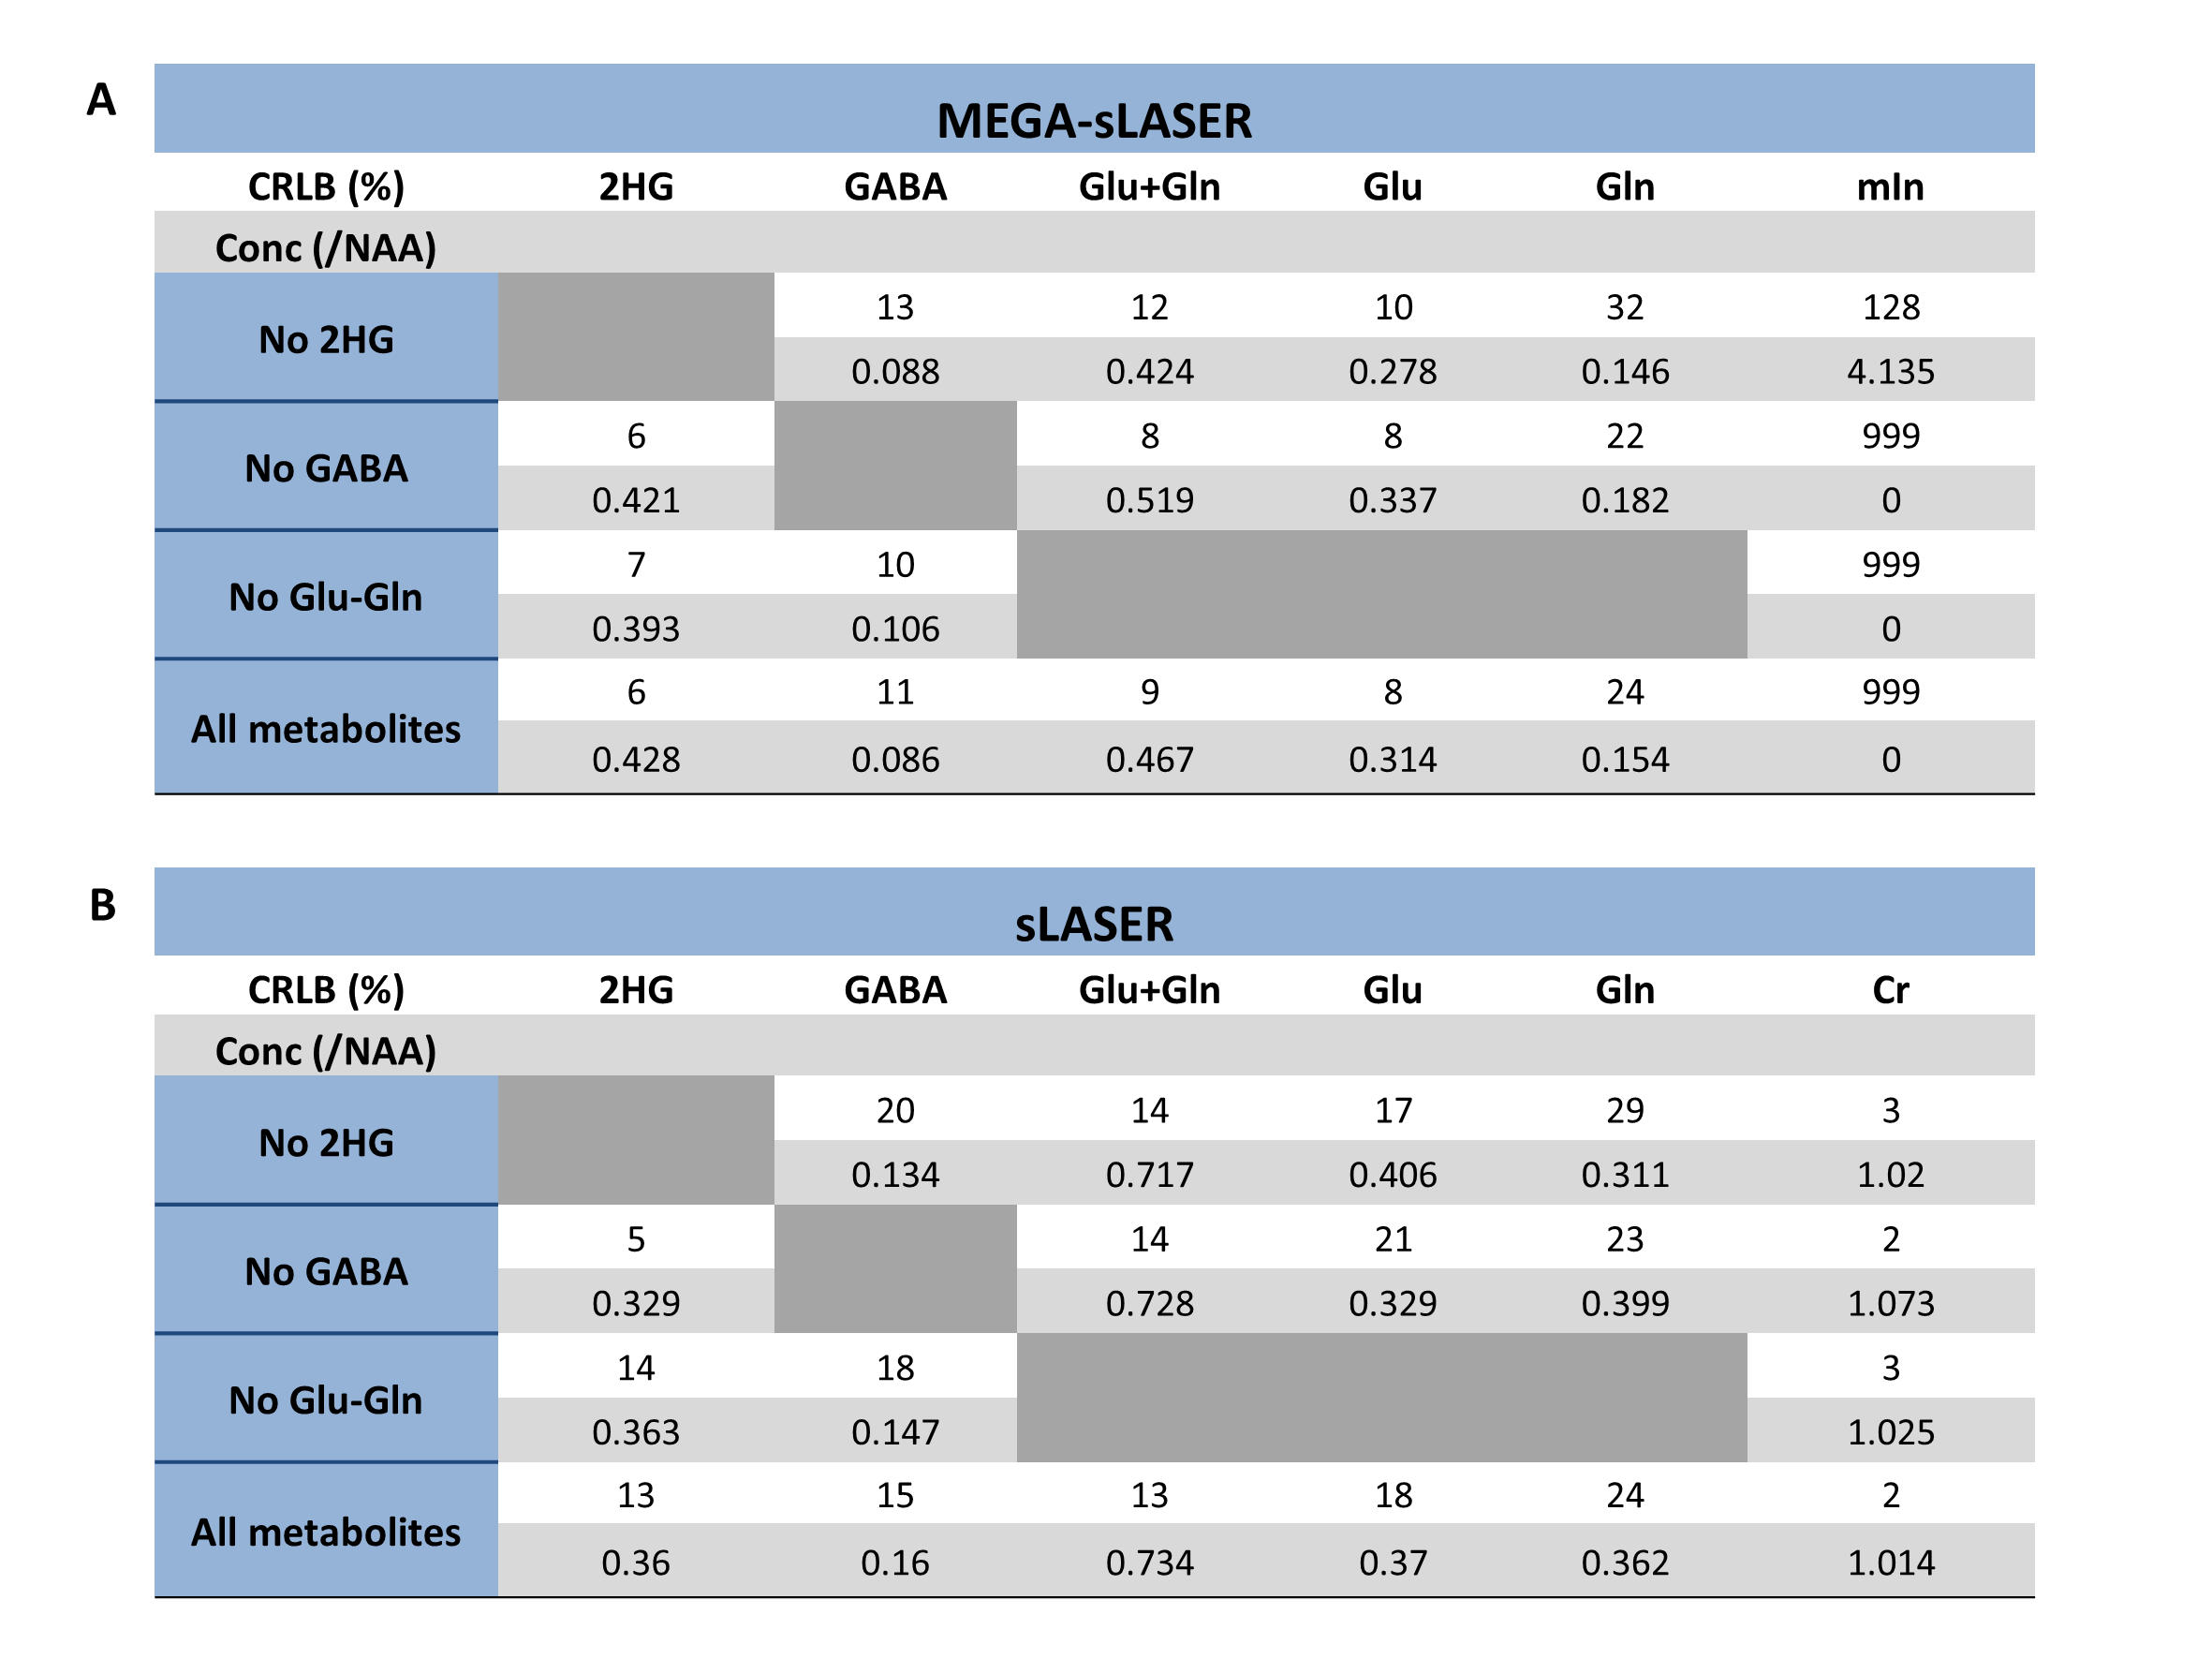
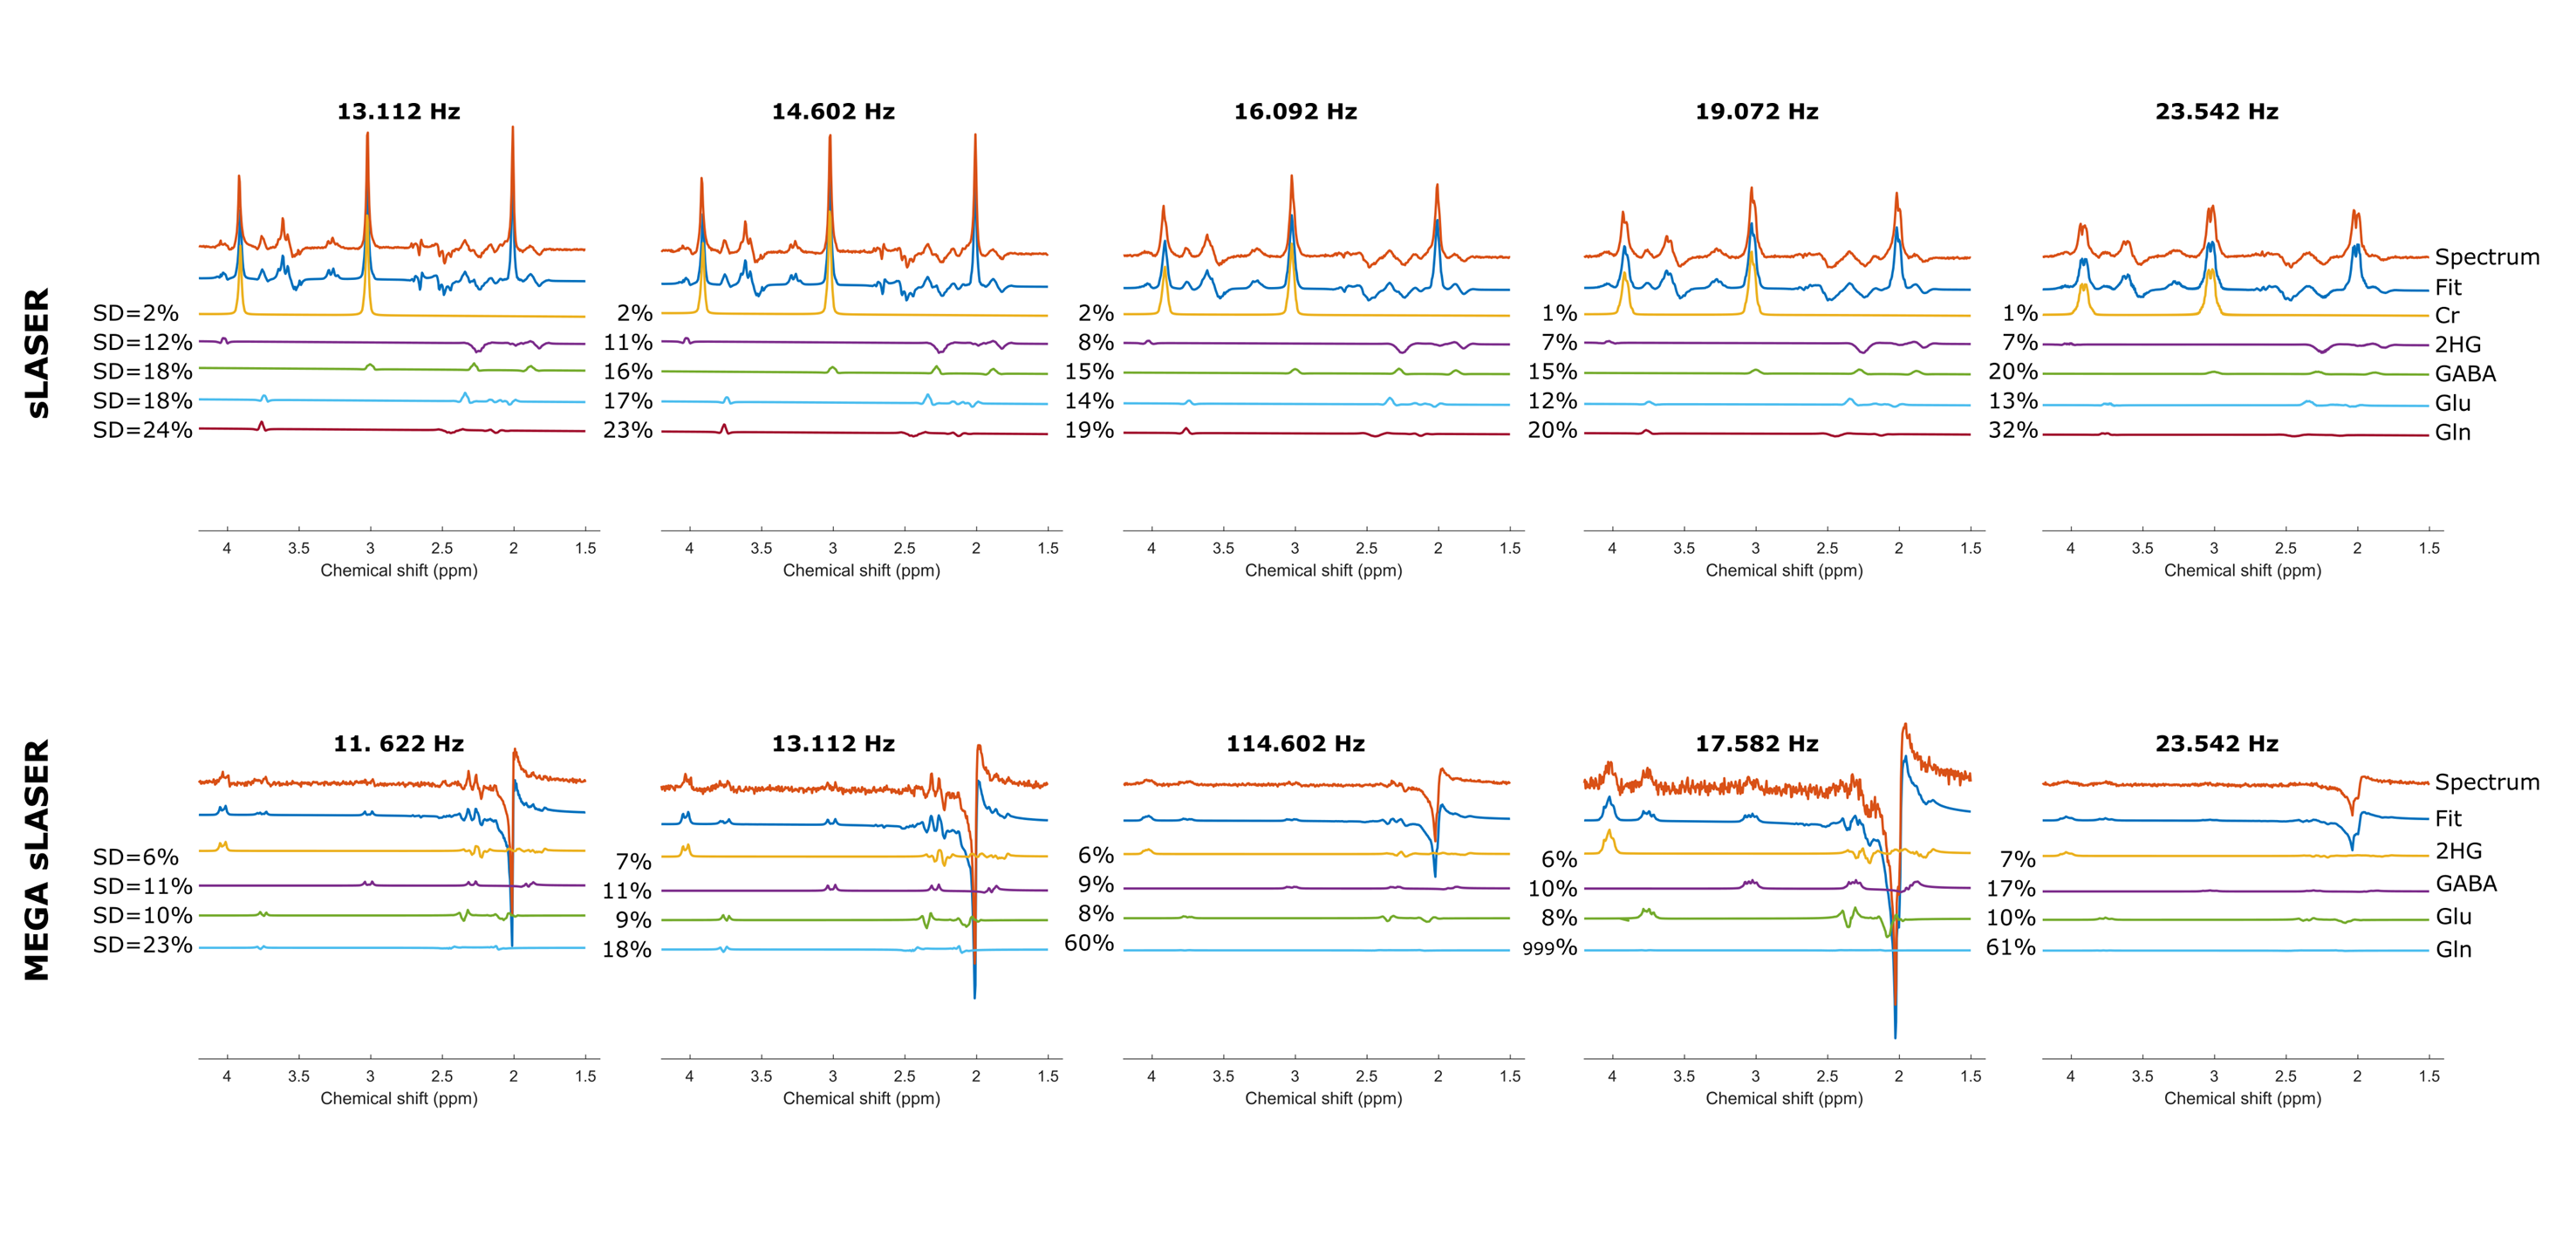
In both techniques, 2-HG can be detected with CRLB(%) of less than 30%. In MEGA-sLASER, the reported CRLB (%) of 2-HG for all the phantoms is higher than semi-LASER (Figure 2A). In Figure 2B, the ratio of detected 2-HG/Gly is plotted as a function of number of averages (NSA). Note that the error bar on the point represent the confidence interval of the concentration according to the fit accuracy (% CRLB). At low concentrations, MEGA-sLASER exhibits high variations in the 2-HG/Gly ratio. For 2-HG concentrations of 1mM and higher, both methods converge to the same value from 16 NSA and higher. When the signal of 2-HG overlaps with metabolite signals of GABA, Glu and Gln, MEGA-sLASER leads to detection of 2-HG with relative concentration (/NAA) of 0.41 and CRLB of 6% compared to 0.36 and 13% with sLASER as shown in Figure 3.Table1.1 and 1.2 summarize the effect of metabolite signal overlap on CRLB% and concentration by removing the relevant metabolites from the basis set. It shows that removing GABA or 2-HG from the basis set has very negligible or even no influence on detecting 2-HG using MEGA-sLASER, while it does influence the detection of 2-HG using semi-LASER. Removing Glu and Gln from the basis set has almost no influence on quantification of 2-HG in semi-LASER. Figure 4 demonstrates that the CRLB for the 2-HG, Glu, Gln fit remains rather stable in MR spectra with increasing line width in both sequences.
Discussion and conclusions
The sensitivity of the two methods for 2-HG detection was assessed with four phantoms containing 2-HG with different concentrations, revealing semi-LASER as more sensitive for 2-HG detection. Both methods were able to detect 2-HG concentrations as low as 0.5mM, however 64 averages were needed. Despite the fact that the MEGA-sLASER provides a clean 2-HG signal, the fitting accuracy for 2-HG in spectra with broader line widths was not better for MEGA-sLASER. Contrary, the fact that the fitting accuracy for 2-HG in semi-LASER is similar to MEGA-sLASER promotes to choose for a semi-LASER implementation. Also, semi-LASER is a simpler implementation and retains signals from all other metabolites. Note that overlapping resonances from GABA, Glu and Gln combined with poorer shim conditions in brain tumor tissue may be more problematic than presented here in phantoms. If so, this would mainly effect 2-HG detection with semi-LASER, since the edited 2-HG signal at 4.0 ppm using MEGA-semi-LASER is uniquely generated via the J-couplings of 2-HG.Acknowledgements
We like to thank Eurostars IMAGINE for financial support.References
1. Pope WB, Prins RM, Thomas MA, Nagarajan R, Yen KE, Bittinger MA, Salamon N, Chou AP, Yong WH, Soto H, Wilson N, Driggers E, Jang HG, Su SM, Schenkein DP, Lai A, Cloughesy TF, Kornblum HI, Wu H, Fantin VR, Liau LM. Non-invasive detection of 2-hydroxyglutarate and other metabolites in IDH1 mutant glioma patients using magnetic resonance spectroscopy. J Neurooncol. 2012 Mar;107(1):197–205.
2. Choi C, Ganji SK, DeBerardinis RJ, Hatanpaa KJ, Rakheja D, Kovacs Z, Yang X-L, Mashimo T, Raisanen JM, Marin-Valencia I, Pascual JM, Madden CJ, Mickey BE, Malloy CM, Bachoo R, Maher EA. 2-hydroxyglutarate detection by magnetic resonance spectroscopy in IDH-mutated glioma patients. Nat Med. 2012 Jan 26;18(4):624–629.
3. Andronesi OC, Kim G, Gerstner E, Batchelor T, Tzika AA, Fantin VR, Heiden MGV, Sorensen AG. Detection of 2-Hydroxyglutarate in IDH-mutated Glioma Patients by Spectral-editing and 2D Correlation Magnetic Resonance Spectroscopy. Sci Transl Med. 2012 Jan 11;4(116):116ra4.
4. Berrington A, Voets NL, Larkin SJ, de Pennington N, Mccullagh J, Stacey R, Schofield CJ, Jezzard P, Clare S, Cadoux-Hudson T, Plaha P, Ansorge O, Emir UE. A comparison of 2-hydroxyglutarate detection at 3 and 7 T with long-TE semi-LASER. NMR Biomed. 2018;31(3).
5. Emir UE, Larkin SJ, de Pennington N, Voets N, Plaha P, Stacey R, Al-Qahtani K, Mccullagh J, Schofield CJ, Clare S, Jezzard P, Cadoux-Hudson T, Ansorge O. Noninvasive Quantification of 2-Hydroxyglutarate in Human Gliomas with IDH1 and IDH2 Mutations. Cancer Res. 2016 Jan 1;76(1):43-9.
6. Simpson R, Devenyi GA, Jezzard P, Hennessy TJ, Near J. Advanced processing and simulation of MRS data using the FID appliance (FID-A)-An open source, MATLAB-based toolkit. Magn Reson Med. 2017;77(1):23-33. doi:10.1002/mrm.26091.
7. Soher BJ, Semanchuk P, Todd D, Steinberg J, Young K, Vespa: Integrated applications for RF pulse design, spectral simulation and MRS data analysis. Proceedings 19th Scientific Meeting, International Society for Magnetic Resonance in Medicine; Quebec, Canada. 2011; p. 1410
8. Provencher SW. Estimation of metabolite concentrations from localized in vivo proton NMR spectra. Magn Reson Med. 1993;30(6):672-679.
9. Jalbert L, Elkhaled A, Srinivasan R, et al. Presence of 2-hydroxyglutarate in IDH1 mutated low-grade glioma using ex vivo proton HR-MAS spectroscopy. In: Proceedings of the 19th Annual Meeting of the International Society for Magnetic Resonance in Medicine; 2011; Montreal, Quebec, Canada. p. 183.
Figures