4805
Lipid composition in breast tumours using double quantum filtered correlation spectroscopy is associated with lymphovascular invasion (LVI)1Aberdeen Biomedical Imaging Centre, University of Aberdeen, Aberdeen, United Kingdom, 2Pathology Department, Aberdeen Royal Infirmary, Aberdeen, United Kingdom, 3Breast Unit, Aberdeen Royal Infirmary, Aberdeen, United Kingdom
Synopsis
Lymphovascular invasion (LVI) is associated with increased recurrence and metastatic risk in breast cancer. LVI amplifies the impact of genetic mutations on lipid regulation, leading to the deregulation of lipid composition. Currently LVI is estimated using the biopsy sample, while definitive LVI can only be determined after surgery, precluding patients on neoadjuvant chemotherapy or hormonal treatment. Double quantum filtered correlation spectroscopy (DQF-COSY) is a method capable of accurate non-invasive lipid composition quantification. We therefore examined the role of lipid composition using DQF-COSY in differentiating the status of LVI.
Introduction
Lipid composition, the balance among fatty acids (FA), has recently emerged as a potential predictor of breast cancer1. Saturated FA (SFA), monounsaturated FA (MUFA) and polyunsaturated FA (PUFA) have been shown to be involved in angiogenesis2-4, modulated during malignant transformations. Lymphovascular invasion (LVI)5 is associated with increased risk of recurrence and metastasis6. Currently LVI is assessed provisionally using the biopsy sample, while definitive LVI can only be determined after surgery7. Conventional magnetic resonance spectroscopy (MRS) suffers from overlap of nearby lipid and water peaks, and is insufficient for accurate lipid composition quantification. In this study, we conducted 2D double quantum filtered correlation spectroscopy (DQF-COSY)8 on whole breast tumour specimens to examine the role of lipid composition in LVI.Methods
Thirty patients (age 39 - 78 years, 13 LVI negative and 17 LVI positive), with invasive ductal carcinoma and undergoing surgical intervention as primary treatment, were enrolled into the study. Patients with tumour size less than 1 cm on ultrasound, undergoing chemotherapy or hormonal therapy were not eligible. Upon excision, the whole fresh tumour specimen was immediately transported to the imaging centre for MRS scan. Once the scan was completed, the fresh specimen was transported to Pathology Department for formalin treatment and histopathological analysis. LVI status was confirmed upon formation of tumour embolus in lymphatic space or overexpression of cellular marker D2-409. Tumour size, grade, lymph node involvement, as well as tumour proliferative marker Ki-67 expression and Nottingham Prognostic Index (NPI) were also determined (Figure 1). The study was approved by the North West – Greater Manchester East Research Ethics Committee (REC Ref: 16/NW/0032), and written informed consent was obtained from all patients prior to the MRS study.MRS Acquisition
All data were acquired on a 3.0 T whole body clinical MRI scanner (Achieva TX, Philips Healthcare, Best, Netherlands) using a body coil for uniform transmission and a 32-channel receiver coil for high sensitivity detection. T1-weighted anatomical images were acquired using standard 3D sequence10 with matrix size of 220 × 220, an isotropic voxel size of 1 mm, echo time (TE) of 2.7 ms, repetition time (TR) of 5.2 ms, and imaging volume encompassing the whole specimen. 2D MRS lipid spectra were acquired from a single voxel snug fit to the tumour using DQF-COSY8 with TR of 552 ms, initial TE of 25 ms, a t1 increment of 1 ms, 256 increments and spectral bandwidth of 1000 Hz.
Data Processing
All 2D spectral data were quantified in Felix software (v2007, Accelrys Inc., San Diego, USA), with zerofilling to 512 points and sine bell apodisation applied to both dimensions8. SFA and glycerides were quantified as the volume of the diagonal peak at (1.3,1.3) ppm and (4.3,4.3) ppm respectively. MUFA and PUFA were quantified as the volume of the cross peak at (5.3,2.1) ppm and (5.3,2.8) ppm respectively. All lipid volumes were referenced to methyl fat peak at (0.9,0.9) ppm1,11.
Statistical Analysis
Statistical analysis was performed in the SPSS software (Release 23.0, SPSS Inc., Chicago, IL, USA). Mann Whitney U tests were used for all non-normally distributed lipid composition data. Spearman’s correlation tests were performed between lipid composition and Ki-67 in the entire cohort. A p value <0.05 was accepted as being statistically significant.
Results
The patient demographics are summarised in Table 1, and there were no significant differences in age, body mass index and tumour size between LVI positive and LVI negative patients. There was a significant higher MUFA (p = 0.0189) in LVI negative (median: 0.63, interquartile range (IQR): 0.49 – 0.96) than LVI positive (median: 0.37, IQR: 0.25 – 0.64) (Table 2, Figure 2a). There were significant higher glycerides (p = 0.0226) in LVI negative (median: 2.5, IQR: 1.92 – 4.15) than LVI positive (median: 1.32, IQR: 0.95 – 2.43) (Table 2, Figure 2b). There was a significant higher SFA (p = 0.0491) in LVI negative (median: 1.22, IQR: 1.13 – 1.26) than LVI positive (median: 0.95, IQR: 0.88 – 1.26) (Table 2, Figure 2c). There was no significant difference in PUFA (p = 0.0998) between LVI negative (median: 0.28, IQR: 0.21 – 0.32) and LVI positive (median: 0.23, IQR: 0.10 – 0.28) (Table 2, Figure 2d). There were no significant correlations between lipid components and Ki-67 expression (Table 2, Figures 3a – 3d).Discussion
We showed LVI-associated lipid composition deregulation in breast cancer through non-invasive measurement of lipid profiles. There was a reduction in MUFA, glycerides and SFA in LVI positive tumours, supporting recent evidence that lipogenesis is replaced by lipolysis within the tumour to release essential building blocks for growth2, particularly during the later stage of tumour progression as characterised by LVI development12,13. The breakdown of glycerides facilitates the accelerated conversion of SFA to MUFA, reducing SFA lipotoxicity and yielding membrane phospholipids14 for tumour progression. Our work illustrated the significant role of lipid composition in cancer aggressiveness and hence the value in breast cancer monitoring and prognosis.Conclusion
Lipid composition quantified using DQF-COSY is a sensitive marker of LVI, in turn providing a potential prognostic tool for identifying patients with high risk of recurrence.Acknowledgements
The authors would like to thank Mr Nicholas Senn for conducting data auditing, Dr Matthew Clemence for clinical scientist support, Dr Tim Smith for biologist support, Ms Bolanle Brikinns for patient recruitment support, Ms Dawn Younie for logistic support, Prof Andrew M Blamire for advice on MRS. This project was funded by Friends of Aberdeen and North Centre for Haematology, Oncology and Radiotherapy (ANCHOR), and Sai Man Cheung was jointly supported by Elphinstone scholarship, Roland Sutton Academic Trust and John Mallard scholarship. Vasiliki Mallikourti’s PhD study is supported by Tenovus Scotland PhD studentship.References
1. Ramadan S, Arm J, Silcock J, et al. Lipid and Metabolite Deregulation in the Breast Tissue of Women Carrying BRCA1 and BRCA2 Genetic Mutations. Radiology. 2015;275(3):675-682.
2. Menendez JA, Lupu R. Fatty acid synthase and the lipogenic phenotype in cancer pathogenesis. Nat Rev Cancer. 2007;7(10):763-777.
3. Christiansen A, Detmar M. Lymphangiogenesis and Cancer. Genes & Cancer. 2011;2(12):1146-1158.
4. Schoors S, Bruning U, Missiaen R, et al. Fatty acid carbon is essential for dNTP synthesis in endothelial cells. Nature. 2015;520(7546):192-197.
5. Klahan S, Wong HS-C, Tu S-H, et al. Identification of genes and pathways related to lymphovascular invasion in breast cancer patients: A bioinformatics analysis of gene expression profiles. Tumor Biol. 2017;39(6):101042831770557-101042831770558.
6. Mamounas EP, Anderson SJ, Dignam JJ, et al. Predictors of Locoregional Recurrence After Neoadjuvant Chemotherapy: Results From Combined Analysis of National Surgical Adjuvant Breast and Bowel Project B-18 and B-27. Journal of Clinical Oncology. 2012;30(32):3960-3966.
7. Sharifi S, Peterson MK, Baum JK, Raza S, Schnitt SJ. Assessment of pathologic prognostic factors in breast core needle biopsies. Modern Pathology. 1999;12(10):941-945.
8. Prescot AP, Dzik- Jurasz ASK, Leach MO, Sirohi B, Powles R, Collins DJ. Localized COSY and DQF-COSY 1H-MRS sequences for investigating human tibial bone marrow in vivo and initial application to patients with acute leukemia. J Magn Reson Imaging. 2005;22(4):541-548.
9. Zaorsky NG, Patil N, Freedman GM, Tuluc M. Differentiating Lymphovascular Invasion from Retraction Artifact on Histological Specimen of Breast Carcinoma and Their Implications on Prognosis. J Breast Cancer. 2012;15(4):478–3.
10. Thomassin-Naggara I, Trop I, Lalonde L, David J, Péloquin L, Chopier J. Tips and techniques in breast MRI. Diagnostic and Interventional Imaging. 2012;93(11):828-839.
11. Thomas MA, Lipnick S, Velan SS, et al. Investigation of breast cancer using two-dimensional MRS. NMR Biomed. 2009;22(1):77-91.
12. Nomura DK, Long JZ, Niessen S, Hoover HS, Ng S-W, Cravatt BF. Monoacylglycerol Lipase Regulates a Fatty Acid Network that Promotes Cancer Pathogenesis. Cell. 2010;140(1):49-61.
13. Luo X, Cheng C, Tan Z, et al. Emerging roles of lipid metabolism in cancer metastasis. Mol Cancer. 2017;16:76.
14. Igal RA. Stearoyl-CoA desaturase-1: a novel key player in the mechanisms of cell proliferation, programmed cell death and transformation to cancer. Carcinogenesis. 2010;31(9):1509-1515.
Figures
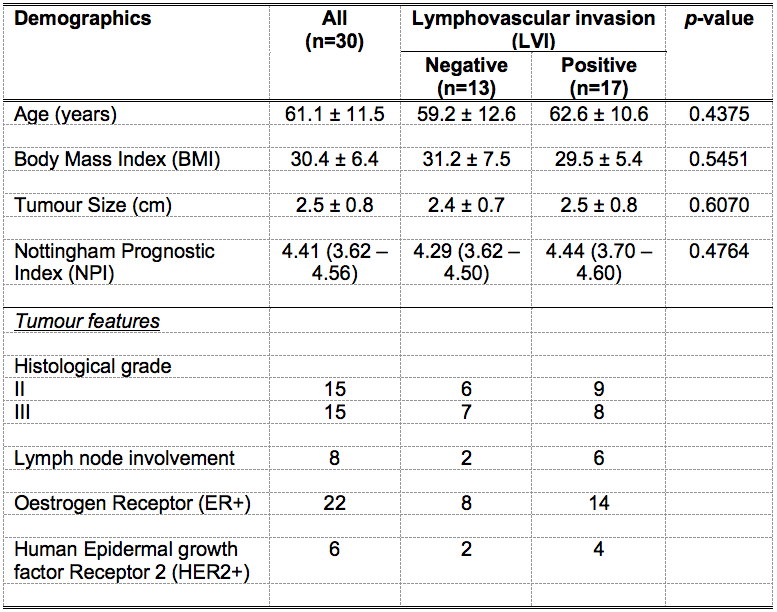
Table 1. Patient characteristics.
Descriptive statistics of breast cancer patients with histopathological findings are shown for each group and the entire cohort. Numbers are expressed as mean and standard deviation (apart from Nottingham Prognostic Index where median and interquartile range are shown), with pathological entries expressed as number of positive observations.
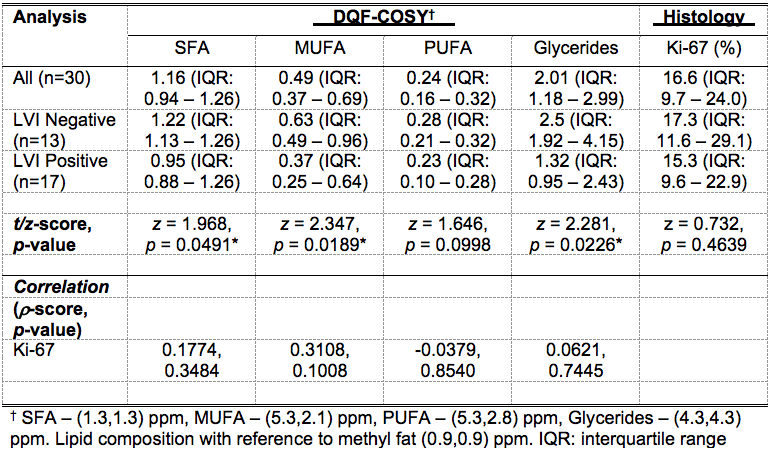
Table 2. Lipid composition and histological marker Ki-67.
Lipid composition and tumour proliferative marker Ki-67 expression are shown for groups and the entire cohort. Correlation scores (Spearman’s rho (ρ)) of lipid composition, measured in double quantum filtered correlation spectroscopy (DQF-COSY), against Ki-67 are also shown. Lipid composition was quantified as saturated fatty acids (SFA), monounsaturated FA (MUFA), polyunsaturated FA (PUFA) and glycerides with reference to methyl fat at (0.9,0.9) ppm. Significant findings are marked by ‘*’.
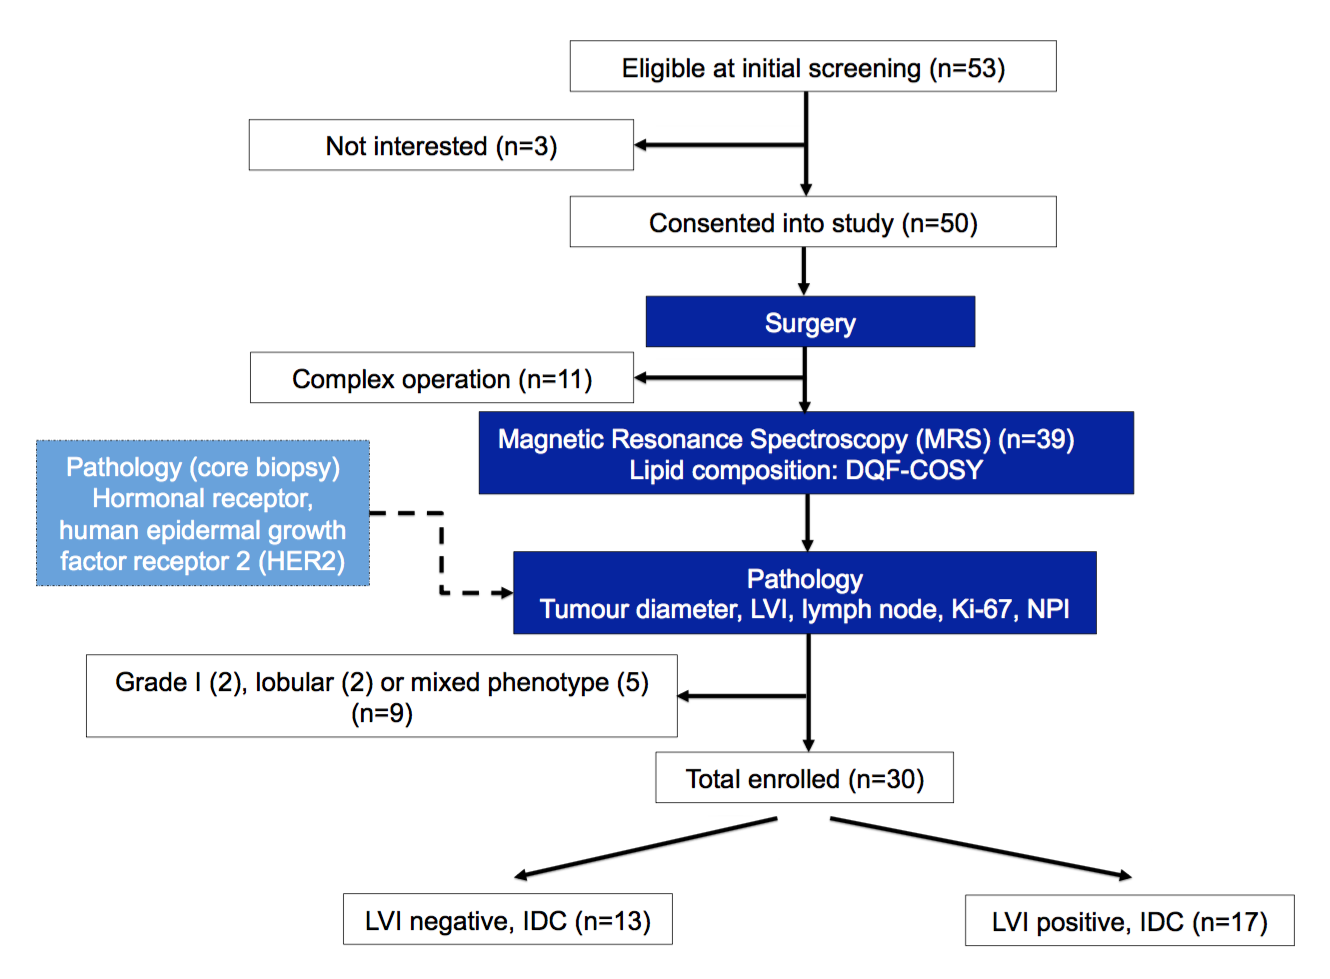
Figure 1. Study design.
A two-group cross sectional research study design is shown in a flow chart. Freshly excised tumours from wide local excision or mastectomy were immediately scanned on a clinical 3.0 T MRI scanner to derive lipid composition using double quantum filtered–correlation spectroscopy (DQF-COSY). Immunohistochemical examinations were conducted to assess lymphovascular invasion (LVI), Ki-67 and Nottingham Prognostic Index (NPI). In total, 30 patients with invasive ductal carcinoma (IDC), 13 with LVI negative and 17 with LVI positive, participated in the study.
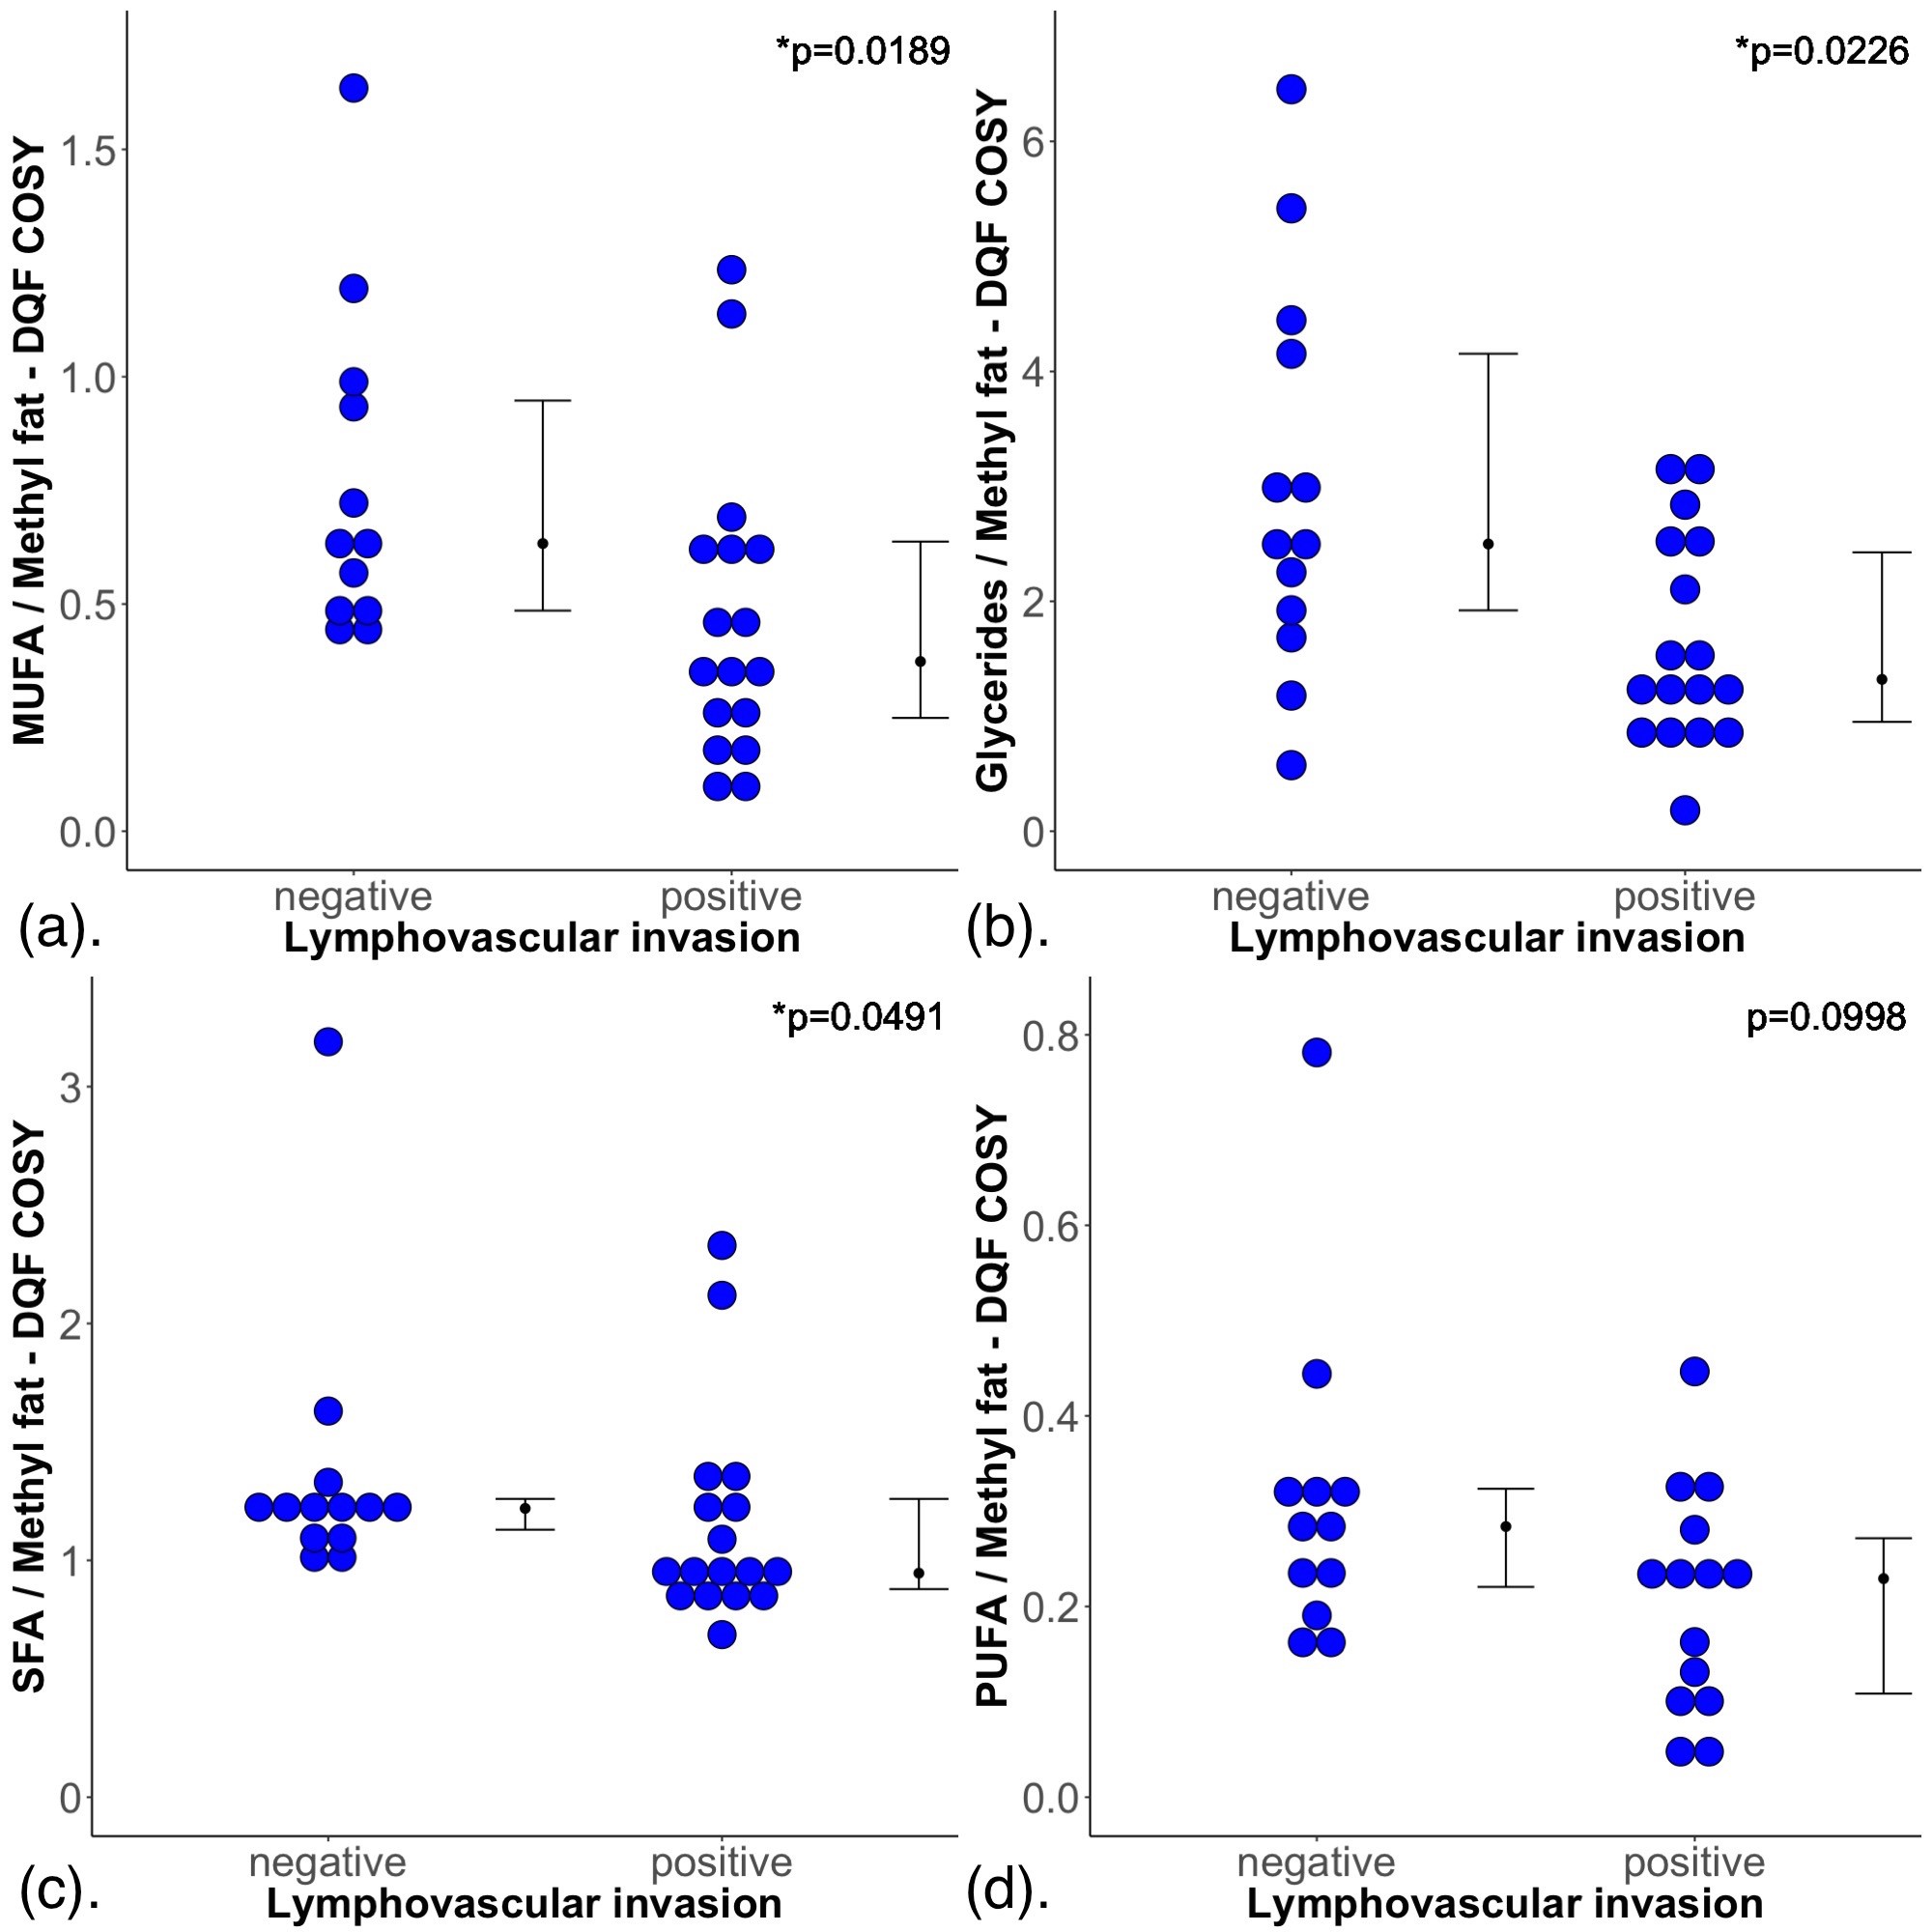
Figure 2. Group difference results.
The group difference in (a) monounsaturated fatty acids (MUFA), (b) glycerides, (c) saturated FA (SFA) and (d) polyunsaturated FA (PUFA), are shown in dot plots. Each dot represents the measurement obtained in each patient, and the dots are organised in two columns corresponding to the lymphovascular invasion (LVI) negative and positive breast tumours. The error bar indicates the median and interquartile range. The Mann Whitney U tests were performed between the groups and p values are shown. Statistically significant p values are marked by ‘*’.
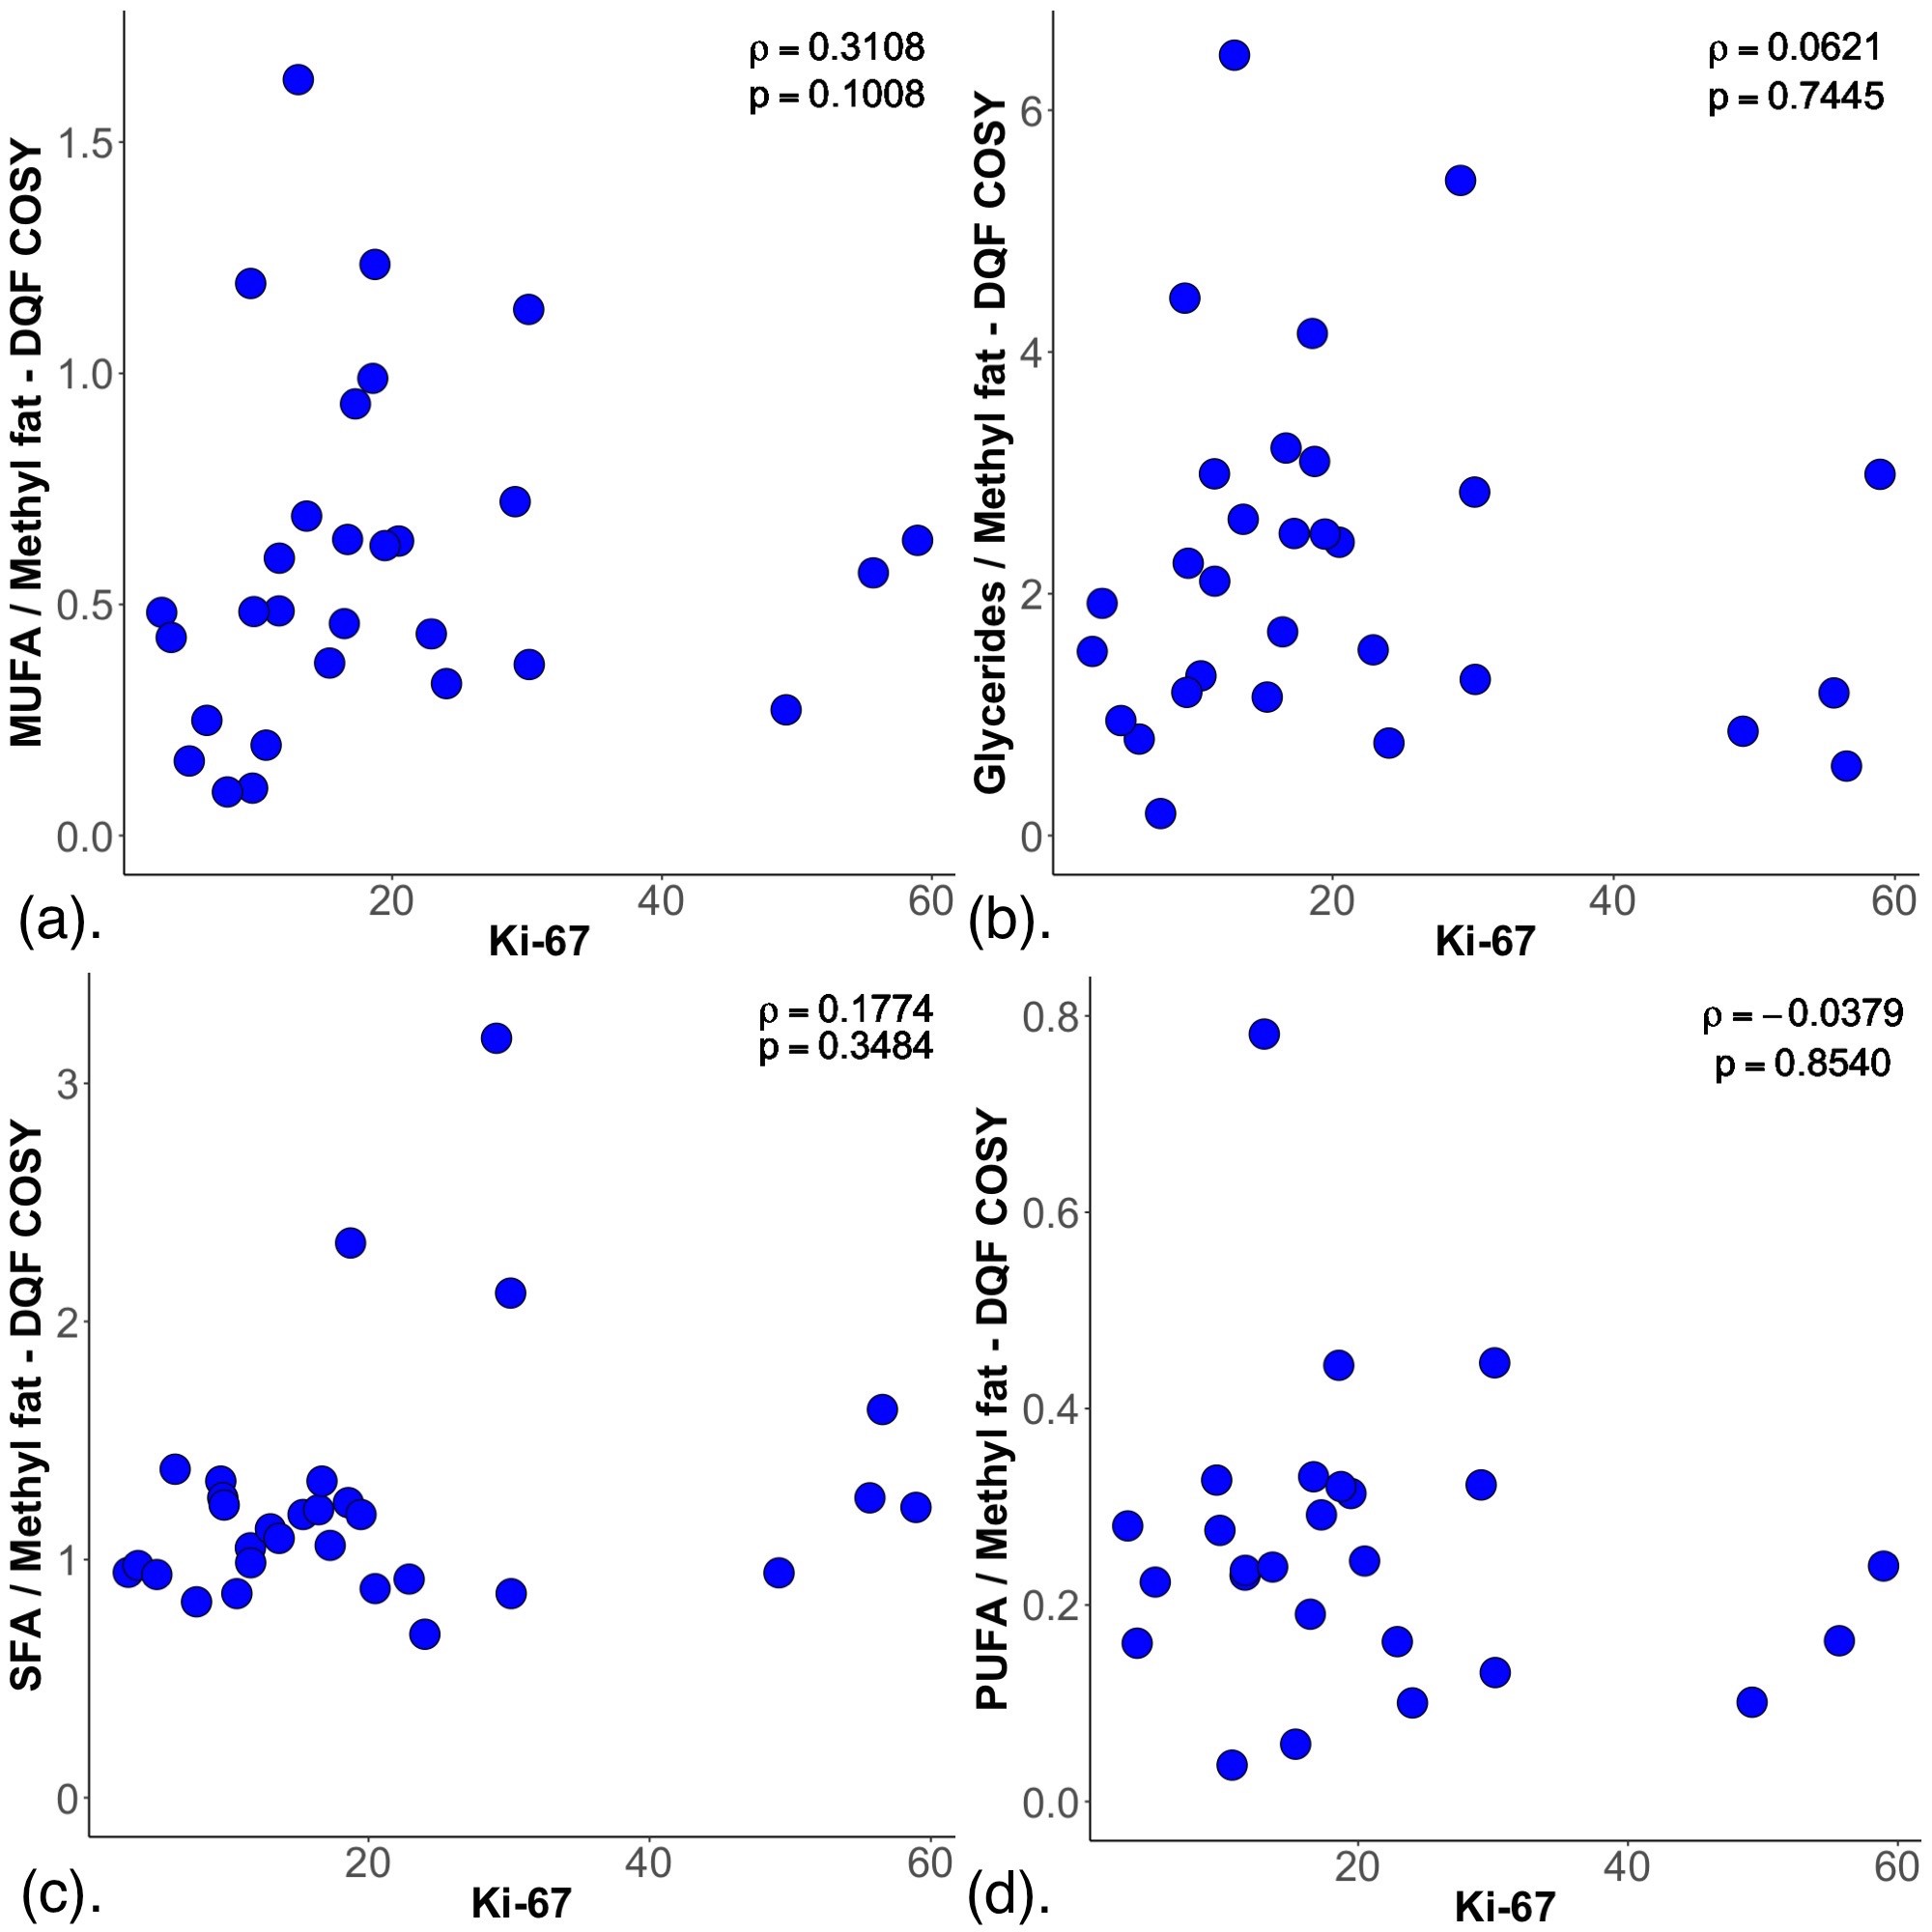
Figure 3. Correlation results.
(a) Monounsaturated fatty acids (MUFA), (b) glycerides, (c) saturated FA (SFA) and (d) polyunsaturated FA (PUFA) were correlated with Ki-67 expression within the entire cohort, and shown as scatter plots. The corresponding Spearman’s rank correlation rho (ρ) scores and p values are displayed. There were no significant correlations between MUFA, glycerides, SFA or PUFA with Ki-67 expression.