4800
Personalized DCE-MRI parametric mapping of gynecological cancer using high spatiotemporal resolution GRASP
Nathanael Kim1, Yousef Mazaheri1, Yulia Lakhman2, Li Feng3, Ersin Bayram4, Alberto Vargas2, and Ricardo Otazo1,2
1Medical Physics, Memorial Sloan Kettering Cancer Center, New York, NY, United States, 2Radiology, Memorial Sloan Kettering Cancer Center, New York, NY, United States, 3Biomedical Engineering and Imaging Institute and Department of Radiology, Icahn School of Medicine at Mount Sinai, New York, NY, United States, 4GE Healthcare, Waukesha, WI, United States
1Medical Physics, Memorial Sloan Kettering Cancer Center, New York, NY, United States, 2Radiology, Memorial Sloan Kettering Cancer Center, New York, NY, United States, 3Biomedical Engineering and Imaging Institute and Department of Radiology, Icahn School of Medicine at Mount Sinai, New York, NY, United States, 4GE Healthcare, Waukesha, WI, United States
Synopsis
Personalized estimation of the arterial input function (AIF) in DCE-MRI has been a relatively challenging task due to the slow imaging speed of conventional MRI. As a consequence, a population AIF is usually employed for parametric mapping, which represents a group effect rather than the long-desired personalized quantification. In this work, we use the GRASP method to perform DCE-MRI of gynecological tumors with high spatial and temporal resolution and to estimate the AIF directly from the data. The personalized AIF shows higher consistency with the tumor enhancement compared to the population AIF.
Introduction
Despite the promising results identifying associations between DCE-MRI parametric maps and gynecologic tumor aggressiveness, prognosis, and response to treatment, DCE-MRI still plays no role in routine clinical practice1. Achieving the right balance between high spatial resolution, temporal resolution, and anatomic coverage has been problematic, due to the relatively low imaging speed of conventional MRI. New techniques based on the combination of radial acquisition and compressed sensing reconstruction, such as GRASP2, can significant increase imaging speed and circumvent these limitations. Another important limitation is the difficulty to estimate the arterial input function (AIF) in each patient. Usually, a population-based AIF3 is employed, which represents group quantification rather than the long-desired personalized quantification. In this work, we present the estimation of the AIF in each patient using high temporal resolution GRASP data and signal saturation correction for personalized DCE-MRI parametric mapping of gynecological cancer.Methods
Patient population: Six patients who were undergoing routine gynecological MRI examination were recruited in this single institution prospective study, which is HIPAA-compliant and approved by our local institutional review board.Data acquisition and image reconstruction: Imaging was performed on a 3T MRI scanner (MR750w, GE Healthcare) using a 12-element body coil array. A prototype GRASP-LAVA sequence was inserted in the standard of care MRI protocol in place of the conventional DCE-MRI sequence. GRASP-LAVA data were acquired with the following imaging parameters: FOV = 360×360mm2, slice thickness = 5mm, TR = 4.1ms, FA = 10o, number of readout points = 320 and the number of acquired slice = 54. A total of 2700 spokes rotating by the golden-angle were acquired continuously and the total scan time was 5 minutes. Gadavist contrast agent was injected after 1 minute of starting data acquisition at a rate of 2ml/sec. GRASP-LAVA reconstruction was performed with a temporal resolution of 5 seconds/volume, after grouping 21 consecutive spokes to form each temporal frame. Each temporal frame was reconstructed with a spatial matrix of 320x320×100, resulting in a voxel size of 1.125×1.125×5mm3.
AIF estimation: The raw AIF was calculated by the average temporal signal in a region defined on a feeding artery located in the same field-of-view as the tumor (of multiple selected by a gynecologic radiologist). However, when a large concentration of the contrast agent is present, the signal is also impacted by the susceptibility effect of the paramagnetic contrast agent4,5. To obtain an accurate estimate of the AIF, the signal loss at the peak of the arterial enhancement must be accounted and corrected. We present here a method that uses known parameters in the muscle and the temporal signal of the muscle to compute the peak arterial signal. The AIF $$$C_p(t)$$$ in the muscle is given by:
$$C_p(t)=\frac{1}{v_e}[C_{muscle}(t)+\frac{v_{e},muscle}{K^{trans},muscle}\frac{dC_{muscle} (t)}{dt}]$$
where $$$C_{muscle}(t)$$$ is the muscle concentration at time $$$t$$$, and $$$v_{e,muscle}$$$ and $$$K^{trans}_{muscle}$$$ are the previously established kinetic parameters. The peak of $$$C_p(t)$$$ is obtained from individual patient $$$C_{muscle}$$$ and subsequently used to replace the peak of the raw AIF estimated from the GRASP data. Note that only the peak of the raw AIF is corrected.
DCE-MRI quantification: A Tofts model7 was used to quantify the DCE signal in the tumor. This model, which is widely used in tumors, represents the tissue concentration as the sum of the contribution due to the plasma volume, and the fractional volume of the extravascular extracellular space (EES):
$$C_t(t)=K^{trans} ∫_0^tC_p(u)∙exp(-\frac{K^{trans} (t-u)}{ν_e})du$$
where $$$C_p(t)$$$ is the tracer concentration in blood plasma, $$$K^{trans}$$$ is the volume transfer constant for gadolinium between the blood plasma and the EES and $$$k_{ep}=\frac{K^{trans}}{v_e}$$$ is the rate constant between EES and blood plasma.
Results
Figure 1 shows an example of the high image quality obtained using GRASP with a high temporal resolution of 5 seconds per volume, which corresponds to a 15-fold acceleration. Figure 2 shows AIF estimation for the same patient. The personalized AIF differs from the population AIF in peak amplitude and wash-out values, which impacts parameter estimation. In particular, the personalized AIF better correlates with the tumor ROI enhancement. Figures 3 and 4 show Ktrans and kep maps for two different patients using personalized and population AIFs. The main difference can be seen in kep, which is related to the wash-out of the contrast agent. The kep map using personalized AIF show heterogeneity that is more consistent with the spatial pattern of the contrast enhancement in Figure 1, unlike the kep map corresponding to the population AIF which is homogeneous. Data fitting in a ROI defined in the tumor is improved when using the personalized AIF, as shown in Figure 5. In the case of population AIF, a downward trend in the Tofts model is observed, whereas the case of personalized AIF shows a more expected trend of a slow but steady increase.Discussion
This preliminary study of estimating the AIF in each patient shows differences with respect to the population AIF, which affects quantification. While a more complete study with a larger patient population and reproducibility assessment is required for validation, initial results from the small cohort are promising. In particular, personalized AIF estimation shows better correlations with tumor enhancement, and parametric maps are more heterogeneous, as expected.Acknowledgements
No acknowledgement found.References
- Zahra MA, Tan LT, Priest AN, Graves MJ, Arends M, Crawford RA, Brenton JD, Lomas DJ, Sala E. Semiquantitative and quantitative dynamic contrast-enhanced magnetic resonance imaging measurements predict radiation response in cervix cancer. International journal of radiation oncology, biology, physics. 2009;74(3):766-73.
- Feng L, Grimm R, Block KT, Chandarana H, Kim S, Xu J, Axel L, Sodickson DK, Otazo R. Golden-angle radial sparse parallel MRI: Combination of compressed sensing, parallel imaging, and golden-angle radial sampling for fast and flexible dynamic volumetric MRI. Magn Reson Med. 2014;72(3):707-17.
- Parker GJ, Roberts C, Macdonald A, Buonaccorsi GA, Cheung S, Buckley DL, Jackson A, Watson Y, Davies K, Jayson GC. Experimentally-derived functional form for a population-averaged high-temporal-resolution arterial input function for dynamic contrast-enhanced MRI. Magn Reson Med. 2006 Nov;56(5):993-1000.
- de Bazelaire C, Rofsky NM, Duhamel G, Zhang J, Michaelson MD, George D, et al. Combined T2* and T1 measurements for improved perfusion and permeability studies in high field using dynamic contrast enhancement. Eur Radiol. 2006;16(9):2083-91.
- Ellinger R, Kremser C, Schocke MF, Kolbitsch C, Griebel J, Felber SR, et al. The impact of peak saturation of the arterial input function on quantitative evaluation of dynamic susceptibility contrast-enhanced MR studies. J Comput Assist Tomogr. 2000;24(6):942-8.
- Wang H, Cao Y. Correction of arterial input function in dynamic contrast-enhanced MRI of the liver. J Magn Reson Imaging. 2012;36(2):411-21.
- Tofts PS. Modeling tracer kinetics in dynamic Gd-DTPA MR imaging. Journal of magnetic resonance imaging : JMRI. 1997;7(1):91-101
Figures
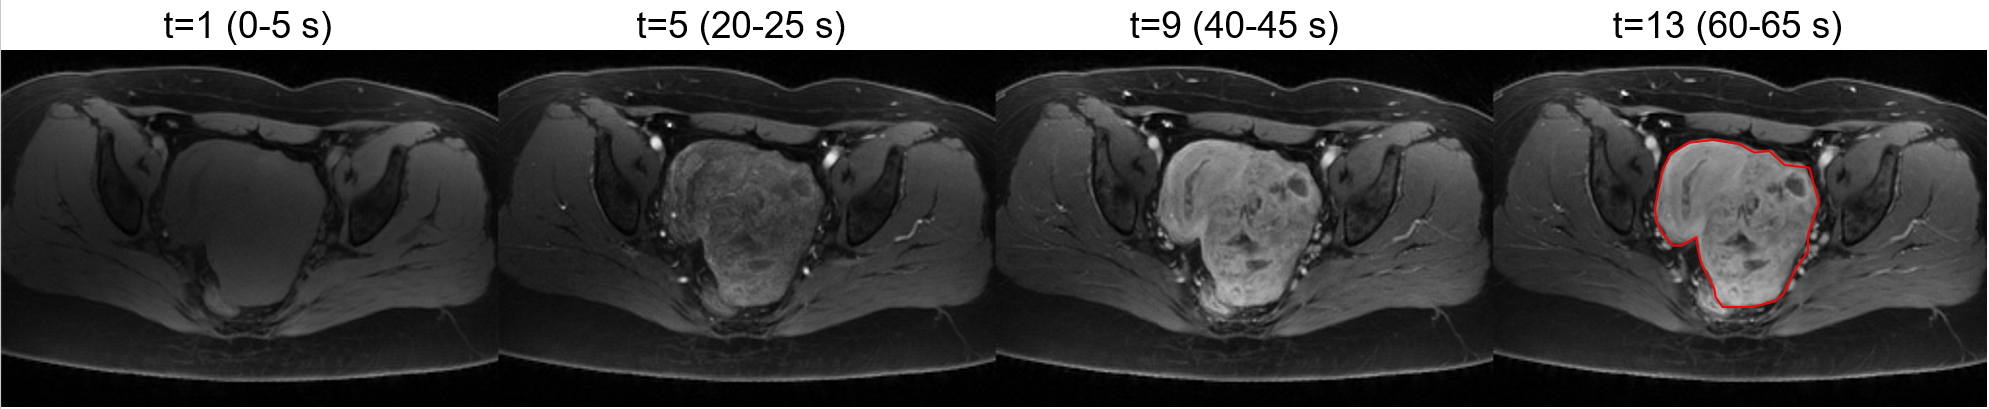
Figure 1: GRASP images reconstructed with temporal
resolution = 5 seconds in a patient with cervical cancer. Images show contrast
enhancement in one representative tumor slice at 4 time points, which clearly
depict the cervical tumor (red region).
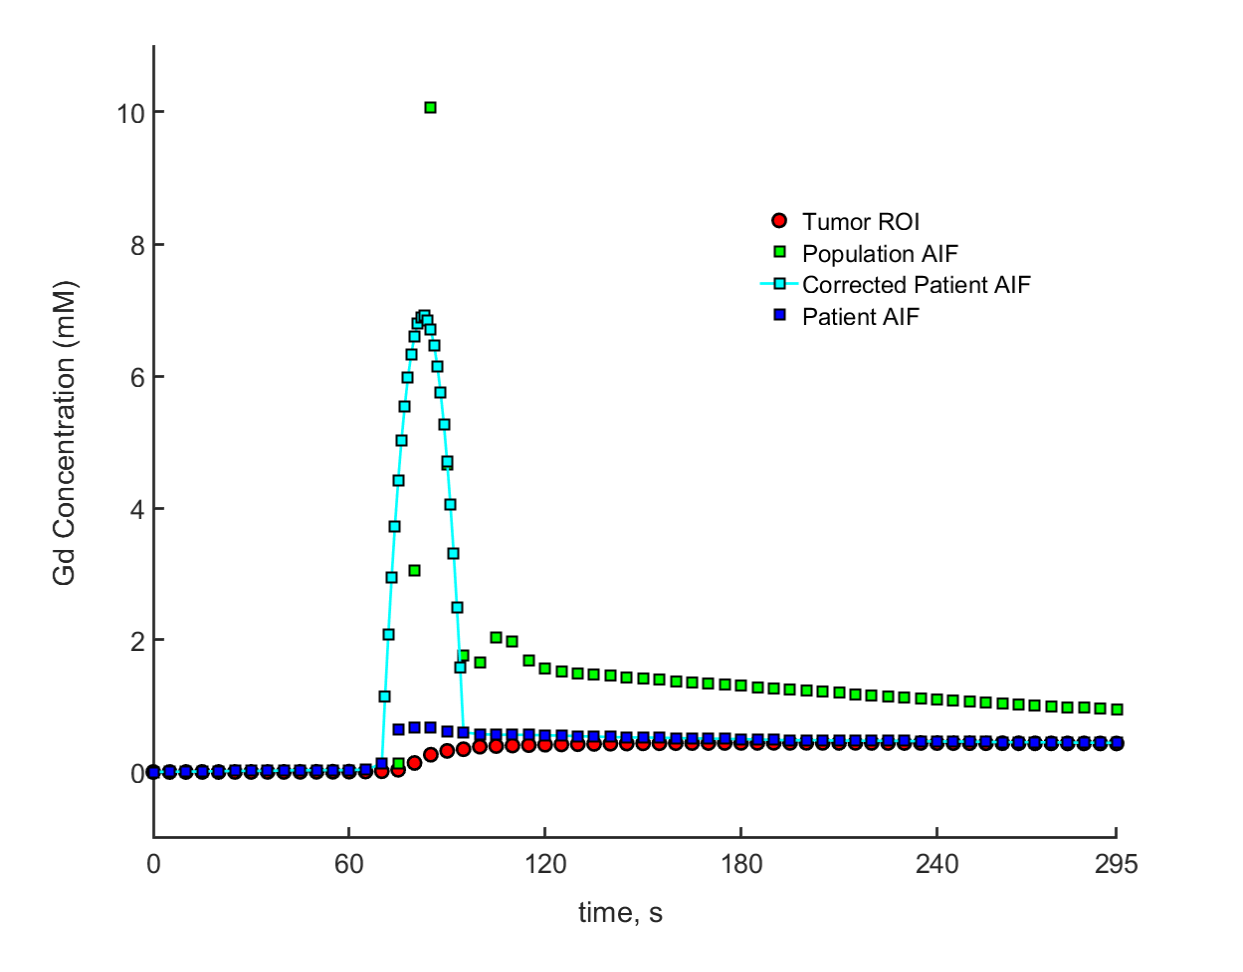
Figure 2: A graph showing the comparison of the
different AIFs, showing the correction made to the patient AIF by adjusting the
peak. The corrected patient AIF is more correlated with the tumor enhancement,
as expected from the personalized estimation.

Figure 3: Comparison of Ktrans and kep
maps for one of the patients with a cervical tumor. Differences are more pronounced on the kep
map, which is related to the wash-out of the contrast agent. The personalized
AIF is more correlated to the tumor enhancement in the wash-out period, which
can explain in part this difference.
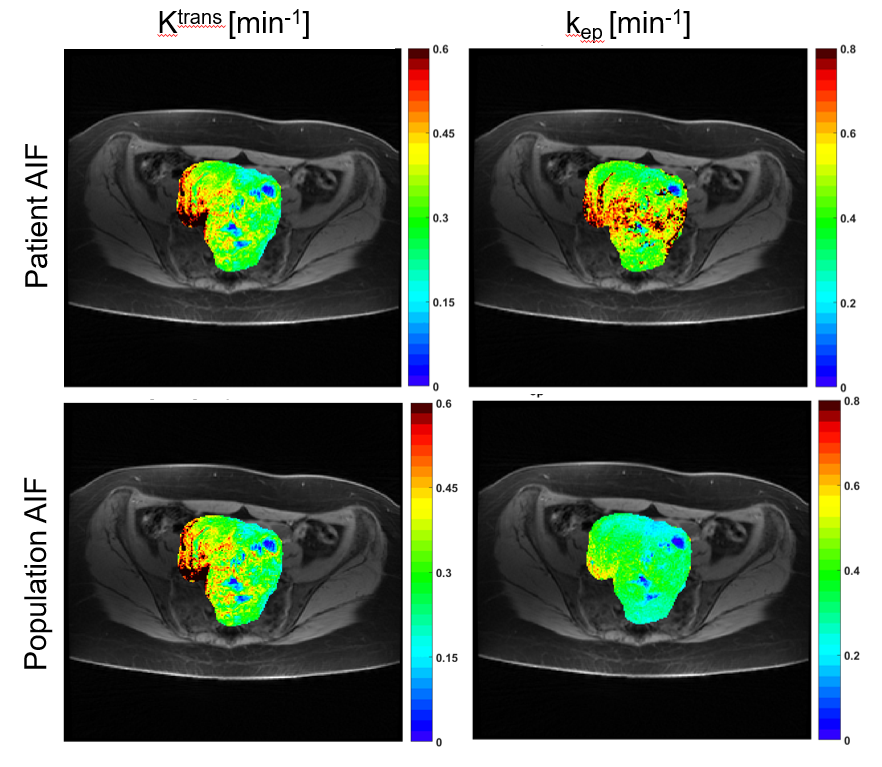
Figure 4: Another comparison of Ktrans and
kep maps for a patient with a large cervical tumor. As before, differences are more pronounced on
the kep map.
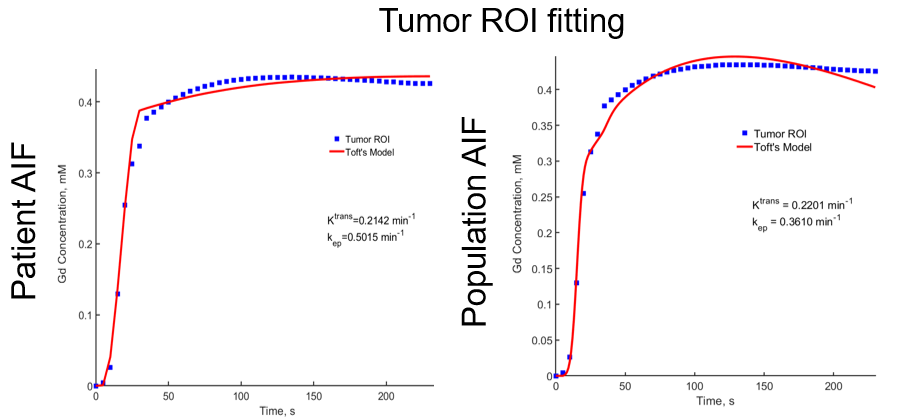
Figure 5: A comparison of Tumor ROI fitting using the
Toft’s model for patient AIF and population AIF. A better fit quality is
obtained with the patient AIF (personalized).