4798
Active Trans-Membrane Water Cycling Reflects Metabolic Activity in Breast Cancer MRI1Oregon Health & Science University, Portland, OR, United States
Synopsis
[Shutter-speed] SS-DCE-MRI allows access to the crucial on-going cell membrane sodium pump activity previously unreachable in vivo. Literature results indicate the latter is significantly increased early in the oncogenic transformation. This suggests an approach for early cancer detection with high-resolution imaging, a very important clinical goal. Here, we analyze SS-DCE-MRI and concomitant histopathological breast cancer data obtained during neo‑adjuvant chemotherapy, with this consideration in mind. The results support the contention, but indicate a non‑invasive, non-contrast DWI method under development is likely necessary to realize this clinical potential.
INTRODUCTION
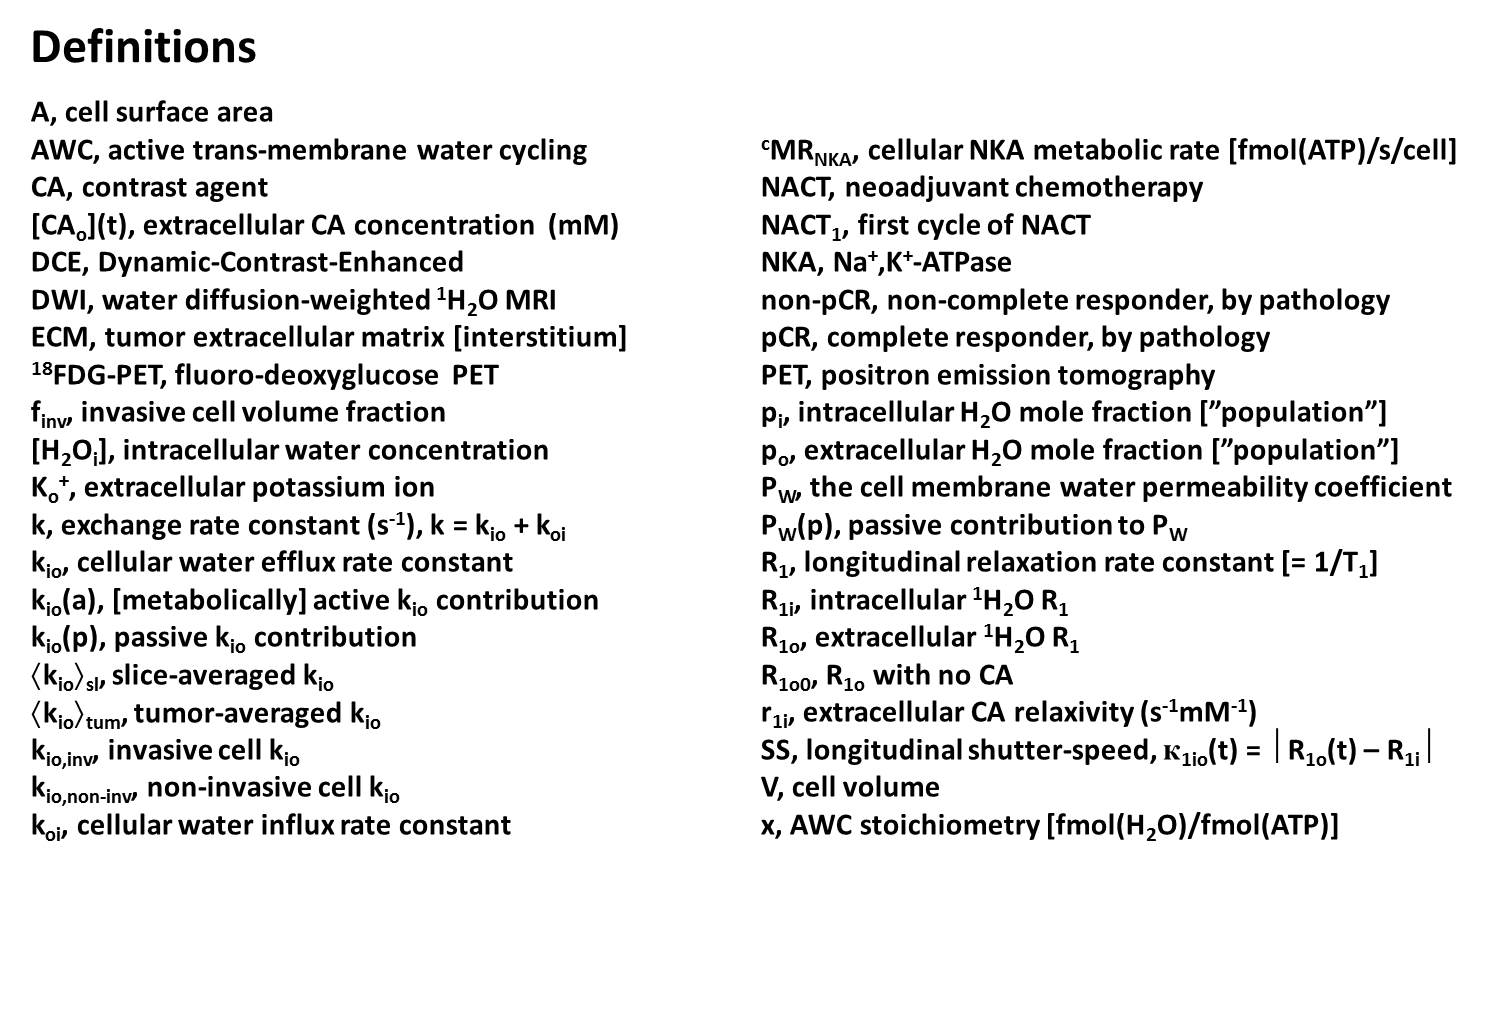
In comparison with DCE-MRI tracer interpretations, shutter-speed [SS] pharmacokinetic analyses allow appraisal of transcytolemmal water exchange kinetics – specifically the first-order cellular efflux rate constant, kio. Importantly, it has a contribution from the vital plasma membrane sodium pump [NKA] activity; the first term in the kio expression, Equation [1], [definitions in Figure 1].1 In aggressive breast cancer cells, kio is significantly elevated,2 probably becausekio = kio(a) + kio(p) = {x/([H2Oi]V)}cMRNKA + (A/V)PW(p) [1]
of increased expression of NKA2 and/or other ion channels early in the oncogenic transformation.3 In this study we investigated breast tumor kio changes with neoadjuvant chemotherapy [NACT] and kio/histopathological relationships.
METHODS
Twenty nine breast cancer patients (30 primary tumors) treated with standard of care NACT were recruited for research DCE-MRI examinations;4,5 pre-NACT, after the first cycle [NACT1], at midpoint, and after NACT completion. The status of pathologic complete response (pCR) or non-pCR, as well as invasive cancer cell volume fraction (finv)6,7 was determined by post-NACT surgical histopathological analysis.RESULTS
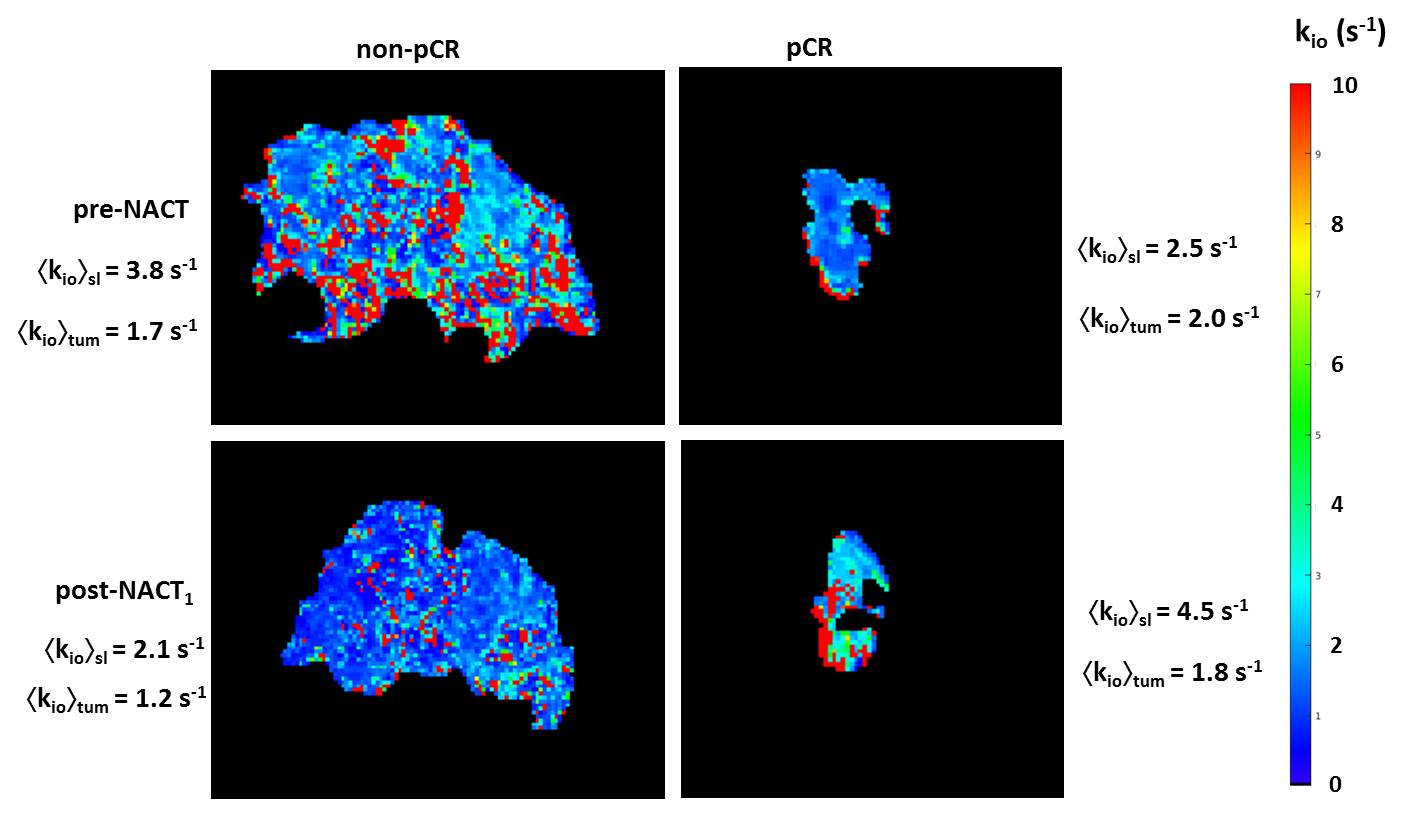
Voxel-based breast tumor kio maps exhibit focal hot spots [few‑mm; about cancer cell bed size] (Figure 2).1,4,5 As seen consistently,1,4,5 the whole tumor-averaged kio values, <kio>tum, decrease during NACT: that some tumor image slice-averaged kio, <kio>sl, values might increase (Fig. 2 right) is almost certainly due to the impossibility of locating the identical tumor slice between pre‑ and post-NACT1 DCE-MRI: tumor metabolic activity is heterogeneous in three dimensions.Following NACT completion, we can analyze <kio>tum using a simple [parsimonious], binary premise: a tumor comprises invasive and non-invasive cells with, respectively, kio,inv and kio,non-inv values [rather consistent with Fig. 2]. This allows us to estimate kio,inv with Equation [2].
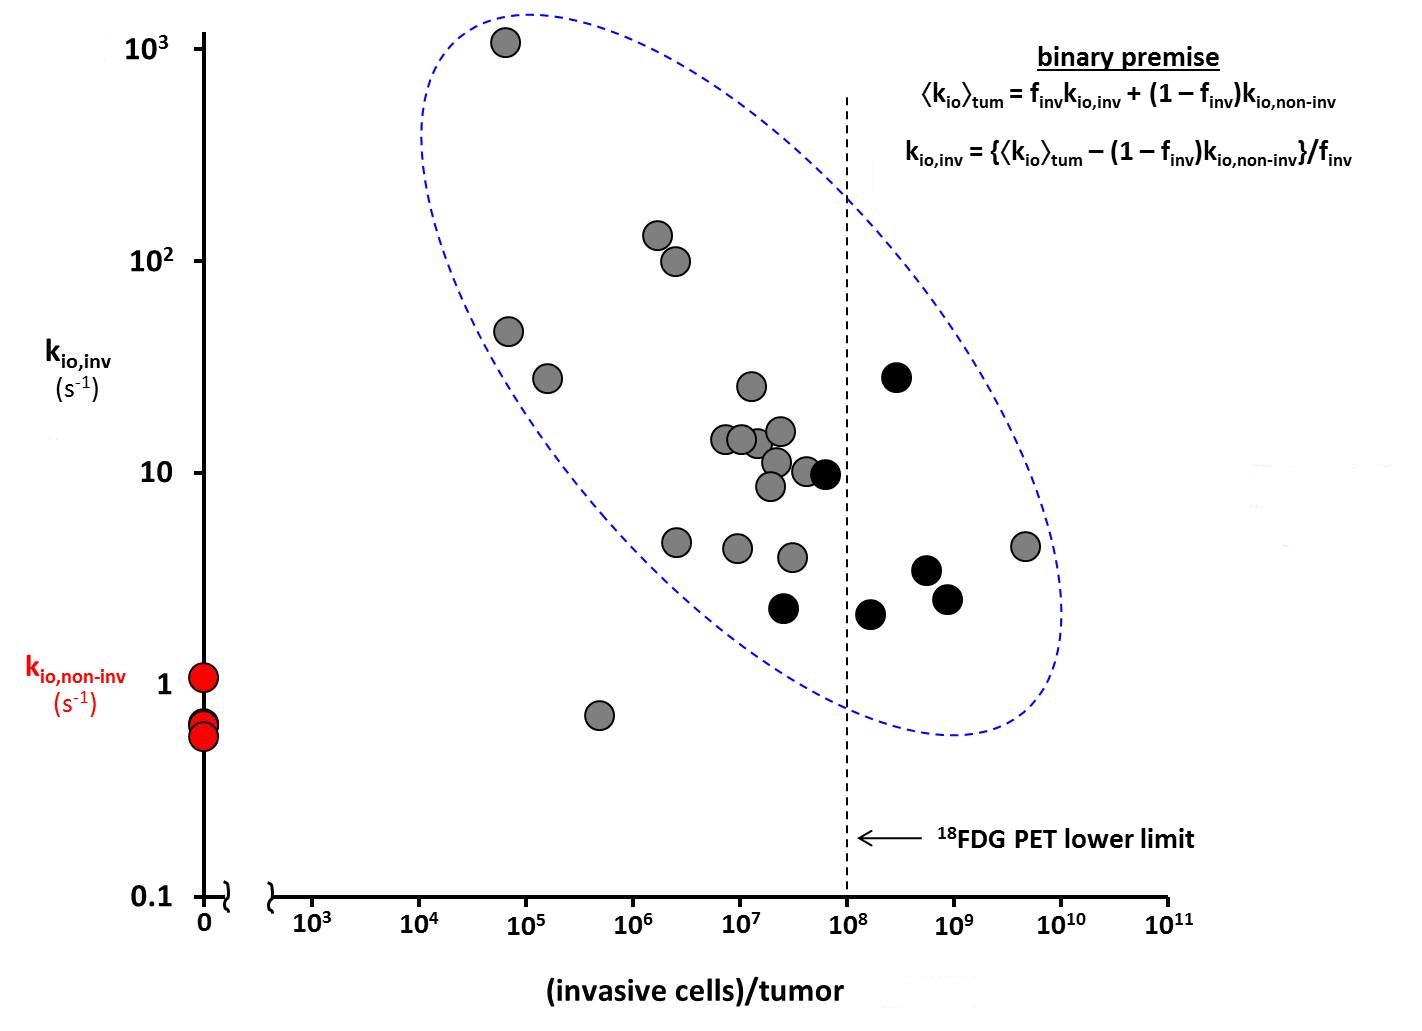
kio,inv = {<kio>tum - (1 – finv)kio,non-inv}/finv [2]
For kio,non-inv, we took the <kio>tum values from pCR tumors, obtained from post-NACT [pre-surgery] DCE‑MRI. We combined the tumor volumes measured from the post-NACT 3D DCE-MRI acquisitions with finv to estimate the number of invasive cells per tumor.
Figure 3 shows the log/log plot of kio,inv [ordinate] from Eq. [2] versus the invasive cells/tumor [abscissa]. The pCR and non-pCR tumors are plotted as red and gray/black circles, respectively. There is scatter: finv is semi-quantitative at best [with sampling issues],7 and the tumors have different volumes. However, the data show a clear negative correlation: kio,inv decreases with the number of invasive cells/tumor [post‑NACT <kio>tum increases only hyperbolically with finv]8.
DISCUSSION
The Fig. 3 results have significant implications. The kio,inv values for tumors with few invasive cells are very large: too large to be determined by direct SS‑DCE-MRI. In order to measure kio well, the longitudinal MR SS, к1io(t), must rise to be near, or exceed, the exchange rate constant, k, Equation [3].9 The right-most relationship is required byк1io(t) = I R1o(t) – R1i I = I r1o[CAo](t) + R1o0 – R1i I ≥ k = kio + koi = [1 + (pi/po)]kio [3]
the reversible nature of the trans-cytolemmal water molecule exchange process. For the in vivo situation, (pi/po) is large – usually near 4 – and [CAo](t)max is limited to ~ 3 mM, transiently, by the rather standardized contrast dose and bolus injection protocol allowed for a DCE-MRI exam.1,9 Consequently, as shown in Fig, 2, the voxel-based kio estimations from DCE-MRI were capped at 10 s-1; a practical upper limit.
By comparison, ex vivo experiments on cells suspended in a CA bathing solution, do not suffer these problems: (pi/po) can be quite small – often near 0.1 – and [CAo] adjusted to any value. For very metastatic breast 4T1 cells, a [CAo] near 40 mM is required2 to measure kio = 46 s-1. For these cells in vivo, k would be almost 230 s-1. For moderately metastatic TS/A cells, kio increases from a normoxic 26 s-1 value2,10 to 77 s-1 when hypoxic.10 In vivo, the hypoxic k would be near 385 s-1. Such k values are unreachable by SS-DCE-MRI.
The kio biomarker is supra-intensive11 (a true first-order rate constant): it is a per cell measure, and formally finv‑independent if kio(a) = 0. The fact that kio,inv does decrease with invasive cells/tumor [Fig. 3] confirms kio(a) > 0, and suggests intra-tumor carcinoma cell metabolic competition. A strong candidate intermediary is tumor ECM potassium, Ko+;12 a substrate common for all NKA copies. Thus, Fig. 3 suggests potential for early cancer detection: new tumors should have very few malignant cells with very large kio values. Because of its inherent partial volume confound, 18FDG-PET cannot detect tumors with so few cells: a generous lower limit [108 invasive cells/tumor]13 is indicated in Fig. 3.
Of course, for the reasons above, direct SS-DCE-MRI cannot provide accurate kio estimation when the Eq. [3] condition cannot be met. However, a noninvasive, SS‑free, CA-free 1H2O DWI method [unhindered by koi], which has a large dynamic range for large kio values,1,14 is an alternative approach with promise for early detection.
Acknowledgements
Grant support: NIH U01 CA154602, R44 CA180425; Brenden-Colson Center for Pancreatic Care; OHSU Center for Women’s Health Circle of Giving Award.
References
Springer. J. Magn. Reson. 2018; 291: 110-126.
Ruggiero, Baroni, Pezzana, Ferrante, Crich, Aime. Angew. Chem. Int. Ed. Engl. 2018; 57: 7468-7472.
Zhou, Wong, Cho, van der Hoeven, Liang, Thakur, Luo, Babic, Zinsmaier, Zhu, Hu, Venkatachalam, Hancock. Science 2015; 349: 873-876.
Machireddy, Thibault, Tudorica, Afzal, Mishal, Kemmer, Naik, Troxell, Goranson, Oh, Roy, Jafarian, Holtorf, Huang, Song. Tomography 2019; 5: 90-98.
Tudorica, Oh, Chui, Roy, Troxell, Naik, Kemmer, Chen, Holtorf, Afzal, Springer, Li, Huang. Transl. Oncol. 2015; 9: 8-17.
Symmans, Peintinger, Hatzis, Rajan, Kuerer, Valero, Assad, Poniecka, Hennessy, Green, Buzdar, Singletary, Hortobagyi, Pusztai. J. Clin. Oncol. 2007 25:4414-4422.
Peintinger, Sinn, Hatzis, Albarracin, Downs-Kelley, Morkowski, Gould, Symmans. Mod. Path. 2015 28:913-920.
Springer, Li, Tudorica, Oh, Chui, Roy, Troxell, Naik, Kemmer, Chen, Holtorf, Afzal, Huang. Proc. Int. Soc. Magn. Reson. Med. 2016; 24: 2722.
Li, Mangia, Lee, Bai, Springer. Magn. Reson. Med. 2019; 82: 411-424.
Ruggiero, Baroni, Aime, Crich. Mol. Phys. 2018; DOI:10.1080/00268976.2018. 1527045.
Rooney, Li, Sammi, Bourdette, Neuwelt, Springer. NMR Biomed. 2015; 28: 607-623.
Vodnala, Eil, Kishton, Sukumar, Yamamoto, Ha, Lee, Shin, Patel, Yu, Palmer, Kruhlak, Liu, Locasale, Huang, Roychoudhuri, Finkel, Klebanoff, Restivo. Science 2019 363: 1417.
Wahl, Jacene, Kasamon, Lodge. J. Nucl. Med. 2009 50: 122S-150S.
Baker, Moloney, Li, Wilson, Barbara, Maki, Gilbert, Springer. Proc. Int. Soc. Magn. Reson. Med. 2019; 27: 3585.
Figures