4797
Breast MRI kinetic and radiomic features correlate with invasive breast cancer angiogenesis1Radiology, University of Washington, Seattle, WA, United States, 2Pathology, University of Washington, Seattle, WA, United States, 3Medicine, University of Washington, Seattle, WA, United States
Synopsis
Although kinetics are routinely incorporated into interpretation of contrast enhanced breast MRI, there is a paucity of literature supporting the association between the pathophysiologic basis of enhancement and its histopathologic correlate. Our study investigated DCE-MRI kinetic parameters and texture features analyzed with radiomics and their correlation with microvessel density as a surrogate for tumor angiogenesis. Twenty seven patients with invasive breast cancer were included in our study. Both peak SER and washout fraction and several texture features were significantly correlated with microvessel density (p<0.01), further supporting the biologic basis of malignant enhancement on breast MRI.
Introduction
Both benign and malignant breast lesions are known to enhance on dynamic contrast enhanced MRI (DCE-MRI), with several kinetic features associated with malignancy (1-3). Although we routinely incorporate kinetic parameters in our interpretation of DCE-MRI, there is a paucity of literature supporting the association between the pathophysiologic basis of enhancement on MRI and its histopathologic correlate. DCE-MRI kinetic features are presumed to reflect tumor angiogenesis, a necessary step in breast cancer growth and metastasis (4-5). Microvessel density is a pathological marker used to quantify tumor angiogenesis and has been shown to predict poor survival in women with invasive breast cancer (6). The purpose of our study was to investigate whether DCE-MRI quantitative kinetic parameters and texture features analyzed with radiomics correlate with MVD as a surrogate for tumor angiogenesis.Methods
After IRB approval, patients with newly diagnosed invasive breast cancer were consented prior to preoperative breast MRI. Routine clinical evaluation of core biopsies included histologic type, Nottingham grade, ER, PR, and HER2 expression and Ki-67. Microvessel density (MVD) was also assessed by a pathologist after immunostaining with CD31 and categorized as high (3+), intermediate (2+), and low (1+). Imaging was performed on a 3 Tesla Philips Achieve TX scanner with a 16-channel breast MRI coil. Multiparametric breast MR examinations included: T2-weighted, diffusion-weighted imaging (DWI), and dynamic contrast-enhanced MRI performed with pre-contrast and post-contrast volumes center at 2,5, and 8 minutes after contrast injection (0.1mmol/kg-body weight gadoteridol delivered at 2cc/sec with 15cc saline flush). Contrast kinetics were characterized using custom software as previously described (7), including: 1) initial peak enhancement (PE) at 2mins post-contrast, 2) signal enhancement ratio (SER) characterizing slope of the delayed enhancement curve, 3) functional tumor volume (FTV) calculated by summing all voxels with PE ≥50%, and 4) washout fraction (WF) calculated as the percentage of total tumor voxels with SER ≥1.1, reflecting washout. Peak PE and peak SER were determined for hot-spot regions of 3x3x3 voxels (0.1625 mm3) producing the highest mean PE and SER value, respectively. For radiomics texture analysis, lesions were segmented by thresholding initial post-contrast DCE images and evaluated using an open source software platform (3D Slicer v4.11.0 with pyradiomics library, www.slicer.org). Each DCE MR image was normalized to have zero mean and unity standard deviation and isotropic resampling was applied before the radiomics features were calculated for the ROI segmentation. A total of 108 features categorized as first order, shape, and various texture features were generated for further statistical analysis. Associations between MVD category and individual imaging features were summarized using the odds ratio (OR) from univariable logistic regression models. ORs were scaled to correspond to change per 1-SD increase in the feature. Differences between high and low MVD groups were tested using the Wilcoxon rank-sum test and summarized using the area under the receiver operating characteristic curve (AUC). P-values were not adjustment for multiple testing so the radiomics texture analysis should be considered hypothesis-generating.Results
Our study included 27 patients (median age 53, range 30-88) with breast cancer (23 invasive ductal carcinoma, 3 invasive lobular carcinoma, 1 invasive mammary carcinoma). Mean tumor size was 29.7 mm with a range of 10 to 101 mm. Both peak SER and washout fraction were positively associated with MVD. Lesions with higher MVD exhibited higher peak SER values (mean: 1.8 vs. 1.5, AUC = 0.84, p = 0.005) and higher washout fraction (mean: 40% vs. 20%, AUC = 0.86, p = 0.003) than lesions with low MVD, Table 1. Examples of two lesions with high and low MVD are shown in Figure 1. There was no significant correlation between peak PE or FTV with MVD (p= 0.59 and 0.44, respectively). Several radiomics texture features were also found to be associated with MVD, including several GLDM features, GLCM features and GLRLM features (p<0.05). Two features in particular, GLDM- LargeDependenceHighGrayLevelEmphasis and GLRLM- LongRunHighGrayLevelEmphasis, were significantly correlated with MVD (AUC = 0.82, p = 0.009 for each).Conclusion and Discussion
Our study supports that quantitative tumor kinetic parameters and texture features on DCE-MRI allow noninvasive characterization of tumor angiogenesis as measured by MVD in patients with invasive breast cancer. These findings may aid in improving biologic stratification of lesion aggressiveness and metastatic potential. Due to the small sample size, further multivariate analysis was not possible for this study and additional studies are warranted to investigate optimal DCE MRI predictive models.Acknowledgements
Supported by Fred Hutchinson Cancer Center Support Grant P30 CA015704, NIH/NCI R01CA207290 (SCP), NIH/NCI R01CA203883 (HR), and Department of Defense W81XWH-18–1–0098 (KJC).
References
- Esserman L, Hylton N, George T, Weidner N. Contrast-Enhanced Magnetic Resonance Imaging to Assess Tumor Histopathology and Angiogenesis in Breast Carcinoma. Breast J. 1999 Jan;5(1):13–21.
- Knopp MV, Weiss E, Sinn HP, Mattern J, Junkermann H, Radeleff J, et al. Pathophysiologic basis of contrast enhancement in breast tumors. J Magn Reson Imaging JMRI. 1999 Sep;10(3):260–6.
- Mori N, Pineda FD, Tsuchiya K, Mugikura S, Takahashi S, Karczmar GS, et al. Fast Temporal Resolution Dynamic Contrast-Enhanced MRI: Histogram Analysis Versus Visual Analysis for Differentiating Benign and Malignant Breast Lesions. AJR Am J Roentgenol. 2018;211(4):933–9.
- Weidner N, Semple JP, Welch WR, Folkman J. Tumor angiogenesis and metastasis--correlation in invasive breast carcinoma. N Engl J Med. 1991 Jan 3;324(1):1–8.
- Buadu LD, Murakami J, Murayama S, Hashiguchi N, Sakai S, Masuda K, et al. Breast lesions: correlation of contrast medium enhancement patterns on MR images with histopathologic findings and tumor angiogenesis. Radiology. 1996 Sep;200(3):639–49.
- Uzzan B, Nicolas P, Cucherat M, Perret G-Y. Microvessel density as a prognostic factor in women with breast cancer: a systematic review of the literature and meta-analysis. Cancer Res. 2004 May 1;64(9):2941–55.
- Partridge
SC, Vanantwerp RK, Doot RK, Chai X, Kurland BF, Eby PR, Specht JM, Dunnwald LK,
Schubert EK, Lehman CD, Mankoff DA. Association Between Serial Dynamic
Contrast-Enhanced MRI and Dynamic 18F-FDG PET Measures in Patients undergoing
Neoadjuvant Chemotherapy for Locally Advanced Breast Cancer. J Magn Reson
Imaging. 2010 Nov;32(5):1124-31.
Figures
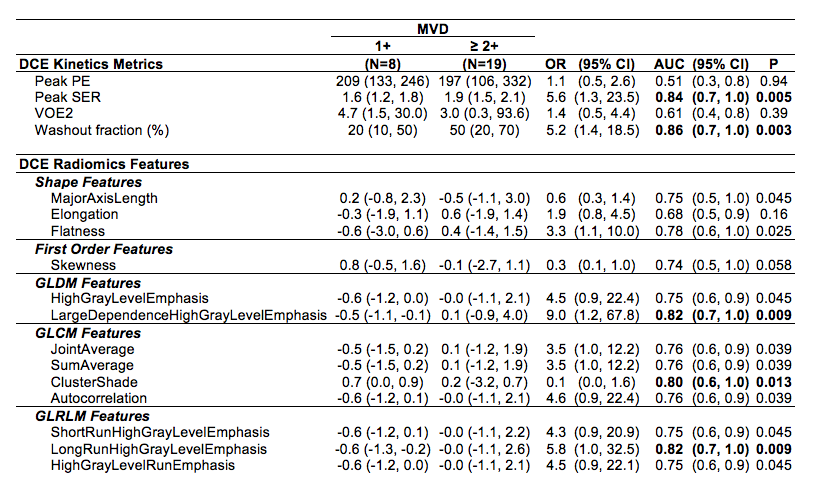
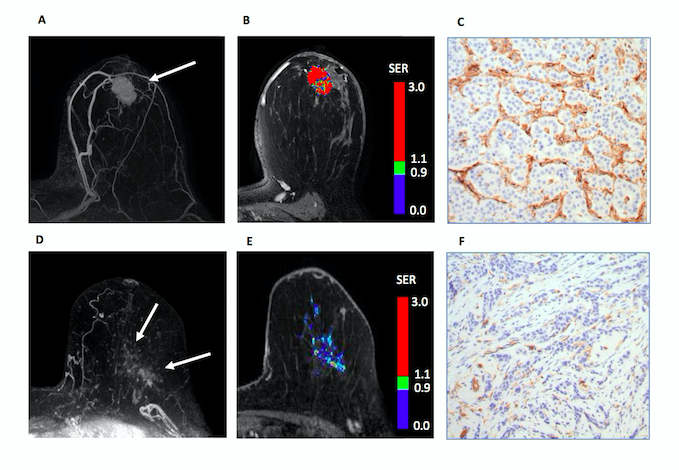
Figure 1. 44 year old woman with IDC. (A) DCE MRI demonstrates malignant mass (arrow) (B) Kinetics analysis reflects peak PE =310, peak SER = 2.05, FTV = 4.9 cc, and washout fraction 56%. (C) Histology shows high MVD (3+) by CD31 staining.
88 year old woman with ILC. (D) DCE-MRI demonstrates malignant non-mass enhancement (arrows). (E) Kinetics analysis reflects peak PE = 133, peak SER = 1.22, FTV = 3.0 cc, and washout fraction 5%. (F) Histology shows low MVD (1+) by CD31 staining.