4796
Assessment of the cerebral blood flow for brain metastasis after radiotherapy using 3D arterial spin labeling MRI
Chuanke Hou1, Guanzhong Gong1, Weiqiang Dou2, Weiyin Vivian Liu2, and Yong Yin1
1Department of Radiation Oncology, Shandong Cancer Hospital and Institute, Shandong First Medical University and Shandong Academy of Medical Sciences, Jinan 250117, China, Jinan, China, 2GE Healthcare, MR Research China, Beijing, China
1Department of Radiation Oncology, Shandong Cancer Hospital and Institute, Shandong First Medical University and Shandong Academy of Medical Sciences, Jinan 250117, China, Jinan, China, 2GE Healthcare, MR Research China, Beijing, China
Synopsis
In the study, the relationship between three brain regions (brain metastasis, normal brain region and perituberous edema region) and radiotherapy dose gradient has been explored. 3D arterial spin labeling perfusion imaging (3D-ASL) for quantitative cerebral blood flow measurement has been used in the clinical diagnosis, preoperative differentiation and grading of brain tumors. Therefore, individualized radiotherapy for BM patients could be optimized and improve the local control rate of BM.
Introduction
Brain metastasis(BM),as a common malignant tumor, has been usually treated with radiotherapy. However, lacking of accurate prediction methods for BM radiotherapy response and radiation-induced brain injury limit the success rate of this treatment. 3D arterial spin labeling (3D-ASL) MRI, as a well established non-invasive perfusion imaging technique, can quantitatively measure cerebral blood flow (CBF) changes .1,2 Therefore, in this work, with 3D-ASL, we aimed to firstly quantify the perfusion changes of BM , normal brain areas and perituberous edema areas after radiotherapy, and to secondly establish the relationship between the region specific perfusion and radiation dose gradients. With these findings potentially obtained, it can provide a basis for the radiotherapy response to BM and the accurate prediction of radiation-induced brain injury in normal brain and perituberous edema areas.Methods
SubjectsA total of 26 patients with BM who underwent radiotherapy were collected, including 11 males (age range 45 to 65 years old, mean age: 57.27 years old) and 15 females (age range 41 to 68 years old, mean age: 55.40 years old). The primary tumors included breast cancer (n = 6), lung cancer (n = 17) and esophageal carcinoma (n = 3).
Computed Tomography (CT) was first used to simulate localization images. MRI images were then acquired including enhanced T1WI images and 3D-ASL perfusion images. Radiotherapy plans were obtained before radiotherapy. All these patients underwent second MRI experiment after 15 to 20 times of radiotherapy.
MRI experiment
All MRI experiments were performed at a 3T MR system (Discovery 750w, GE Healthcare, USA). Anatomical brain images were first acquired with contrast enhanced T1 weighted MR sequence. 3D ASL MR technique was applied after that with the following parameters applied: TR = 5160ms, TE = 11.5 ms, matrix = 256×256, FOV = 256mm×256mm, slice thickness =1 mm, and post-label delay= 2025 ms. The contrast agent GD-DTPA was paramagnetic, at a dose of 0.2ml /kg and an injection rate of 2ml /s. Scanning was completed within 3-5mins after the injection.
Data analysis
All acquired 3D ASL images were processed using the vendor provided ASL postprocessing software on GE ADW4.7 workstation. The corresponding CBF mapping was calculated. High signal BM, normal brain and perituberous edema areas were defined as regions of interest (ROIs).
In SPSS software, the mean maximum cross-sectional area and mean maximum CBF of BM before and after radiotherapy were compared using non-parametric test and paired samples t test respectively. The changes of CBF values in BM, normal brain regions and perituberous edema areas under different dose gradients were analyzed by paired samples t test. Significance threshold was set as p<0.05.
Results
The mean maximum cross-sectional area and CBF values of 54 BM(some patients with multiple BM), respectively, decreased by 26.46% and 29.64% after radiotherapy(both p<0.05). A representative example was shown in figure 1. The CBF change rates of BM at 30~40Gy(Gy:a unit of radiation dose) , 40~50Gy and > 50Gy dose gradients were 33.75%, 24.61% and 27.55%, respectively(all p<0.05). In normal brain regions, at the dose gradient of 0~10Gy, 10~20Gy, 20~30Gy, 30~40Gy, 40~50Gy and > 50Gy, the change rates of CBF after radiotherapy were 7.65%, 11.12%, 18.42%, 20.23%, 19.79% and 17.89%, respectively (all p<0.05). However, the rates of CBF in perituberous edema areas elevated as dose gradient after radiotherapy increased. Overall, the perfusion changes of BM before and after radiotherapy were more notable than those in normal brain areas and perituberous edema areas.Discussion
The mean maximum cross-sectional area and CBF value of 54 BM tumors after radiotherapy decreased significantly. The decreases of both parameters were however not synchronized. This confirmed that perfusion changes occurred ahead of the anatomic changes of BM. A previous work has shown that intracellular edema, endothelial cell swelling, vascular occlusion and other changes can occur in the early stage of radiation injury model, which will inevitably lead to abnormal blood perfusion in brain tissue.3 The change rates of CBF values in both BM and normal brain regions reached the maximum at 30~40Gy, but the absolute CBF value decreased in BM was larger than that in normal brain region. In addition, with the development of radiotherapy technology, the perituberous edema was temporarily increased, and the blood flow and volume in the perituberous edema area were gradually decreased.Conclusions
In conclusion, this study suggests that the decreased CBF values result from the changes of the structure and function in brain regions. The recommended dose for normal brain regions should be controlled below 30Gy to avoid unnecessary damage on normal brain regions during radiotherapy. The radiation dose in the high perfusion area of BM should be adjusted to no less than 40Gy.Acknowledgements
No acknowledgement found.References
1.Ozsunar Y,Mullins M E,Kwong K,et al.Glioma recurrence versus radiation necrosis A pilot comparison of arterial spin labeled,dynamic susceptibility contrast enhanced MRI,and FDG-PET imaging[J].Acad Radiol,2010,17(3):282-290.
2.Choi Y J,Kim H S,Jahng G H,et al.Pseudoprogression in patients with glioblastoma: added value of arterial spin labeling to dynamic susceptibility contrast perfusion MR imaging[J].Acta Radiol,2013,54(4):448-454.
3.Shaw E G,Robbins M E. The management of radiation-induced brain injury[J].Cancer Treat Res,2006,128( 1) : 7-22.
Figures
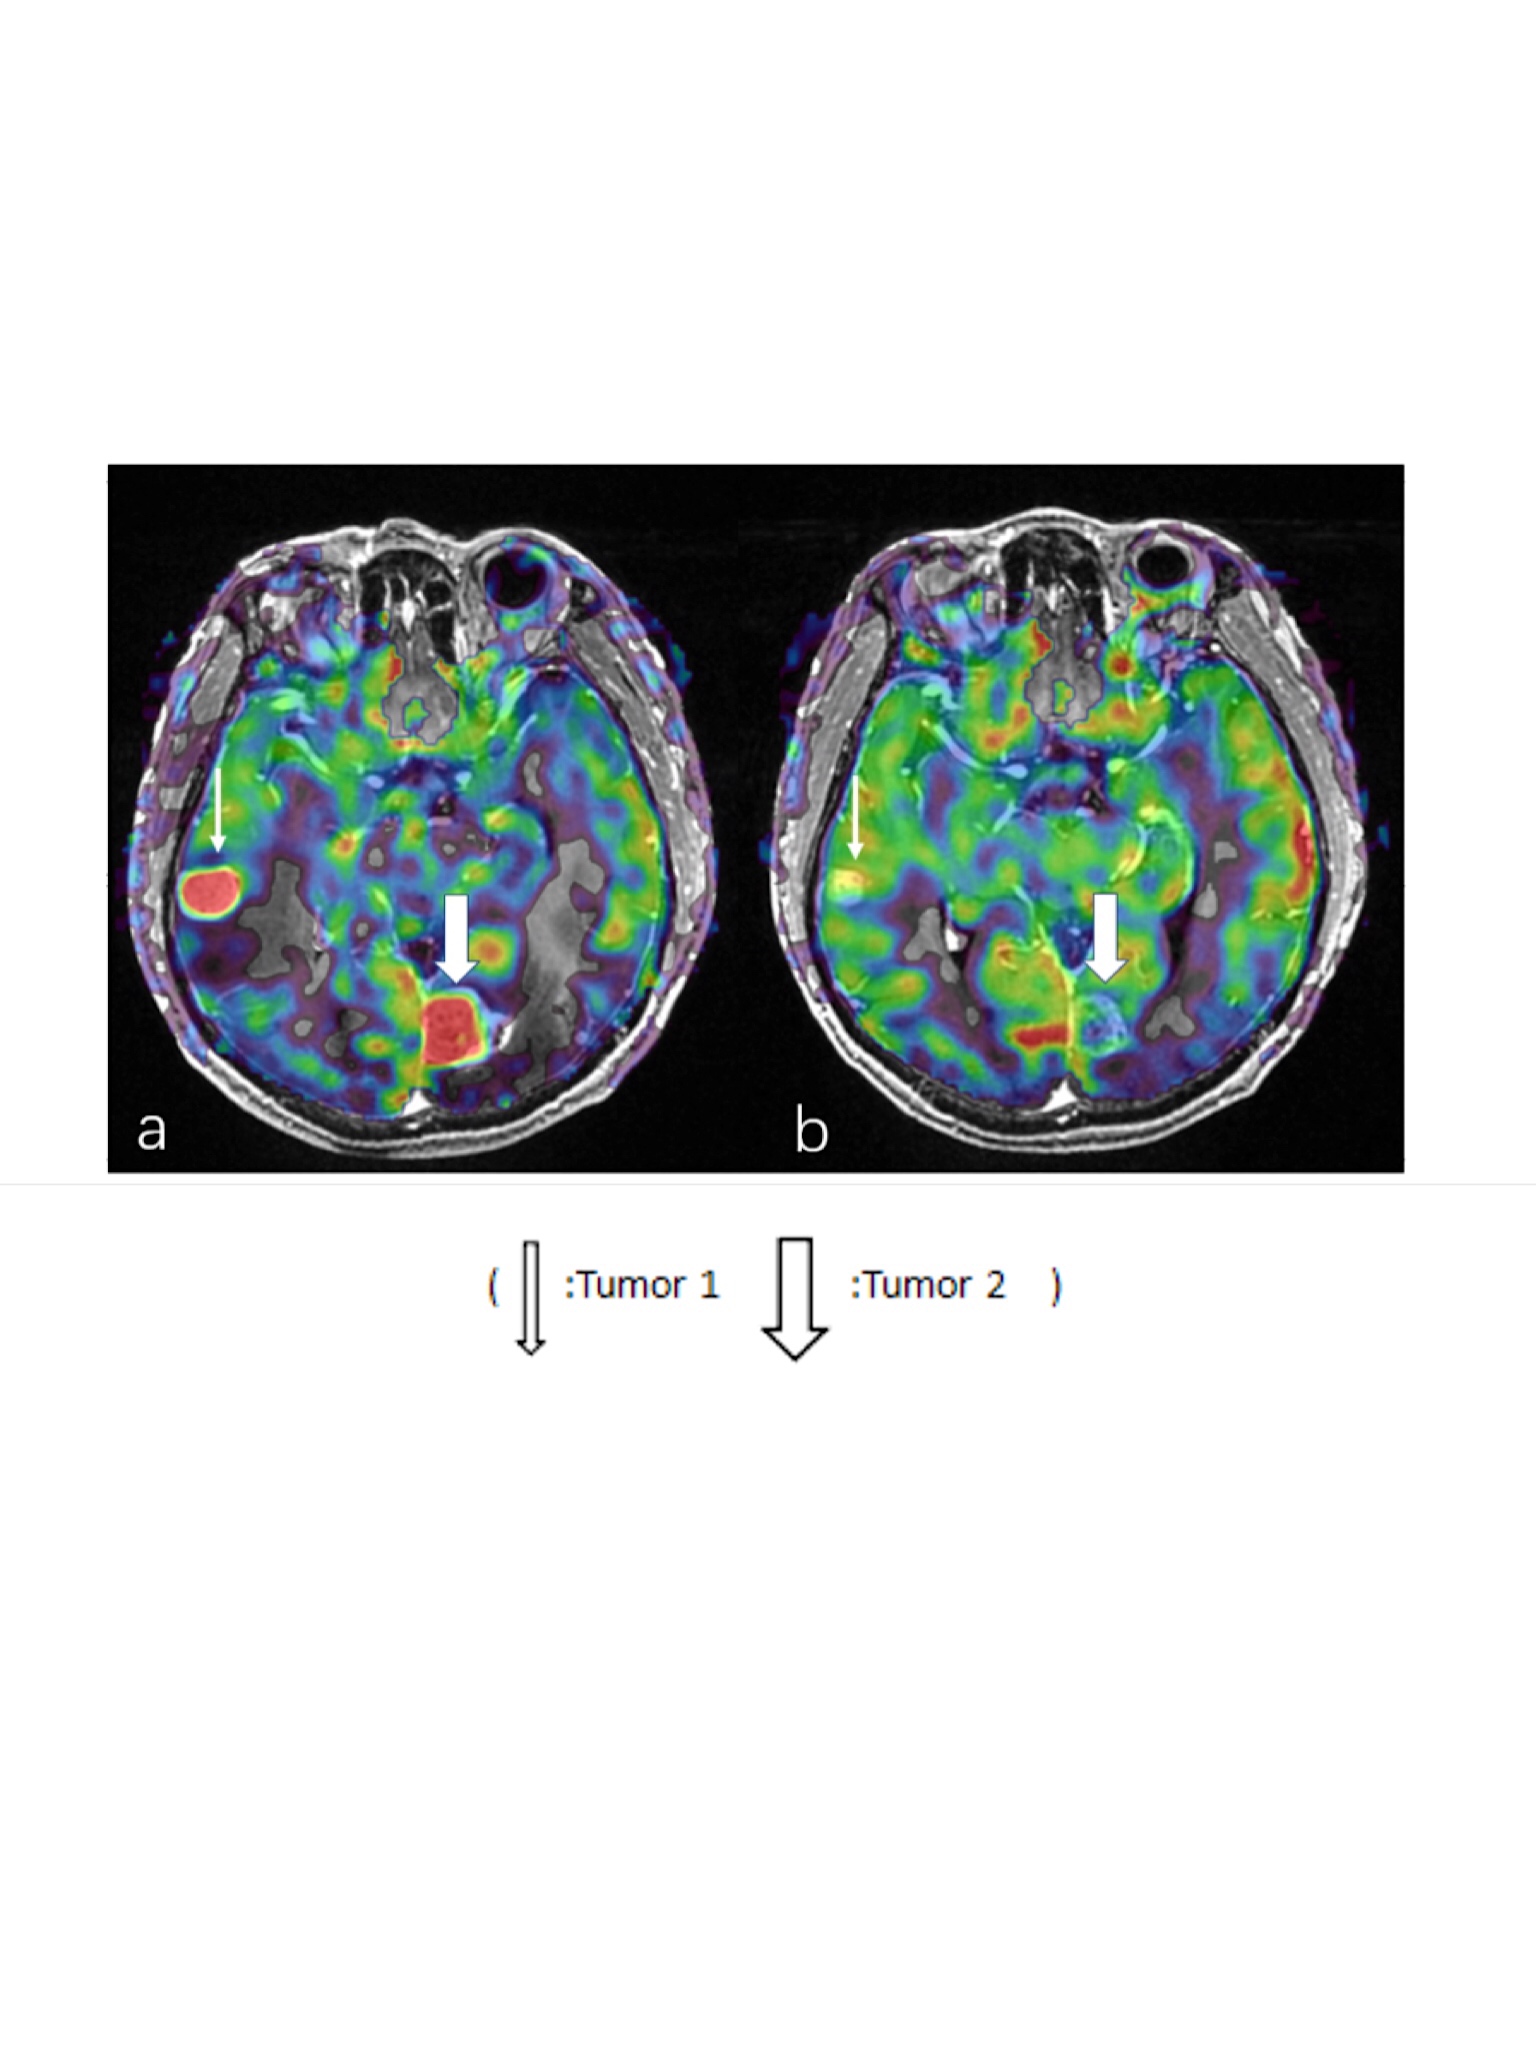
Figue 1: A 45-year-old woman with BM received radiotherapy. a: Enhanced T1WI image and 3D-ASL image before radiotherapy.Tumor 1: maximum cross-sectional area=245.20 mm2 and CBF=193.05 ml/min·100g; Tumor 2: maximum cross-sectional area=441.50 mm2 and CBF=144.38 ml/min·100g.b: Fusion registration image after radiotherapy. Tumor 1: maximum cross-sectional area=84.90 mm2 and CBF=63.46 ml/min·100g. Tumor 2: maximum cross-sectional area=224.60 mm2 and CBF=58.25 ml/min·100g.