4795
Multiparametric MRI as an early outcome predictor to chemotherapy and radiotherapy in cervical cancers1(1) Magnetic Resonance Research Center (MRRC), Yale University, New Haven, CT, United States, 2(2) Department of Diagnostic Radiology, Yale University, New Haven, CT, United States, 3Institute for Oncology and Radiology Of Serbia, Belgrade, Yugoslavia, 4Center for Quantitative Neuroscience with Magnetic Resonance (QNMR), Yale University, New Haven, CT, United States
Synopsis
Pre/early intra-treatment
prediction of patients with cervical cancer would enable treatment regimens to
be changed at an early time point. We focused on diffusion-weighted imaging (DWI)
and dynamic contrast-enhanced (DCE) MRI for quantifying of the tumor
microenvironment in prediction of treatment response. Perfusion fraction
multiplied by pseudo-diffusion coefficient, plasma flow, transfer constant
between plasma and extracellular extravascular space were the parameters
statistically significant associated with treatment outcome based on 95% CI in
multivariate logistic regression model. Multi-parametric MRI techniques have
the potential to assess tumor grade differentiation, and they showed additional
value in detecting and therefore, predicting treatment response.
Introduction
Uterus cervix cancer continuous to be the one of the leading cause of death worldwide among the women(1). Clinically relevant benefit of MRI for cervical cancer lies in the clear visualization of the cervical tumor in multiple planes allowing for a reliable volumetric definition assessment and surveillance of treatment response. Multi-parametric MRI sequences have been investigated to determine of resistance to radiotherapy because subtle functional changes of the tumor microenvironment can occur before morphological alterations, and thus provide quantitative results that may be used as imaging biomarkers.(2). The ADC has been shown to correlate with tissue cellularity; in addition, it has been shown that the exposure of tumors to both chemotherapy and radiotherapy leads to measurable increases in ADC for cases of favorable treatment response(3). ADC generated from DWI-MRI with routinely used mono-exponential model may not be accurate because it is influenced with microcirculation or blood perfusion. Bi-exponential model proposed by Le Bihan(4) may provide more clinical significant information about water diffusion. For analyzing the microcirculation, the most widely used technique is the tracer kinetics of bolus contrast agent by DCE-MRI. Increased uptake of contrast agent before treatment may reflect a tumor that is more oxygenated and more easily infiltrated with chemotherapy agents via the vasculature, thus improving the chance of treatment success(5). This study describes a potential usefulness of bi-exponential model of DWI-MRI and two compartment exchange model (2CXM) of DCE-MRI as an early predictors of treatment response in cervical cancer.Methods
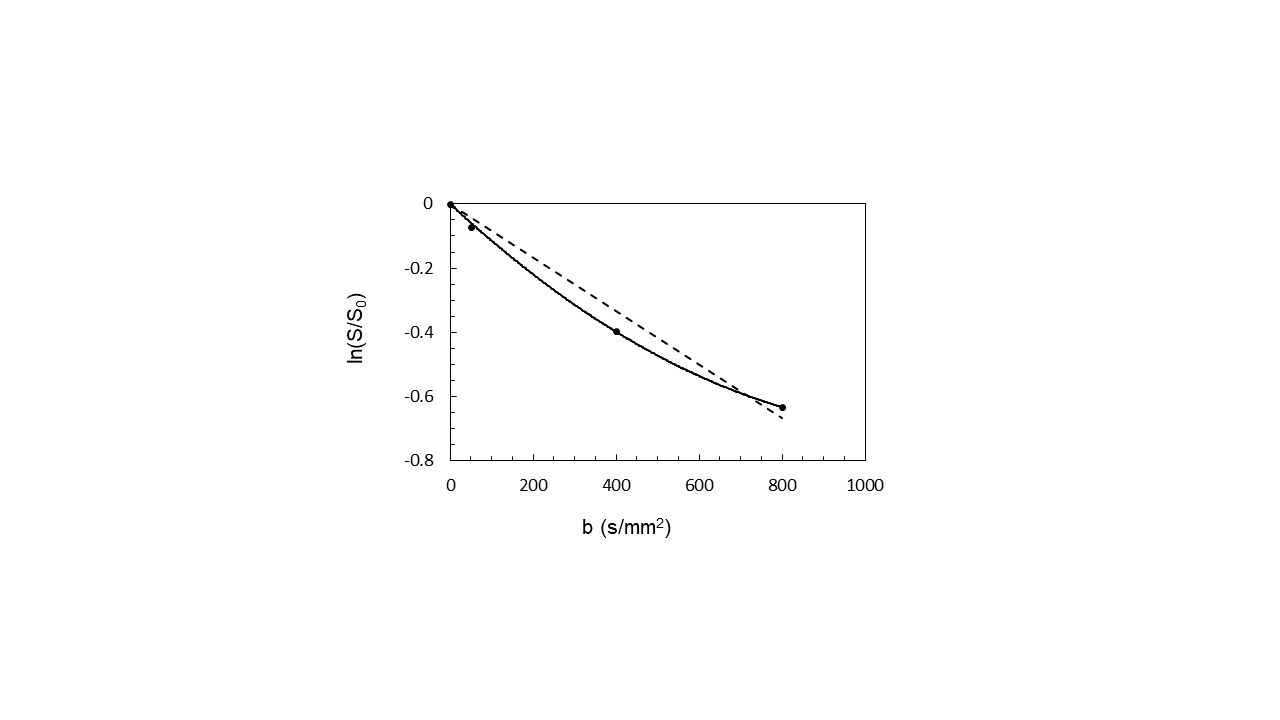
A total of 30 patients were recruited with pathologically diagnosed Squamous cell carcinoma (SCC). MRI for all patients was performed on 1.5T Siemens Magnetom AvantoFit scanner (Siemens Medical Solutions, Erlangen, Germany). Protocol for cervical cancer consists of T2 and T1 weighted turbo spin echo images with/without fat saturation in 3 orthogonal planes. High-resolution T2W images are acquired in oblique axial (perpendicular to the long axis of cervix), 512 × 256 matrix, 20-24 cm FOV, 4 mm slice thickness as mask for evaluation of primary tumor. DW-MRI in oblique axial plane was planned as high resolution T2W, performed with echo planar imaging (EPI) sequence, 4 different b= 0, 50, 400, 800 s/mm2. Diffusion parameters: apparent diffusion coefficient (ADC), perfusion fraction (f), true diffusion coefficient (D) and perfusion related pseudo-diffusion coefficient (D*) were calculated by mono and bi-exponential model as previously described(4). DCE-MRI, using 3D T1-weighted volumetric interpolated breath-hold examination (VIBE) sequence, was performed with temporal resolution of 5 s. A bolus of 0.1mmol/kg Gadovist (Bayer-Schering Pharma AG, Berlin, Germany) was administrated into 15 s dynamic scans at 2.5-3 ml/s using a power injection. Arterial input function (AIF) were measured by manually drawing an arterial ROI in the iliac artery. 2CXM parameters (plasma flow, Fp (mlmin-1ml-1); permeability surface-area product, PS (mlmin-1ml-1); fractional interstitial volume, ve and fractional plasma volume, vp were estimated. All analysis was done in Matlab2018b. On the end we investigated power of DW- and DCE-MRI in treatment outcome prediction using multivariate logistic regression analysis. Two groups were defined; responders (complete response (CR)) and non-responders (local/regional/distant relapse). Analysis was performed by using SPSS software (SPSS17.0, SPSS, Chicago, IL), and p values less than .05 indicated statistical significance.Results
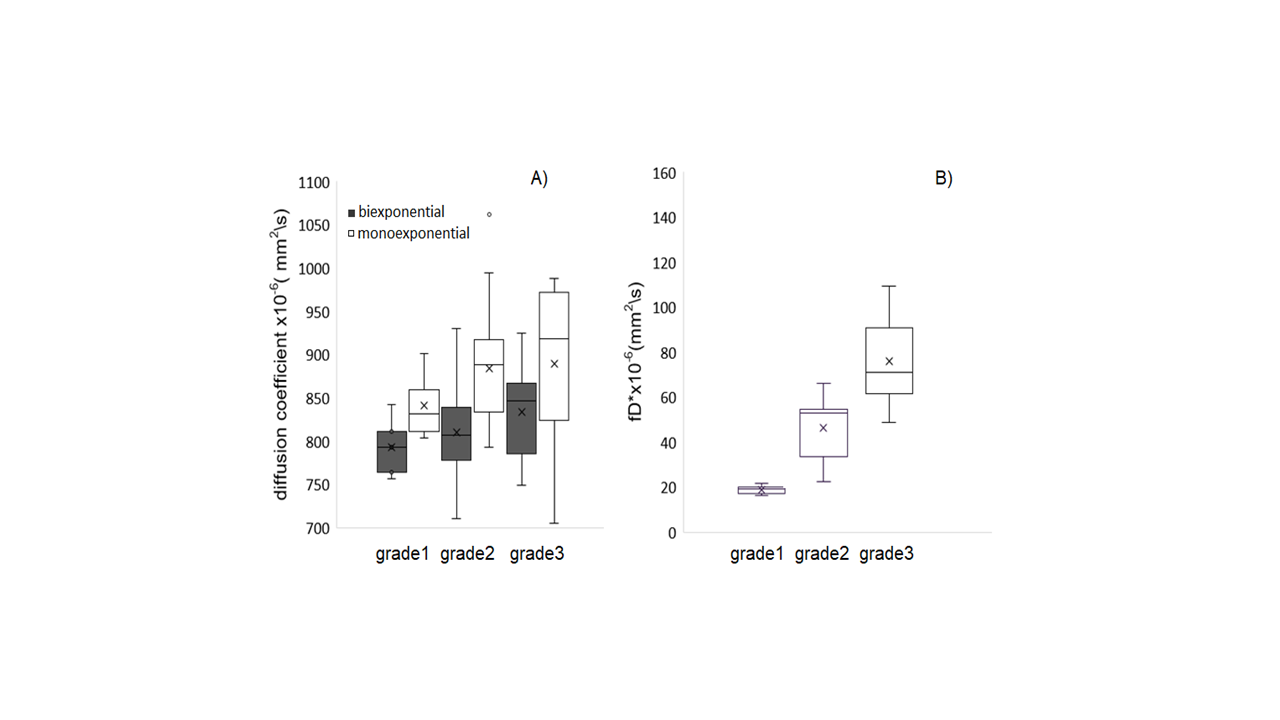
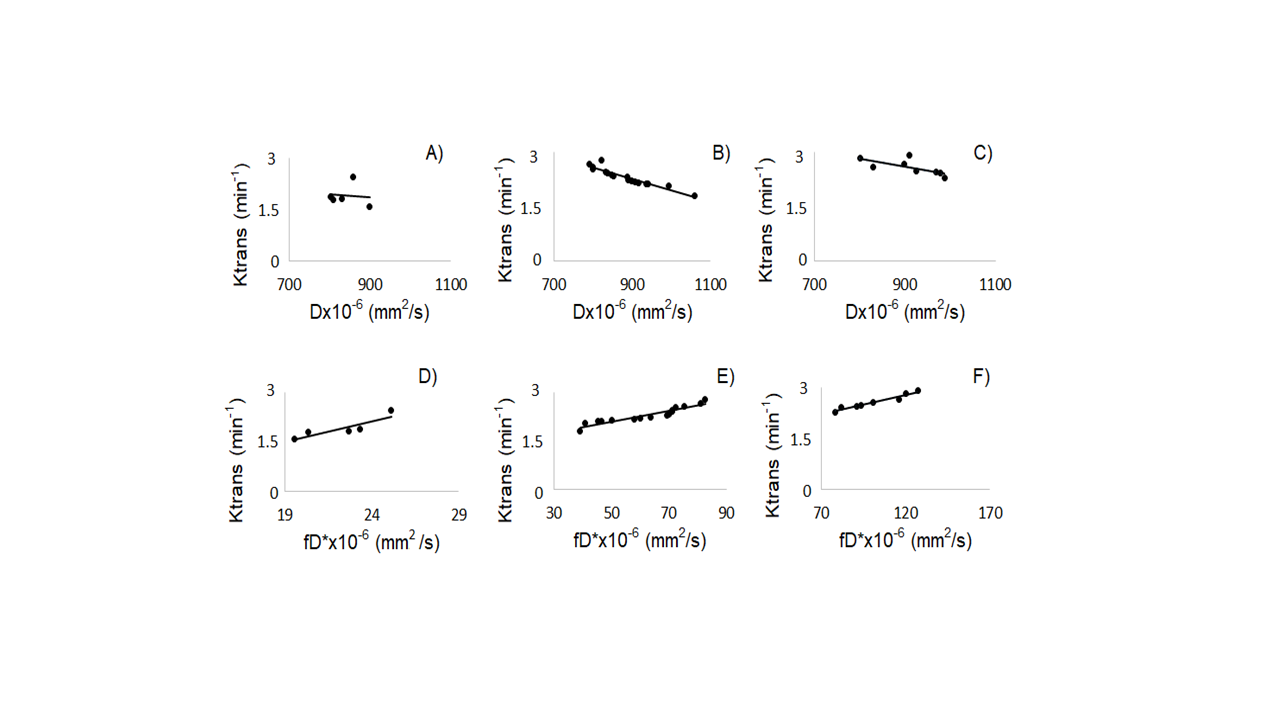
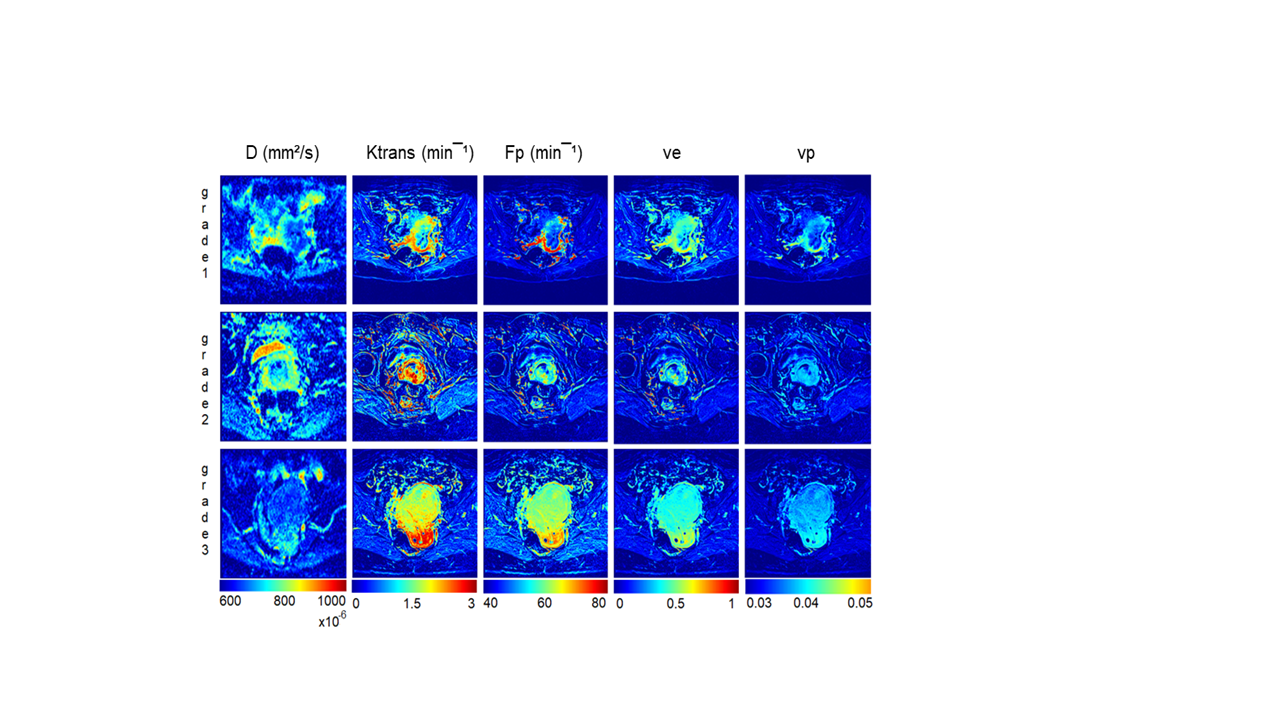
The DW-MRI values throughout the tumor area ranged from 700 to 1070×10-6 mm2/s for single-exponential and 690 to 1000x10-6 mm2 /s for bi-exponential model (Figure 1). The diffusion coefficient with bi-exponential model, D, had a lower value in comparison with diffusion coefficient with single-exponential model, ADC, with statistically significant difference between low grade and high grade SSC (p<0.041) (Figure 2A). Perfusion fraction multiplied by pseudo-diffusion coefficient (fD*) showed significant difference between tumor grades (Figure 2B). Also, we found positive relationship between perfusion related DWI parameter, fD* and DCE perfusion parameter Ktrans (Figure 3A-C) and inverse relationship between D and Ktrans (Figure 3D-F). The results for DCE-MRI showed elevated Ktrans and Fp along tumor (Figure 4). Based on Ktrans and Fp differentiation of low grade from high grade was possible (p<0.042 and p<0.04, respectively). Ve and vp showed low values for all tumor grades but without statistically significance difference. Multivariate logistic regression analysis showed that Ktrans, Fp and fD* were all significant predictors for estimating the responder vs non-responder group within 95% CI.Discussion
In this study we have presented pretreatment f and D*, Fp and Ktrans as parameters, statistically significant associated with treatment outcome. Tumor microvessels are likely contributing to the diffusion signal attenuation in bi-exponential model giving lower D values comparing with ADC. Depending on the properties of the tissue, after injection of contrast agent, the very first time of tissue enhancement are dependent of the pure perfusion rate; thereafter the extravasation of the contrast agent may become of paramount importance. Therefore, a positive correlation between fD* and Ktrans suggested relationship to tumor capillary leakiness and the blood flow. Higher Ktrans and Fp in responder group might indicate high blood supply, better oxygenation and more efficient treatment.Conclusions
Although DWI-MRI and DCE-MRI are not routinely used in chemotherapy and/or radiotherapy because they require complex image analysis, our results suggest that baseline perfusion related DWI-MRI and perfusion parameters from DCE-MRI are viable tools for grading and also predicting the early treatment outcome.Acknowledgements
References
1. Bray, Freddie, Jacques et al. Global Cancer Statistics 2018: GLOBOCAN Estimates of Incidence and Mortality Worldwide for 36 Cancers in 185 Countries. CA: A Cancer Journal for Clinicians 2018; 68 (6): 394–424.
2. O ’Connor J, Eric PB, Aboagye O, et al. Imaging Biomarker Roadmap for Cancer Studies. Nature Reviews Clinical Oncology. 2016; 14 (October): 169.
3. Hötker, Andreas M, Mazaheri Y, et al. Assessment of Prostate Cancer Aggressiveness by Use of the Combination of Quantitative DWI and Dynamic Contrast-Enhanced MRI. AJR 2016; 206 (4): 756–63.
4. Le Bihan D. What Can We See with IVIM MRI? NeuroImage. 2019; 187 (February): 56-67.
5. Dickie BR, Rose C, Kershaw L, et al.The Prognostic Value of Dynamic Contrast-Enhanced MRI Contrast Agent Transfer Constant Ktrans in Cervical Cancer Is Explained by Plasma Flow Rather than Vessel Permeability. British Journal of Cancer 2017; 116 (11): 1436–43.
Figures