4794
Multiparametric MRI to assess physiological changes induced by an anticancer therapy in neuroblastoma1Translational Radiomics Group, Quantitative Biology Unit, Luxembourg Institute of Health, Luxembourg, Luxembourg, 2Laboratory of Experimental Cancer Research, Department of Oncology, Luxembourg Institute of Health, Luxembourg, Luxembourg
Synopsis
Neuroblastoma (NB) is the most common extracranial solid tumor in childhood. High-risk patients have still a poor prognosis despite the therapeutic progress. The aim of this study is to assess by Magnetic Resonance Imaging (MRI) the physiological changes (perfusion and hypoxia) induced by an experimental anticancer therapy tested in a well-characterized preclinical transgenic neuroblastoma murine model. Our results show a decrease of the Ktrans parameter and relaxivity R2* value in treated mice compared to control, suggesting an impact of such therapy on vessels normalization.
Introduction
Neuroblastoma (NB) is the most common extracranial solid tumor in childhood [1]. NB patients are classified into different risk-groups according to age at diagnosis, stage of the disease and genetic alterations [2; 3; 4]. High-risk patients still have a poor prognosis despite the progress achieved with the introduction of immunotherapy [1; 5]. In this poster, we present results of a study aiming to assess the changes in tumour vascular supply and hypoxic state induced by an experimental anticancer therapy, using a well-characterized preclinical transgenic murine model of NB [6] and Magnetic Resonance Imaging (MRI).Methods
Dynamic contrast enhanced (DCE) and relaxometry MRI data sequences were acquired from animals developing an abdominal mass. The diagnostic process included abdominal palpation and T2-weighted imaging. The animals were randomly assigned into control group and treated group, respectively receiving the vehicle or the experimental drug intraperitoneally for 2 days. We acquired the full MRI protocol (Figure 1) at two different time points, before and after treatment. After the final scan, mice were sacrificed and the tumours were collected for histological analysis (Figure 2). MRI sequences were acquired on a 3T preclinical scanner (MR Solutions, Guilford, UK), equipped with a quadrature mouse body coil. Animals were anesthetised with isoflurane and their body temperature maintained throughout the scans. Pharmacokinetic (PK) analysis of the DCE-MRI data was performed using nordicICE (NordicNeuroLab, Bergen, Norway), and perfusion parameters in the tumours were normalized to values in the liver [7]. Relaxometry data (T1, T2 and T2* maps) was also analysed in nordicICE. T1 mapswere used in the PK analysis, while the T2 and T2* maps were used as surrogate markers of hypoxia [8; 9]. The relaxivity rates R1 (1/ T1), R2 (1/ T2) and R2* (1/ T2*) were also calculated.Results
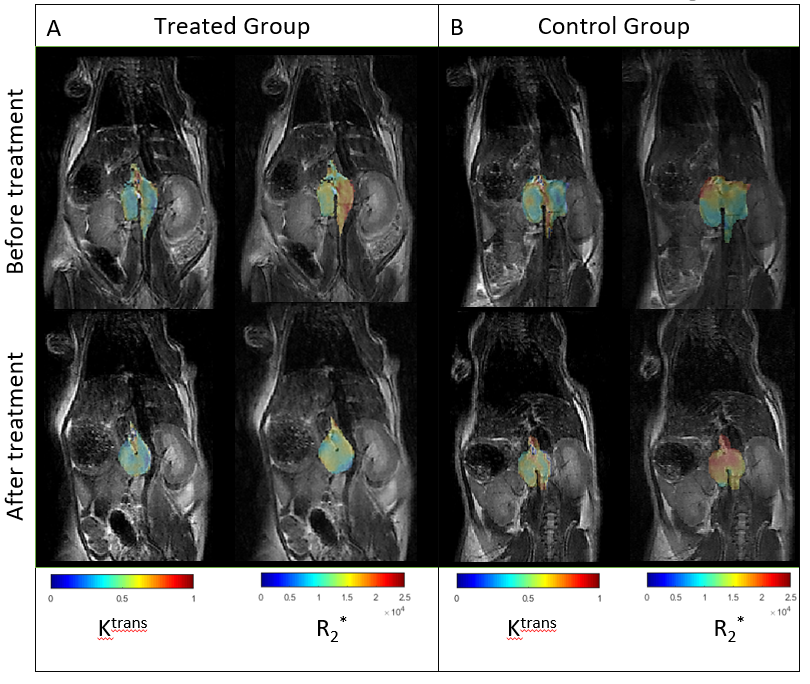
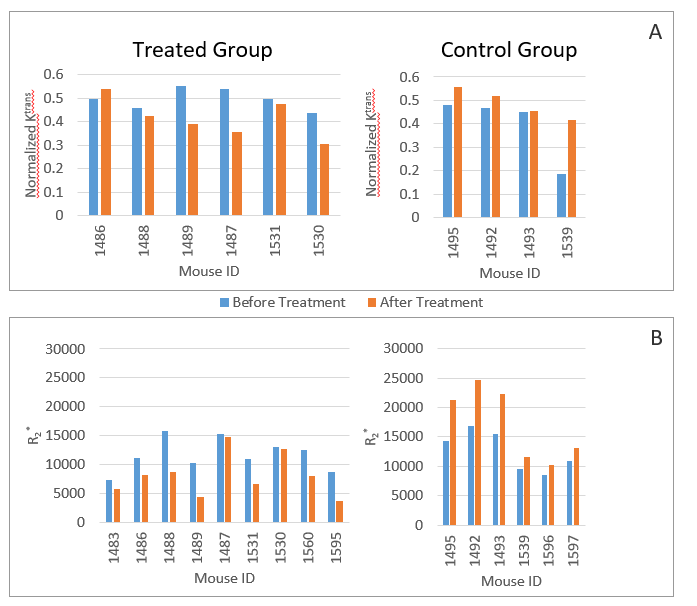
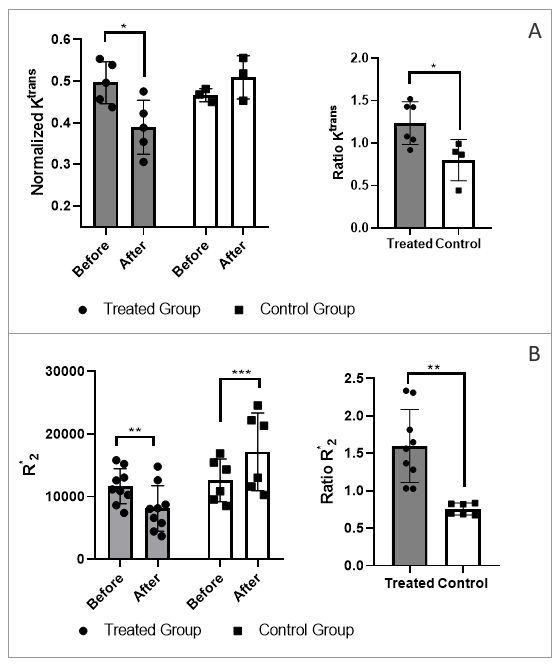
Figure 3 shows representative images of the Ktrans and R2* maps generated for one treated and one control mouse, before and after treatment.DCE: We found that the blood-to-tissue transfer parameter Ktrans was decreased in the treated animals and increased in the control animals (Figure 4A). The reduction was significant (p = 0.017) in the treated group, but not in the controls group (Figure 5A-left). The significant change (p = 0.026) was also supported by the increased ratio of before-to-after treatment Ktrans values (Figure 5A-right).
Relaxometry: We also showed that almost all mice in the treatment group exhibited a decrease of their tumoral R2* median values, while such values were increased in the controls group (Figure 4B). Figure 5B shows a significant decrease in median tumoral R2* for the treatment group (p = 0.0015) and a significant increase for the controls group (p = 0.0006). The significant change (p = 0.0012) are also evidenced by the ratios of before-to-after treatment R2* values (Figure 5B-right).
Discussion:
DCE-MRI PK analysis showed a decrease of the perfusion parameter Ktrans in the treated group, indicating an effect of the therapy on the vasculature normalization, which was associated with a decrease in tumor volumes. In the control group, Ktrans increased slightly. Analysis of the relaxation parameter R2*, which had previously been associated with hypoxia [9; 10], suggests that hypoxia was decreased in the treated animals and increased for the control ones. Vessels normalization and reduced hypoxia also correlated with a response to treatment in the treatment group, evidenced by reduced tumor volumes. These physiological parameters assessed in vivo by MRI were further validated by histology.Conclusions
We have shown that a multimodal strategy is useful in assessing the response to therapies in neuroblastoma and provides insights into important physiological changes induced by the therapy. Vascular normalisation and hypoxic state of the tumor assessed by in vivo MRI, later confirmed by histology, were found to be predictive of response to therapy.Acknowledgements
No acknowledgement found.References
1. Maris, J.M., Recent advances in neuroblastoma. N Engl J Med, 2010. 362(23): p. 2202-11.
2. Louis, C.U. and J.M. Shohet, Neuroblastoma: molecular pathogenesis and therapy. Annu Rev Med, 2015. 66: p. 49-63.
3. Cohn, S.L., et al., The International Neuroblastoma Risk Group (INRG) classification system: an INRG Task Force report. J Clin Oncol, 2009. 27(2): p. 289-97.
4. Monclair, T., et al., The International Neuroblastoma Risk Group (INRG) staging system: an INRG Task Force report. J Clin Oncol, 2009. 27(2): p. 298-303.
5. Pinto, N.R., et al., Advances in Risk Classification and Treatment Strategies for Neuroblastoma. J Clin Oncol, 2015. 33(27): p. 3008-17.
6. Obad N. et al., Lack of functional normalisation of tumour vessels following anti-angiogenic therapy in glioblastoma. J Cereb Blood Flow Metab. 2018 Oct;
7. Jamin Y., Evaluation of clinically translatable MR imaging biomarkers of therapeutic response in the TH-MYCN transgenic mouse model of neuroblastoma. Radiology. 2013 Jan;266(1):130-40. 2012 Nov
8. Jamin Y., Intrinsic Susceptibility MRI Identifies Tumors with ALKF1174L Mutation in Genetically-Engineered Murine Models of High-Risk Neuroblastoma. PlosOne Published: March 25, 2014
Figures