4793
Radiogenomic Analysis using Dynamic Histogram Parameters of MR Perfusion-weighted Imaging in Glioblastoma1Taipei Medical University, Taipei City, Taiwan, 2Taipei Medical University and National Health Research Institutes, Taipei City, Taiwan, 3CT/MR Division, Rotary Trading CO.,LTD, Taipei City, Taiwan, 4China Medical University, Taichung City, Taiwan
Synopsis
Imaging features contain information that reflects underlying pathophysiology but are distinct from that provided by assessments of tumor specimens, which can involve sampling errors because of selection bias of a localized sampling area. Most of the imaging assessment are based on the static and structural MRI and less has been done to perfusion-weighted imaging (PWI) which can reveal tumor vascularity. Time-dependent dynamic histogram parameters of PWI were derived and correlated with the survival rate and gene expression data. Our study demonstrated that the time-dependent information of dynamic histogram parameters can provide additional information regarding survival rate and GBM angiogenesis pathways.
Purpose
Radiomics is an automated high throughput extraction of imaging features which can capture microscale information hidden within imaging 1. Quantitative image features can provide more essential information on tumor phenotype and environment such as the characterization of tumor heterogeneity 2, 3. However, most of the imaging assessment are based on the static and conventional structural MRI (including T1-weighted imaging and T2-weighted imaging), and less has been done to MR perfusion-weighted imaging (PWI) techniques. Perfusion-weighted imaging techniques can provide markers that are needed to investigate the underlying molecular processes which cannot be evaluated by using the conventional MR imaging techniques. The dynamic histogram analysis of PWI may provide further information of mechanistic insight into tumor vascularity and progression4. In the present study, we investigated the quantitative image features derived from time-dependent dynamic PW histogram parameters in the differentiation of survival rate for patients with glioblastomas. We also investigated the feasibility of time-dependent dynamic PW histogram parameters for radiogenomic mapping in angiogenesis-related genes in glioblastoma.Materials and Methods
Patients with glioblastoma in the Cancer Imaging Archive (TCIA)5 collected from two institutions were included. We recruited 45 patients with glioblastoma in our present study. All the patients were separated into two groups according to overall survival (OS). Twenty-three patients were included in the long-term survival group (OS ≥12 months) and 22 patients were included in the short-term survival group (OS <12 months)6. The perfusion-weighted images (PWIs) were acquired from T2*-weighted gradient-echo echo-planar imaging with TE=40~54ms and TR=1250ms~2000ms. The acquisition matrix was 128 x 128 with the range of 3 to 6mm section thickness. Difference PW imaging time-series was first calculated by the difference between the baseline imaging (before the passage of contrast agent) and PWI (after the passage of contrast agent) at each time point. ROIs of the complete tumors were drawn in each section according to high signal intensity areas to define the outermost tumor margin. The areas of contrast enhancement observed on the postcontrast T1-weighted images, excluding cystic or necrotic regions and nontumor macrovessels, were always included 7, 8. All the ROIs were applied to the difference PW images time-series at the corresponding locations for each patient and the pixel intensity histograms were computed separately for all difference images of the time series. The following histogram parameters were derived from the whole-tumor histogram at each time point of the difference images time series: (a) mean; (b) standard deviation (SD); (c) peak height; (d) mode (peak position); (e) kurtosis; (f) skewness; (g) the percentiles of cumulative histogram. The area under the histogram curve was normalized to the value of one. A total of 56 quantitative time-dependent image features from four different periods of cardiac ejection fraction time intervals following the passage of contrast agent bolus (periods of baseline, wash-in flow, wash-out flow and recirculation) were calculated by averaging the time points from each period3. The Mann–Whitney U tests were performed for comparing histogram parameters between the long-term and short-term OS groups. The corresponding microarray angiogenesis-related gene expression data (from the Cancer Genome Atlas, TCGA)5, clinical chemotherapy drug information and overall survival were interrogated for statistical correlation analyses with quantitative image features parameters.Results
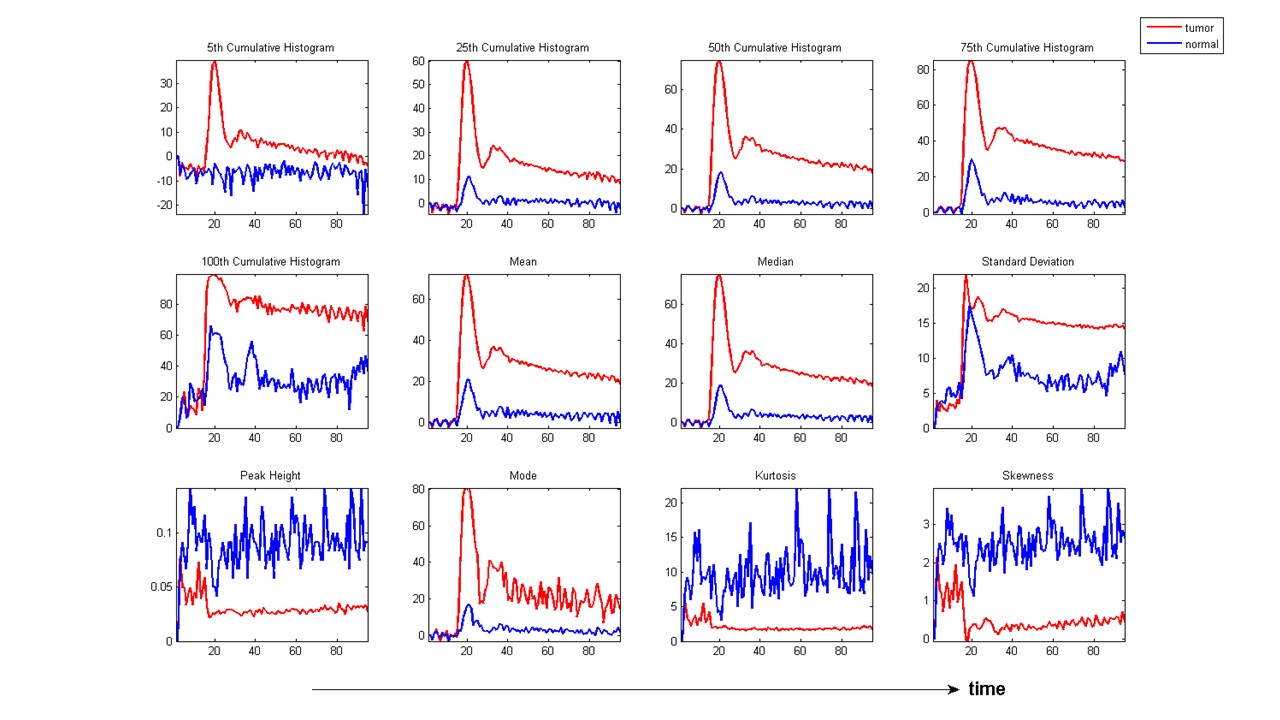
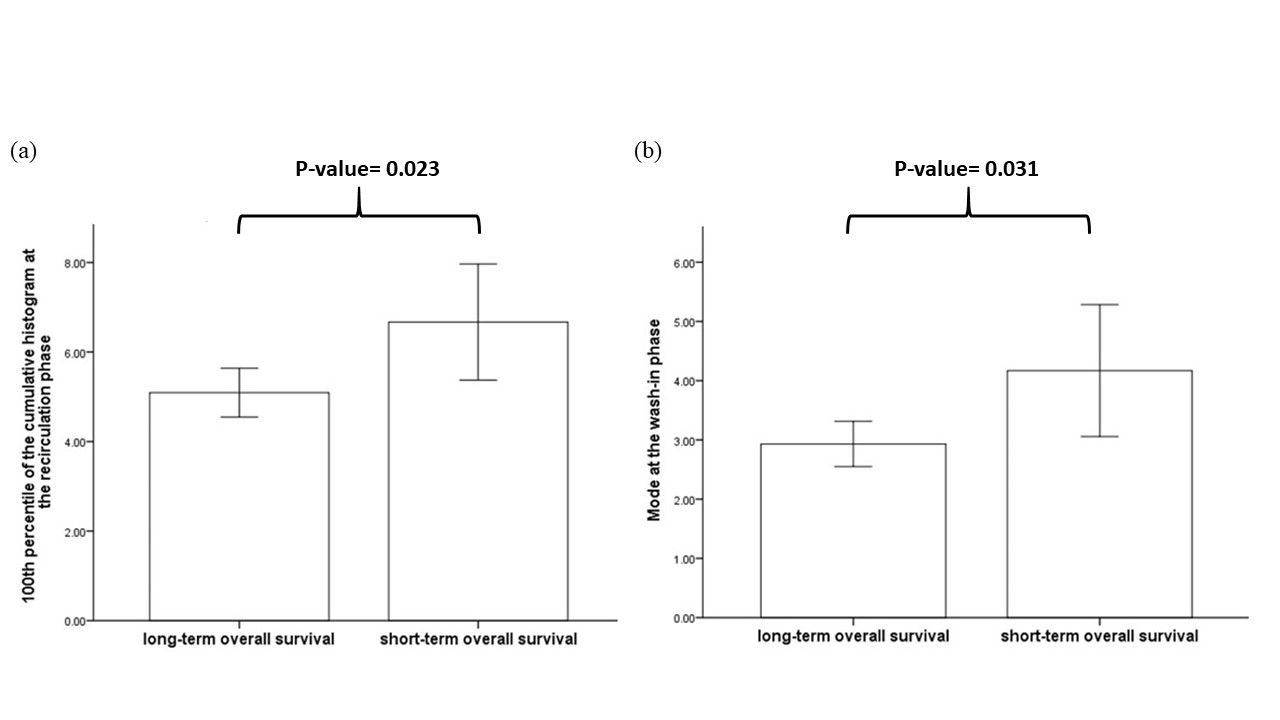
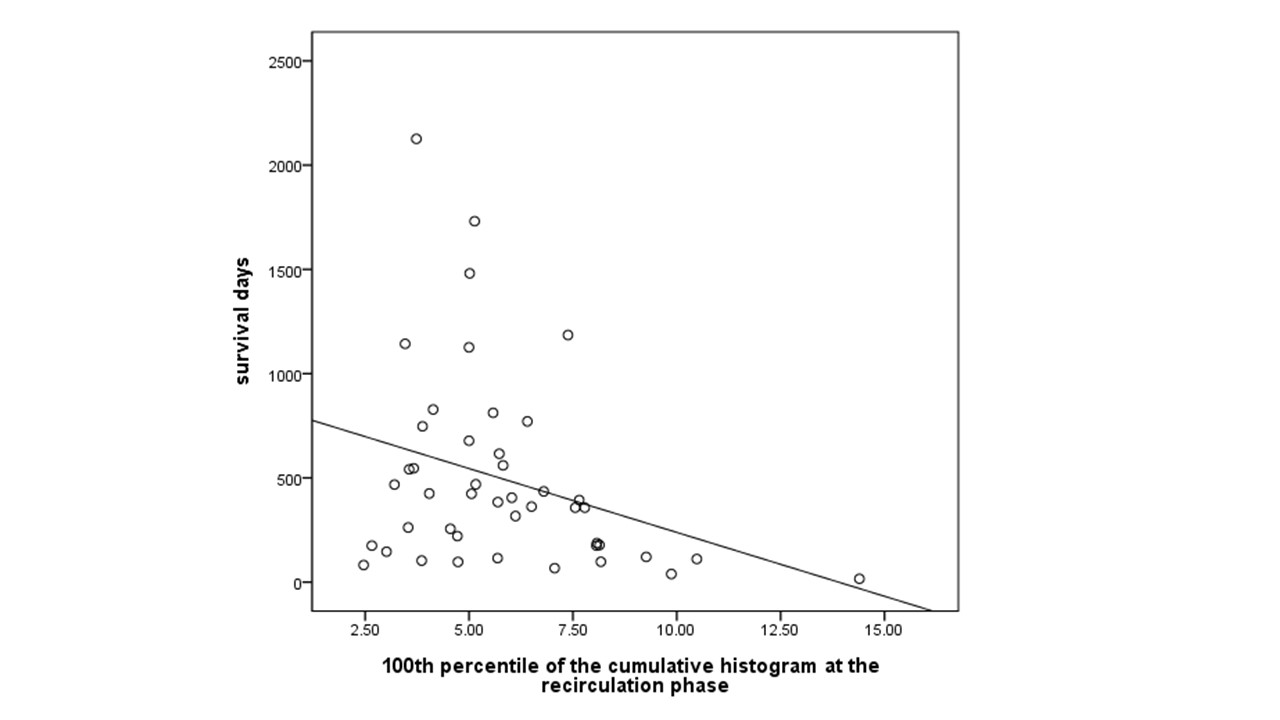
Figure1 showed the representative time-dependent dynamic histogram parameters of the difference PW imaging time-series from a patient with glioblastoma. Tumor area showed a different pattern of the dynamic histogram parameter changes as compared with the contralateral normal area. In general, tumor showed higher vascularity activity (higher blood volume-related parameters such as mean, median, mode of histogram, and percentiles of cumulative histograms) and more heterogeneous morphology (lower peak height, kurtosis, skewness and higher standard deviation which reveal heterogeneous morphology of tumor vascularity). The long-term OS group showed significantly lower values of mode at the wash-in phase and 100th percentile of the cumulative histogram at the recirculation phase as compared with the short-term OS group (Figure2, P<0.05). We also found a significant correlation between the 100th percentile of the cumulative histogram at the recirculation phase and the survival days for those patients (Figure 3, P=0.03). The imaging parameters of mean skewness and kurtosis derived from the whole time series showed significant correlations with gene expression levels in HIF1α (P=0.001) and TIE1(P<0.001), respectively. VEGFa also showed significant correlation with the 75th percentile of the cumulative histogram (P=0.008).Discussion and conclusion
Our study consistently indicated that high-grade gliomas have increased tumor vascular proliferation and angiogenesis as revealed in mean, median, mode and percentiles of the cumulative histogram parameters as compared with the contralateral normal area. High-grade gliomas showed lower kurtosis in perfusion-weighted imaging. These findings were corroborated by the results of wider distribution with lower peak height and higher standard deviation of tumors. The finding of the significant correlation between the 100th percentile of the cumulative histogram at the recirculation phase and the survival days supports that increases in neovascularization are associated with high tumor aggressiveness and low survival rates9. Moreover, the direct correlation between the imaging features and angiogenesis-related genes suggested that the time-dependent information as provided by the dynamic histogram parameters derived from MR perfusion-weighted imaging can potentially provide increased accuracy with additional information regarding GBM angiogenesis pathways and explore potential new targets in this regard.Acknowledgements
No acknowledgement found.References
1. Zinn PO, Singh SK, Kotrotsou A, Hassan I, Thomas G, Luedi MM, et al. A coclinical radiogenomic validation study: Conserved magnetic resonance radiomic appearance of periostin-expressing glioblastoma in patients and xenograft models. Clin Cancer Res. . 2018;24:6288-6299
2. Kim H, Choi SH, Kim JH, Ryoo I, Kim SC, Yeom JA, et al. Gliomas: Application of cumulative histogram analysis of normalized cerebral blood volume on 3 t mri to tumor grading. PloS one. 2013;8:e63462
3. Verma RK, Slotboom J, Heldner MR, Kellner-Weldon F, Kottke R, Ozdoba C, et al. Characterization of microcirculation in multiple sclerosis lesions by dynamic texture parameter analysis (dtpa). PLoS One. 2013;8:e67610
4. Slotboom J, Schaer R, Ozdoba C, Reinert M, Vajtai I, El-Koussy M, et al. A novel method for analyzing dsce-images with an application to tumor grading. Invest Radiol. . 2008;43
5. Clark K, Vendt B, Smith K, Freymann J, Kirby J, Koppel P, et al. The cancer imaging archive (tcia): Maintaining and operating a public information repository. J Digit Imaging. 2013;26:1045-1057
6. Zhang X, H. L, Tian Q, Feng N, Yin L, Xu X, et al. A radiomics nomogram based on multiparametric mri might stratify glioblastoma patients according to survival. Eur Radiol. 2019;29:5528-5538
7. Jung SC, Yeom JA, Kim JH, Ryoo I, Kim SC, Shin H, et al. Glioma: Application of histogram analysis of pharmacokinetic parameters from t1-weighted dynamic contrast-enhanced mr imaging to tumor grading. AJNR Am J Neuroradiol. 2014 35:1103-1110
8. Baek HJ, Kim HS, Kim N, Choi YJ, Kim YJ. Percent change of perfusion skewness and kurtosis: A potential imaging biomarker for early treatment response in patients with newly diagnosed glioblastomas. Radiology. 2012;264:834-843
9. Sanz-Requena R, Revert-Ventura A, Martí-Bonmatí L, Alberich-Bayarri A, García-Martí G. Quantitative mr perfusion parameters related to survival time in high-grade gliomas. Eur Radiol. 2013;23:3456-3465
Figures