4791
DSC and DCE histogram analyses of diffuse glioma biomarkers, including IDH, MGMT and TERT, on differentiation1Shenzhen Second People's Hospital, ShenZhen, China, 2Siemens Healthineers, Guangzhou, China
Synopsis
The molecular types of glioma including isocitrate dehydrogenase (IDH), O6-methylguanine-DNA methyltransferase (MGMT) and telomere reverse transcriptase (TERT), influence the therapeutic effect and prognosis of patients with diffuse gliomas. We combined DSC and histogram analysis of DCE methods in the diagnosis of diffuse glioma with different molecular types, in order to find biomarkers based on perfusion parameters to predict specific genotypes, and guide doctors to evaluate the prognosis of chemotherapy of patients.
Background and Purpose:
Diffuse gliomas are common tumors of the central nervous system (CNS) with high invasiveness and a poor prognosis. In the new World Health Organization (WHO) 2016 classification of CNS tumors, the molecular type of glioma was added due to differences in treatment and prognosis(1). Specifically, the status of molecular markers, such as isocitrate dehydrogenase (IDH), O6-methylguanine-DNA methyltransferase (MGMT) and telomere reverse transcriptase (TERT), affects the sensitivity of patients to radiotherapy and chemotherapy drugs, such as temozolomide (TMZ) and alkylating agents(2). Compared with a histological biopsy, a preoperative non-invasive magnetic resonance imaging (MRI) examination is used to make a preliminary judgement on the molecular typing of patients with diffuse glioma and has a very positive effect on the surgical plan(3,4). Here, we evaluated the performance of DSC and DCE-MRI histogram analyses in discriminating the states of molecular biomarkers of diffuse glioma patients.Materials and Methods:
A total of 43 patients (20 males and 23 females, age 47±13 years) who underwent DCE- and DSC-MRI on a 3 Tesla MRI scanner (MAGNETOM Prisma; Siemens Healthcare, Erlangen, Germany) with a 20-channel encoding head coil were enrolled. According to the molecular pathological findings of IDH, MGMT and TERT gene type, patients were divided into three comparative experimental groups: the IDH group (mutant (n=20), wild-type (n=23)), the MGMT group (methylation (n=24), unmethylated (n=19)) and the TERT group (mutant (n=25), wild-type (n=18)). Axial DCE-MRI was performed with a volume interpolated gradient echo (VIBE) sequence. Five preconstrast T1-weighted VIBE sequences with flip angles of 3, 6, 9, 12 and 15° were acquired before administration of the contrast agent for T1 mapping. After a delay of six baseline acquisitions (30 s), the enhanced VIBE sequences were obtained. An intravenous injection of gadodiamide (Omniscan, GE Healthcare, Dublin, Ireland) was carried out at an injection rate of 3.5 mL/s via a power injector (0.1 mmol/kg), followed by a flush of 10 mL normal saline. The parameters were as follows: TR/TE =5.06/1.98 ms; slice thickness =3.5 mm; FOV =200×200 mm2; matrix = 192×192; flip angle =12°. A total of seventy-five dynamic phases were obtained with a temporal resolution of 6 s and completed in 5 min 27 s. DSC-MRI was performed using a gradient EPI sequence (TR =1600 ms; TE =30 ms; flip angle=90°; NEX=1; section thickness=4 mm; FOV=220×220 mm2; matrix size=128×128). After patients underwent a baseline period with five scans (total time 7.6 s), a dose of 0.1 mmol/kg of gadodiamide followed by a 10-mL saline flush was administered at a rate of 3.5 mL/s using a power injector. A total of 60 phase images were acquired within 1 min 42 s for all patients. The mean relative cerebral blood volume (rCBV) of DSC-MRI and histogram parameters derived from DCE-MRI (volume transfer coefficient (Ktrans), fractional volume of the extravascular extracellular space (EES) (Ve), fractional blood plasma volume (Vp), rate constant between the EES and blood plasma (Kep) and area under the curve (AUC)) were calculated. Differences in each parameter between diffuse gliomas with different expression states (IDH, MGMT and TERT) were evaluated. The diagnostic efficiency of each parameter was analysed.Result:
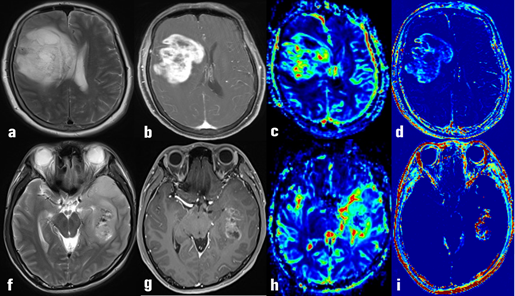
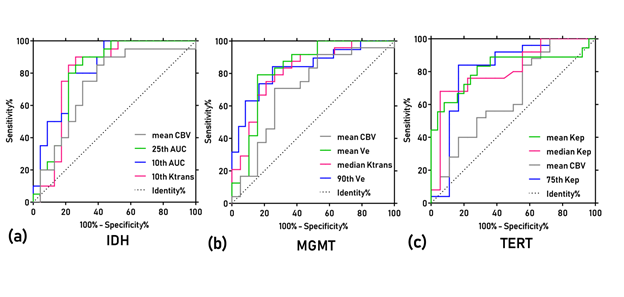
A representative case of MGMT methylation and unmethylation for the comparison of the histogram analyses based on DCE-MRI and the CBV of DSC-MRI was shown in Figure 1. The 10th percentile AUC (AUC=0.830, sensitivity =0.78, specificity=0.80), the 90th percentile Ve (AUC=0.816, sensitivity =0.84, specificity=0.79) and the mean Kep (AUC=0.818, sensitivity=0.76, specificity=0.78) provided the highest differential efficiency for IDH, MGMT and TERT(figure 2).Discussion and conclusion:
Since the WHO 2016 CNS classification overshadowed the traditional organizational classification, a molecular classification was added, and the state of the genotype cannot be judged by a single parameter. This study mainly used two methods of perfusion-weighted imaging, DCE and DSC weighted imaging, and further refined the judgement of the molecular classification by histogram analyses. Our study mapped specific parameters to specific genotypes, and Histogram DCE-MRI demonstrates good diagnostic performance in identifying different molecular of diffuse glioma.Acknowledgements
NoReferences
1.Wesseling P, Capper D. WHO 2016 Classification of gliomas. Neuropathol Appl Neurobiol 2018;44:139-150.
2.Barresi V, Conti A, Tomasello F. Commentary: Radiological Characteristics and Natural History of Adult IDH-Wild-Type Astrocytomas With TERT Promoter Mutations. Neurosurgery 2019.
3.Delgado AF, Delgado AF. Discrimination between Glioma Grades II and III Using Dynamic Susceptibility Perfusion MRI: A Meta-Analysis. AJNR Am J Neuroradiol 2017;38:1348-1355.
4.Romano A, Pasquini L, Di Napoli A, et al. Prediction of survival in patients affected by glioblastoma: histogram analysis of perfusion MRI. J Neurooncol 2018;139:455-460.
Figures