4790
Differential diagnosis of central lymphoma and high-grade glioma: dynamic contrast enhanced histogram1Shenzhen Second People's Hospital, ShenZhen, China, 2MR Scientific Marketing, Siemens Healthineers, Guangzhou, China
Synopsis
Accurate identification between central nervous system lymphoma (CNSL) and high-grade glioma (HGG) has a great impact on the clinical treatment planning of the patients. This study uses the histogram analysis of dynamic contrast-enhanced (DCE) MRI to distinguish CNSL and HGG. Histogram features based on DCE pharmacokinetic parameters were used and achieved high diagnostic efficiency, which provides imaging features for guiding clinical treatment.
Background and Purpose:
Central nervous system lymphoma (CNSL) and high-grade glioma (HGG) are both disorders with poor prognosis in the central nervous system, which are difficult to distinguish clinically (1,2). However, the treatment regimen for these two tumor types is completely different. Therefore, how to distinguish these two types of tumors in preoperative imaging is very important for the formulation of the program. Histogram analysis which is sensitive to tumor heterogeneity can extract more information that is invisible to the naked eyes (3). In this study, we evaluated the diagnostic efficacy of the histogram analysis of dynamic contrast-enhanced (DCE) MRI in the identification of CNSL and HGG.Materials and Methods:
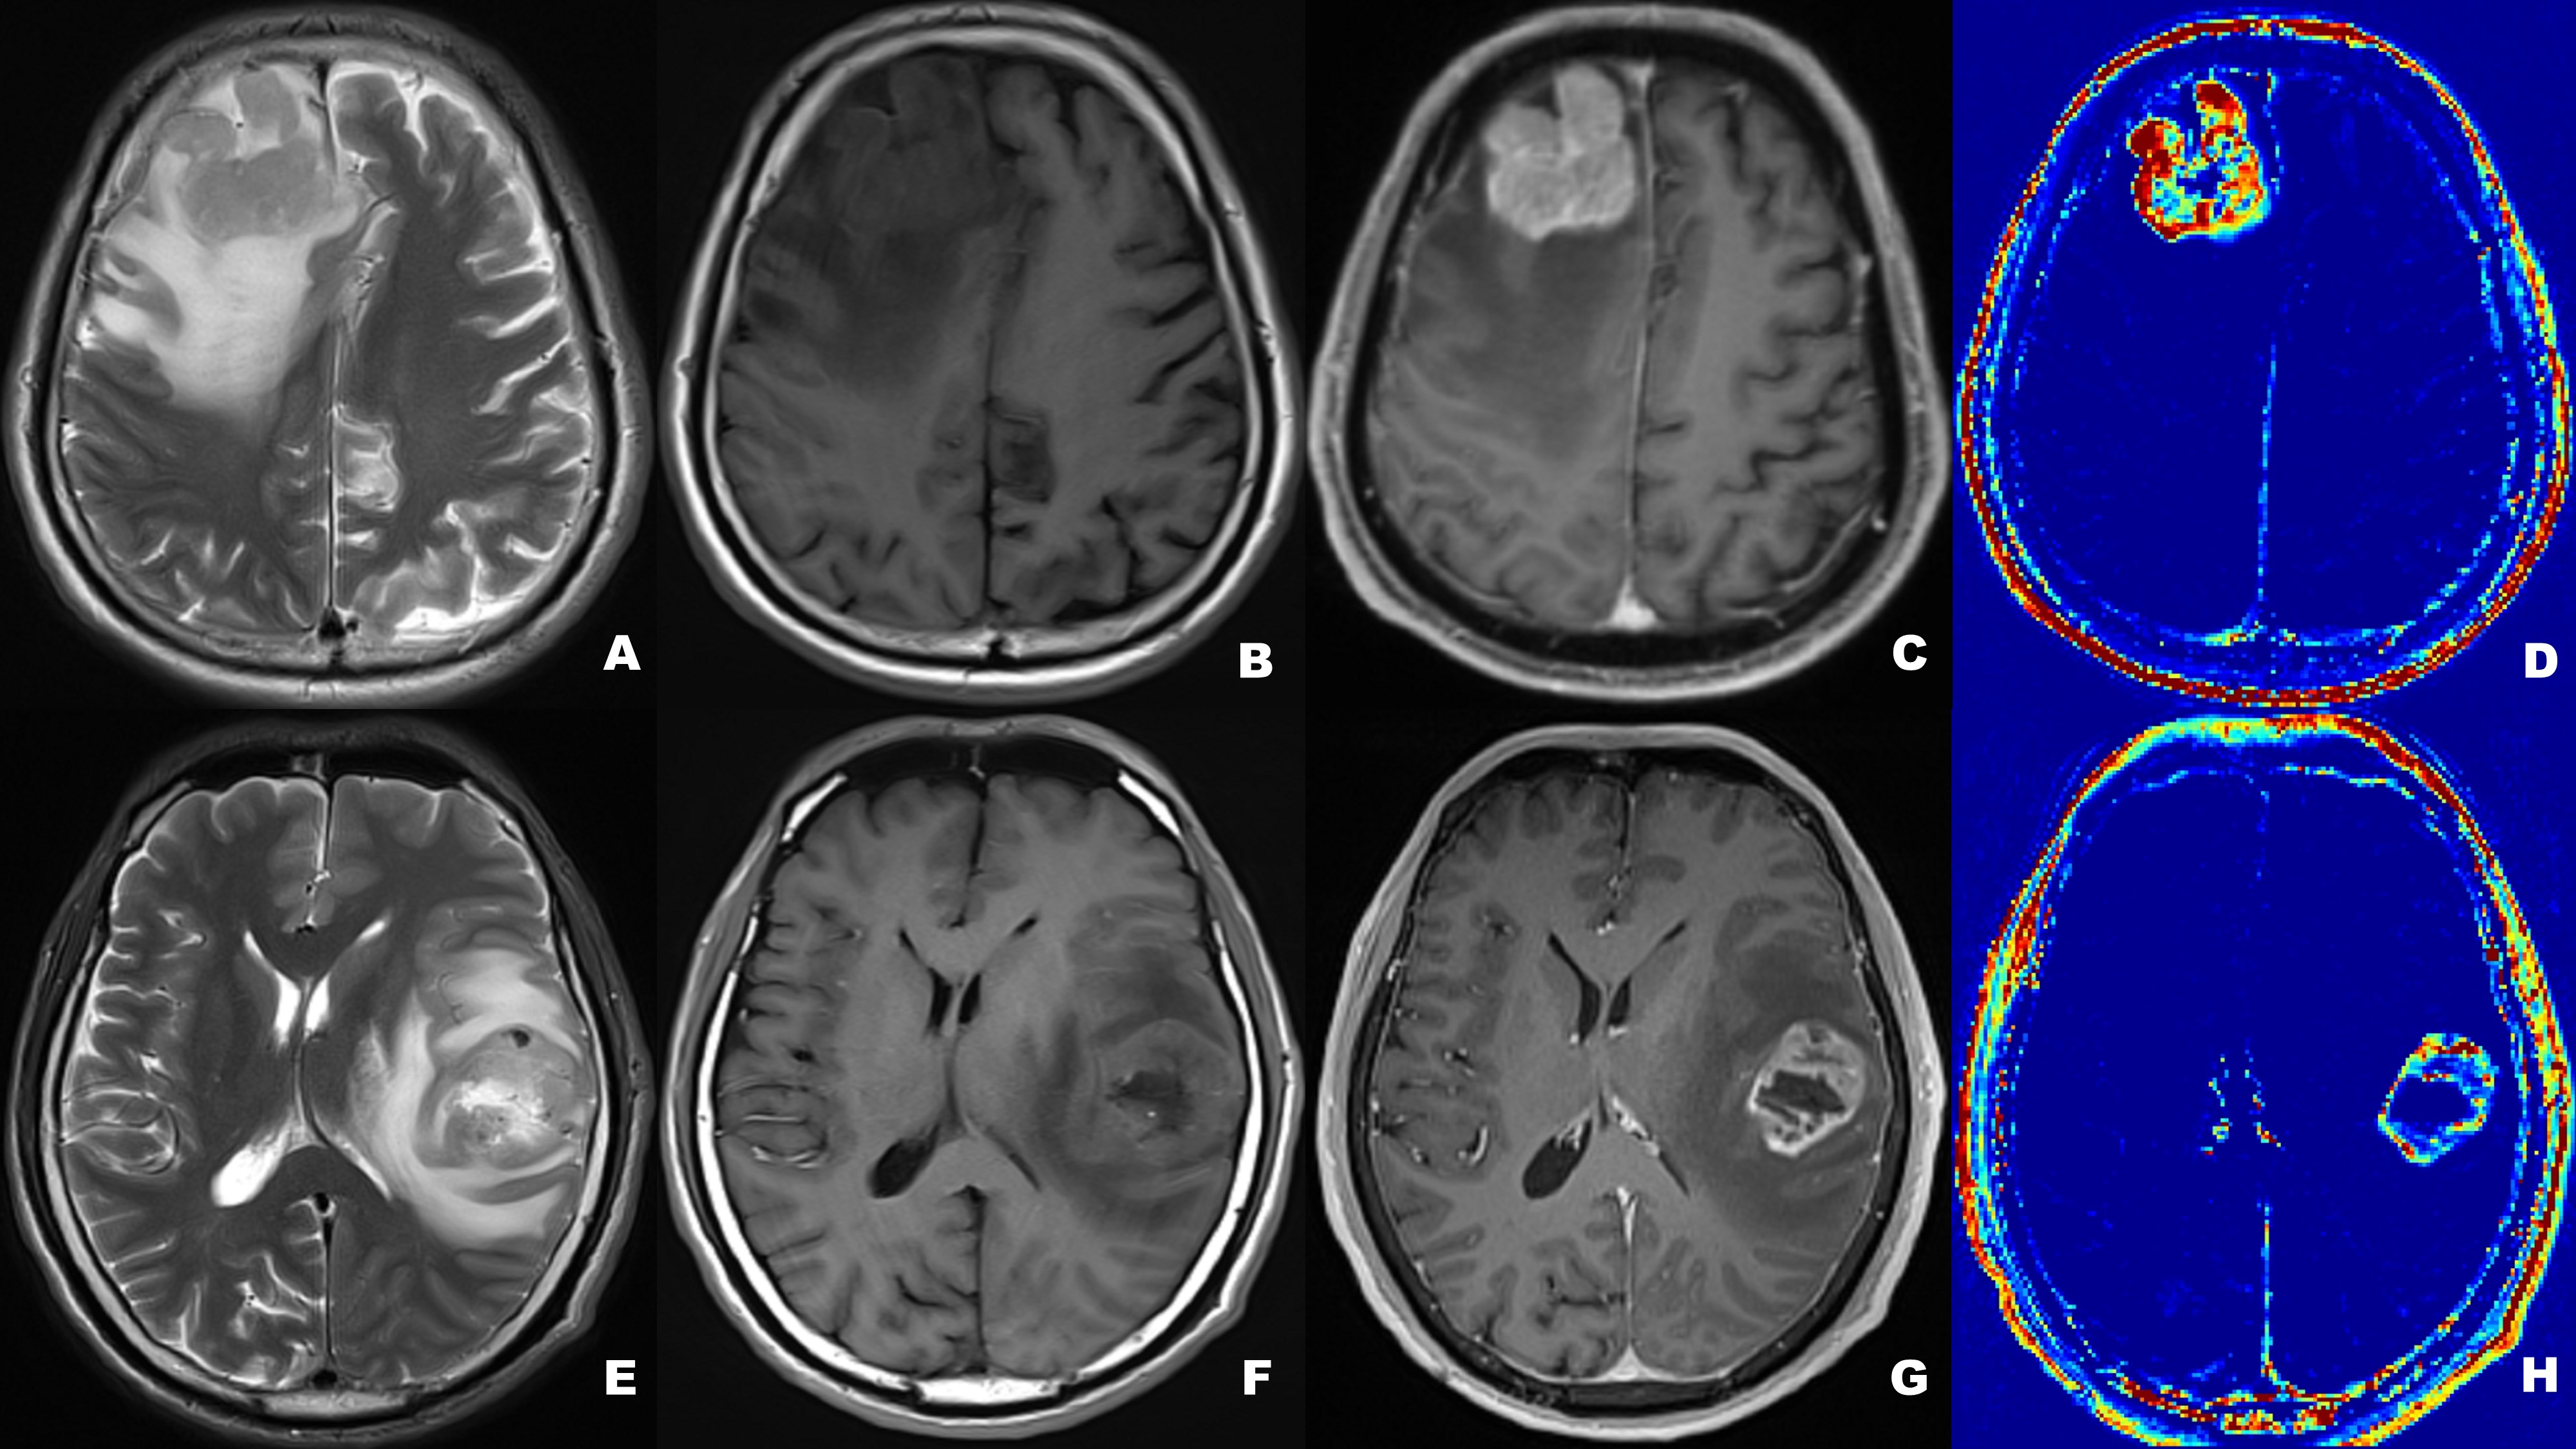
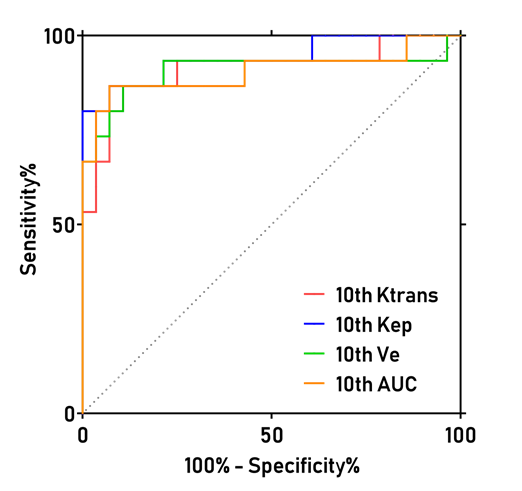
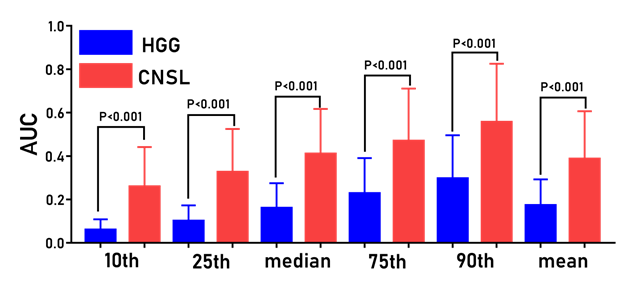
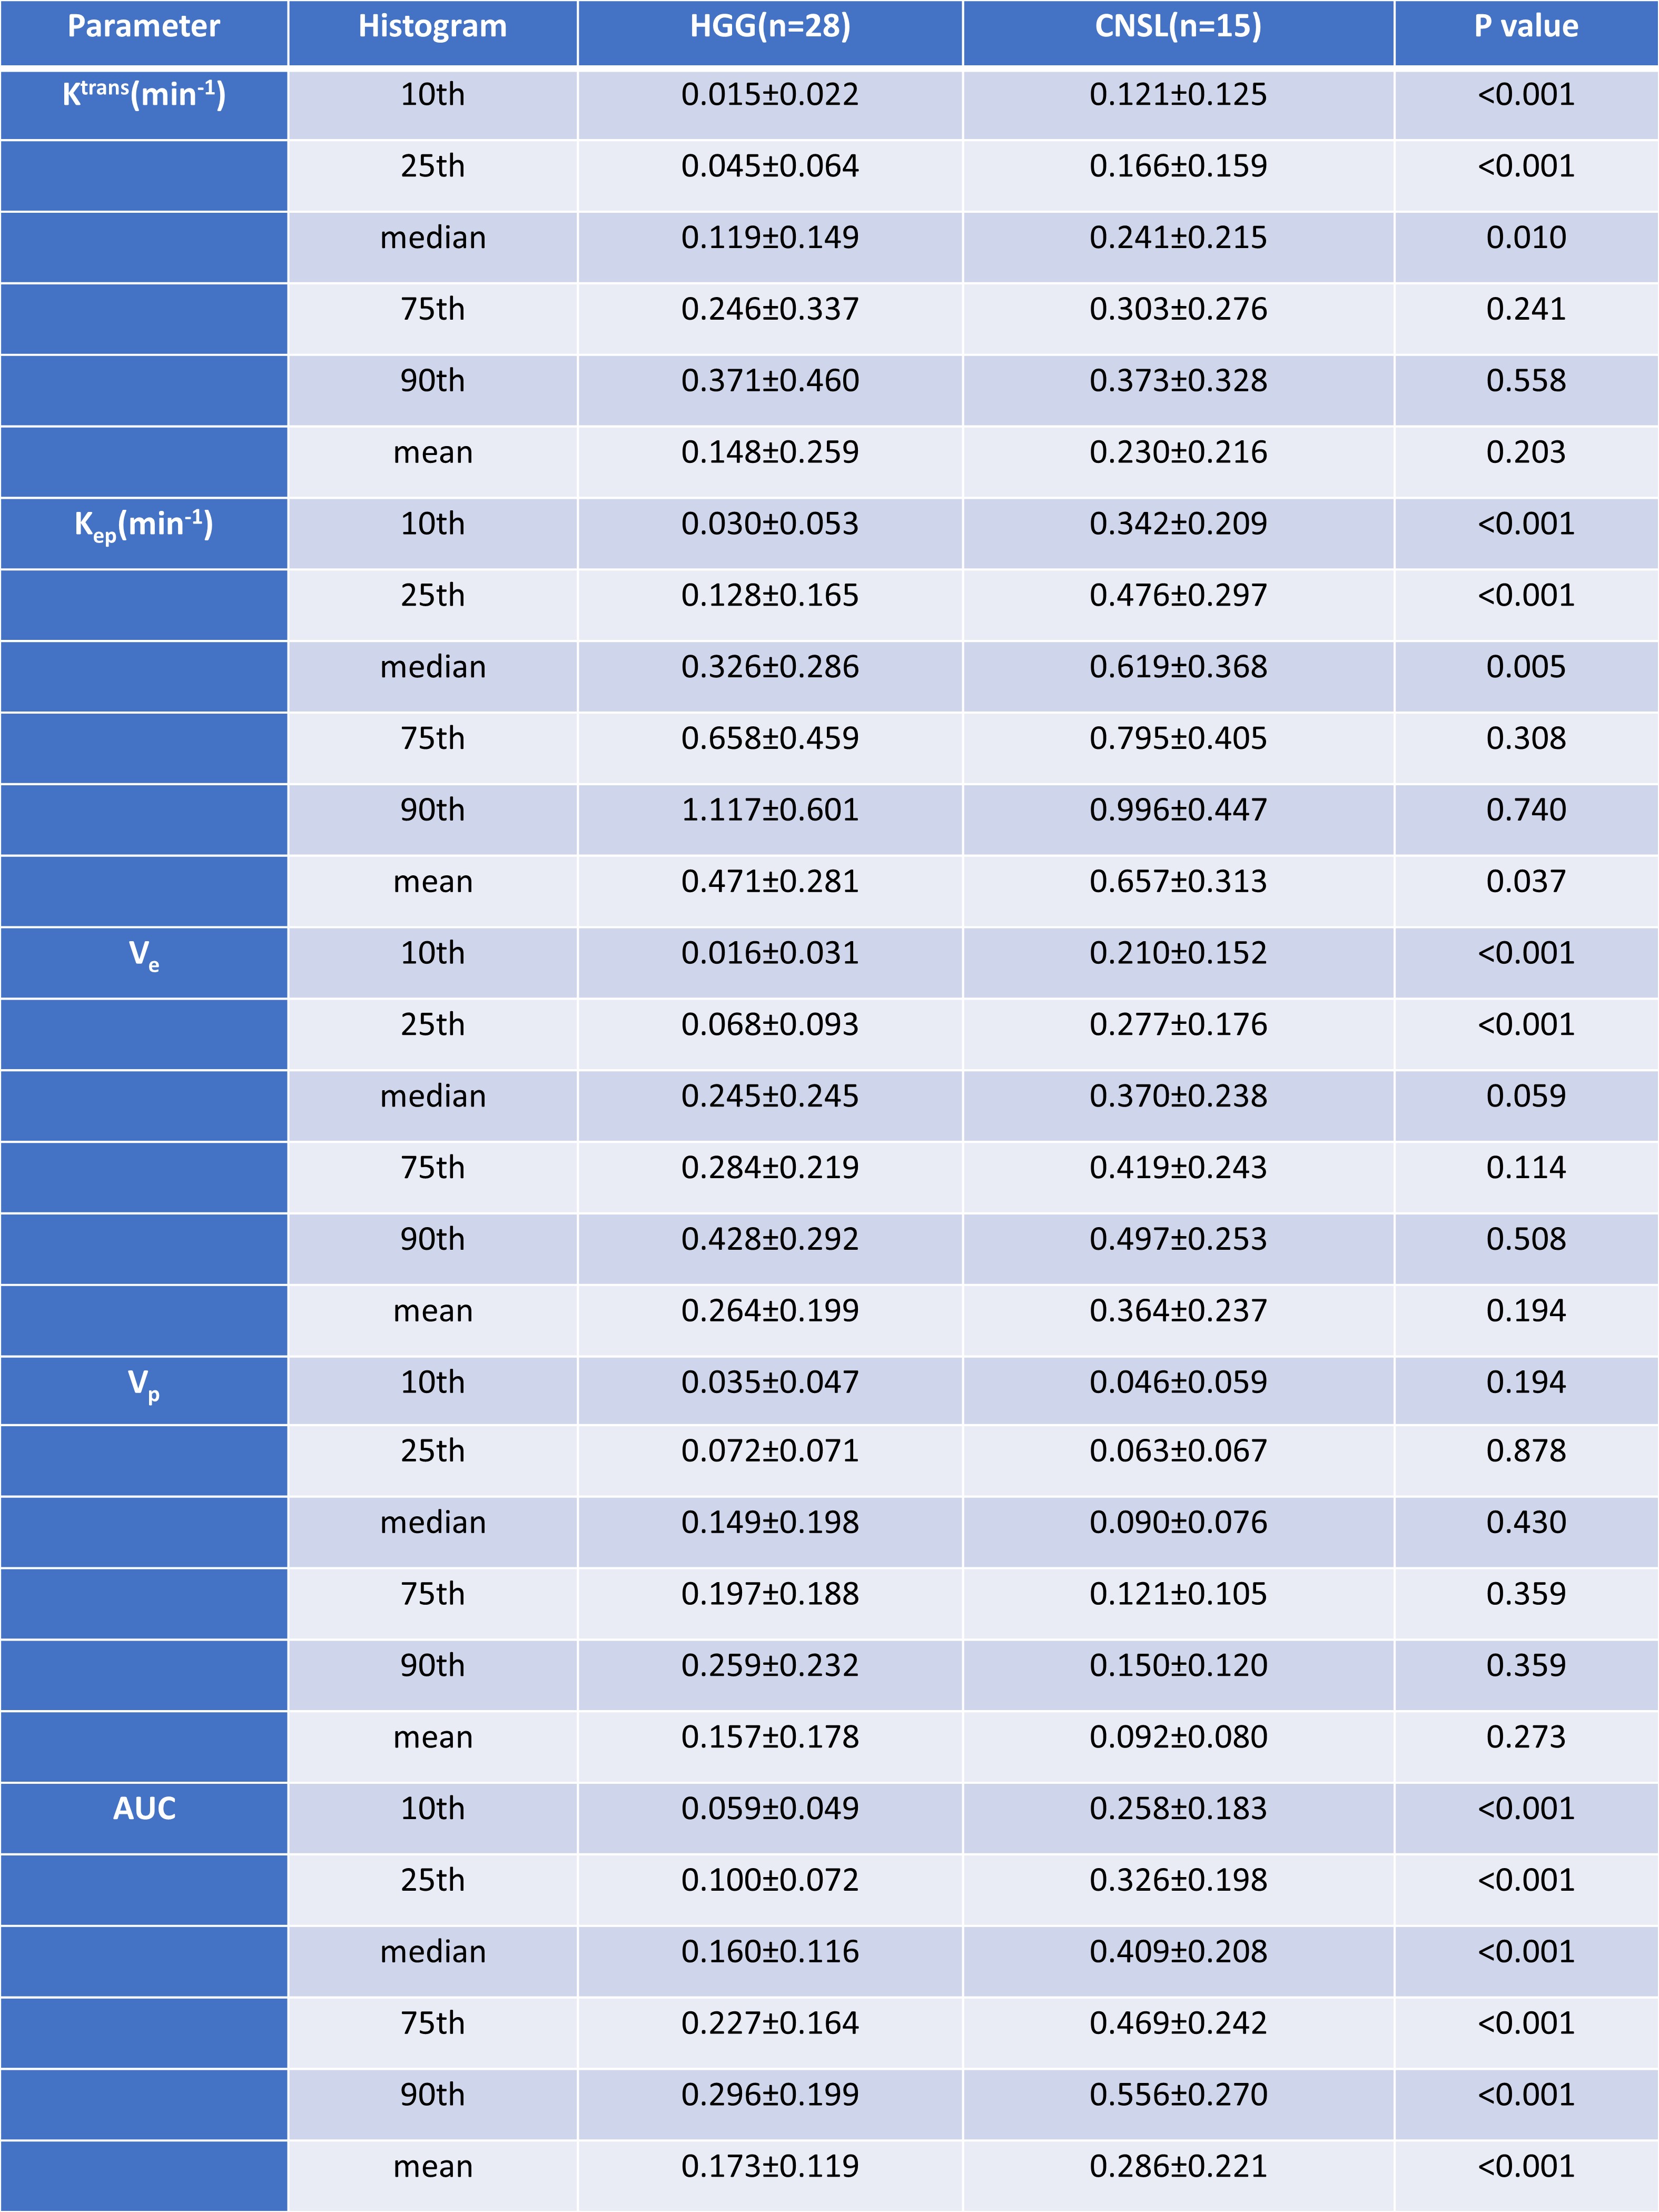
A total of 43 patients diagnosed as HGG (n=28) and CNSL (n=15), respectively, underwent DCE-MRI scanning by a 3T MR scanner (MAGNETOM Prisma; Siemens Healthcare, Erlangen, Germany) with a 20-channel head coil. Conventional MRI examinations including T1-, T2-weighted imaging and diffusion weighted imaging (DWI) were acquired. Axial DCE-MRI was performed with volume interpolated gradient echo (VIBE) sequence. Pre-contrast T1-weighted VIBE sequences (TR/TE=4.09/1.47ms, slice thickness=3.5mm, FOV= 200×200 mm, matrix=192×192) with flip angles of 3, 6, 9, 12 and15were acquired, respectively. The enhanced VIBE sequences were performed when an intravenous injection of gadodiamide (Omniscan, GE Healthcare, Dublin, Ireland) was carried out at an injection rate of 3.5 mL/s via a power injector (0.1 mmol/kg), followed by a flush of 10 mL normal saline. The parameters were as follows: TR/TE =5.06/ 1.98ms; slice thickness =3.5 mm; FOV =200×200 mm2; matrix = 192×192; flip angle =12°. All DCE-MRI data were analyzed by using image post-processing software (OmniKinetics; GE Healthcare). The histogram features including the mean, median, 10th percentile, 25th percentile, 75th percentile, 90th percentile, skewness and kurtosis based on Ktrans, Ve, Vp, Kep and AUC maps derived from DCE-MRI were calculated, respectively. The Mann-Whitney U test is used for evaluating the difference of DCE related histogram features based on Ktrans, Ve, Vp, Kep and AUC maps) between CNSL and HGG. The AUC and cutoff values of the two tumors were calculated by ROC curve analysis and Youden Index. Results: The patient diagnosis information was shown in Figure 1. For ROC curve analysis, Figure. 2 demonstrated the 10th percentile of Ktrans (AUC=0.912, sensitivity=86.7%, specificity=92.9%), Kep (AUC=0.940, sensitivity=93.3%, specificity =79.6 %), Ve (AUC=0.907, sensitivity=86.7%, specificity=89.3%), and AUC (AUC=0.904, sensitivity=86.7%, specificity=92.9 %) were statistically significant between CNSL and HGG group (p <0.001), which achieved high diagnostic efficiency. Figure. 3 showed the histogram features based on AUC maps (10th, 25th, median, 75th, 90th, and mean) were always statistically significant, and increased significantly in CNSL compared with HGG (P < 0.001). There was no significant difference in Vp and 75th, 90th and mean of Ktrans, Kep and Ve between CNSL and HGG (P>0.05) (Table 1).Discussion:
In our study, HGG and CNSL can be identified by histogram analysis of DCE-MRI. We found that there was no significant difference in the Vp and histogram features based on Ktrans, Kep and Ve greater than the median between CNSL and HGG. However, the histogram features derived from AUC maps (10th, 25th, median, 75th, 90th, and mean) were always statistically significant, and achieved higher diagnostic efficiency.Conclusion:
The histogram analysis of DCE-MRI have great significance for identifying HGG and CNSL, which will help clinical differential diagnosis of HGG and CNSL.Acknowledgements
NoReferences
1.Stupp R, Tonn JC, Brada M, et al. High-grade malignant glioma: ESMO Clinical Practice Guidelines for diagnosis, treatment and follow-up. Ann Oncol 2010;21 Suppl 5:v190-193.
2.Blumenthal DT, Dvir A, Lossos A, et al. Clinical utility and treatment outcome of comprehensive genomic profiling in high grade glioma patients. J Neurooncol 2016;130:211-219.
3.Murayama K, Nishiyama Y, Hirose Y, et al. Differentiating between Central Nervous System Lymphoma and High-grade Glioma Using Dynamic Susceptibility Contrast and Dynamic Contrast-enhanced MR Imaging with Histogram Analysis. Magn Reson Med Sci 2018;17:42-49.
Figures