4784
Diffusion-weighted imaging of thyroid nodules for the differentiation of benign from malignant lesions1Department of Radiology, Union Hospital, Tongji Medical College, Huazhong University of Science and Technology, Wuhan, China
Synopsis
To investigate the feasibility and effectiveness of diffusion-weighted imaging (DWI) in thyroid for differentiating benign and malignant thyroid nodules, determining the best b-value of DWI sequence for the diagnosis thyroid nodules.This study revealed that the ADC measurements in DWI is useful for quantitatively differentiating benign and malignant thyroid nodules, and should be potential for the assessment of thyroid nodules in addition to conventional MRI protocol.
At present, most of the studies on DWI focus on abdominal organs such as liver, kidney, uterus and glands like salivary glands, breast, prostate[1], and there are few reports about the application in the thyroid and have been not reached consistent conclusions [2-3].The selection of b value in DWI examination has not yet formed a unified standard. To investigate the feasibility and effectiveness of diffusion-weighted imaging (DWI) in thyroid for differentiating benign and malignant thyroid nodules, determining the best b-value of DWI sequence for the diagnosis thyroid nodules.
Methods
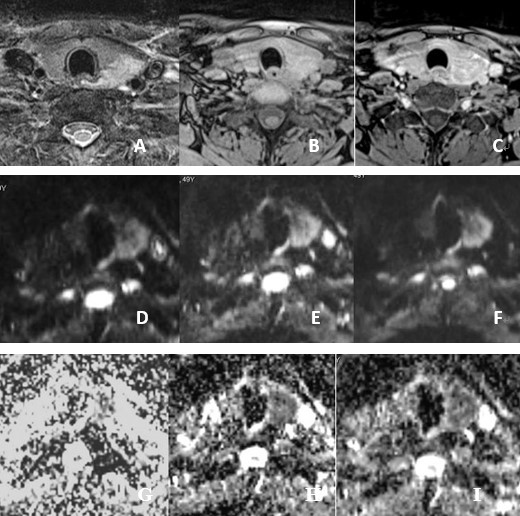
This IRB approved study was performed on a 3T scanner with a commercially available 20-channel head-neck coil (MAGNETOM Trio, Siemens Healthcare, Erlangen, Germany). Forty-six patients (average range of 14-78 years ) with thyroid nodules(21 benign and 25 malignant) were enrolled in the study. Patients underwent thyroid nodules MRI using an echo planar imaging based DWI (with b-value of 100 s/mm2, 300 s/mm2, and 500 s/mm2 ) in addition to the standard MRI protocolThe details of imaging parameters of DWI sequence was listed below: FOV=250mm2, TR/TE =5700/85 ms, slice thickness = 4 mm, flip angle = 90°, imaging matrix = 128×128, and acquisition time (TA) =155s .All mean ADC values of benign nodules and malignant nodules were quantitatively calculated for comparison. The receiver operating curve (ROC) method selected the best b-value for the differentiation of benign and malignant nodules, and the diagnostic tests were then evaluated on the assessment of sensitivity and specificity. All patients had detailed surgical and postoperative biopsy results used as references. The mean ADC values between be b-values were compared using the paired samples T test. P value less than 0.05 was considered significant.
Results
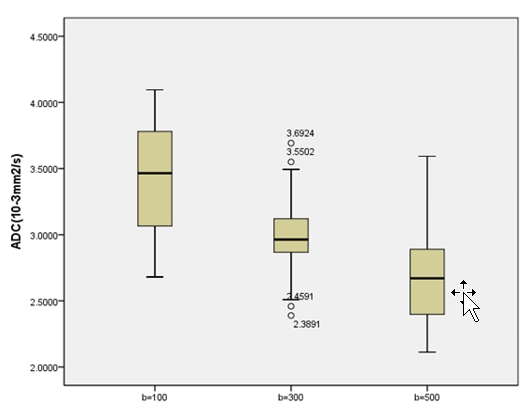
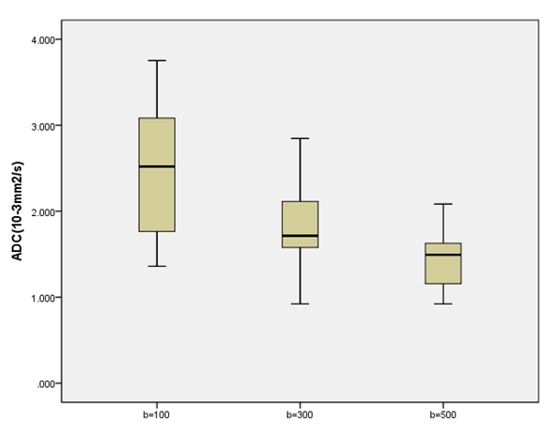
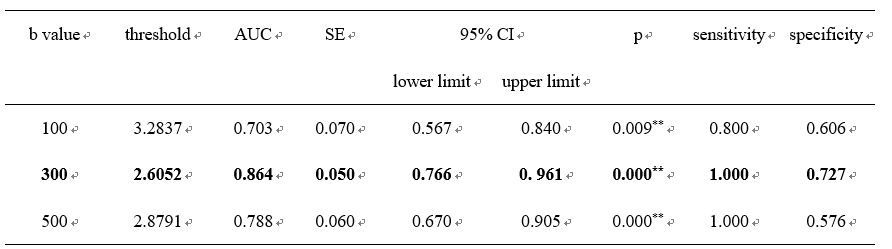
The mean ADC values for benign and malignant nodules were (3.43±0.42) x10-3mm2/s vs. (2.47±0.72) x10-3mm2/s for b value of 100 s/mm2, (2.99±0.31) x10-3mm2/s vs (1.79±0.47) x10-3mm2/s for b value of 300 s/mm2, (2.73±0.37) x10-3mm2/s vs. (1.44±0.32) x10-3mm2/s for b value of 500 s/mm2, respectively. The mean ADC values of malignant nodules were lower than those of benign nodules. There were significant differences in the ADC values between benign and malignant nodules at all the 3 b values. (t=5.960, 11.074, and 13.959, respectively. p <0.01).In addition, the mean ADC values of benign nodules at b-factor 100 s/mm2, 300 s/mm2, and 500 s/mm2 was significantly different (F=62.993, p<0.01; t = 7.107, 8.999, 5.710, p<0.01). The ADC values decreased as the b-value increased. The mean ADC values of benign nodules at b-factor 100 s/mm2, 300 s/mm2, and 500 s/mm2 was significantly difficult (F = 49.956, p<0.01; t = 6.208, 9.170, 3.808, p<0.01). The mean ADC value decreased along with the b value increasing. Furthermore, a cut off value for malignant nodules of 2.60 x10⁻³mm2/s at b value of 300 yielded the values of sensitivity and specificity of 100% and 72.7%, respectively.
Discussion
The apparent diffusion coefficient (ADC) calculated from DWI images is a quantitative parameter, which can objectively evaluate the diffusion function of water molecules in tissues.Using DWI with multiple b values, the image can be processed to obtain ADC value images that are infinitely close to the real ADC value of the organization.In the preliminary experiment, the DWI image obtained by this method had relatively serious signal loss, which affected the lesion display. Therefore, the DWI image under two b values of multiple scans was selected to select the b value with better signal-to-noise ratio and better performance in differentiating benign from malignant. In this study, the three b values all obtained satisfying DWI image and were sensitive to the detection of thyroid nodules. The difference of average ADC values between the benign and malignant nodules groups under different b values was statistically significant, indicating that the three b values obtained in this study were differentiated. The difference between the ADC values of benign nodules and malignant nodules at the three b values was statistically significant, indicating that DWI examination at the three b values of 100 s/mm2, 300 s/mm2, and 500 s/mm2 was significant for the differentiation of benign and malignant thyroid nodules.Among them, the area under the ROC curve measured by dividing the 95%CI lower limit of the average ADC value of the benign nodules group with b value of 300 s/mm2 is the largest, 0.864. Therefore, it can be considered that when b value is 300 s/mm2, the ADC threshold of 2.6052 x10⁻³mm2/s is the ADC value with the highest differential diagnosis of benign and malignant thyroid nodules, diagnostic sensitivity of 100% and specificity of 72.7%.
Conclusion
The analysis of the DWI image features and the ADC value could make up for the deficiencies of conventional MRI protocol, especially when there were overlapping signs which were difficult to be defined by the conventional MRI protocol. This study revealed that the ADC measurements in DWI is useful for quantitatively differentiating benign and malignant thyroid nodules, and should be potential for the assessment of thyroid nodules in addition to conventional MRI protocol.
Acknowledgements
No acknowledgement found.References
[1] Bozgeyik Z, Kocakoc E, Sonmezgoz F ,et al. Diffusion-weighted MR imaging findings of kidneys in patients with early phase of obstruction. Eur J Radiol, 2009,70(1):138-141.
[2] Dilli A, Ayaz UY, Cakir E, et al.The efficacy of apparent diffusion coefficient value calculation in differentiation between malignant and benign thyroid nodules. Clin Imaging, 2012,36(4):316-322.
[3] Mutlu H, Sivrioglu AK, Sonmez G, et al. Role of apparent diffusion coefficient values and diffusion-weighted magnetic resonance imaging in differentiation between benign and malignant thyroid nodules. Clin Imaging. 2012, 36(1):1-7.
Figures