4783
Evaluation of diffusion-weighted MR imaging for the characterization of myeloma-specific renal changes: initial results.1Department of Diagnostic and Interventional Radiology, University Duesseldorf, Duesseldorf, Germany, 2Department of Haematology, Oncology and Clinical Immunology, University Duesseldorf, Duesseldorf, Germany
Synopsis
Myeloma-specific renal changes are of particular interest for the prognosis and therapy monitoring of patients suffering from multiple myeloma. Here we present initial results for the evaluation of myeloma-specific renal changes by diffusion-weighted MR-imaging. Renal cortical and medullar ADC and FA values of myeloma kidney exhibit a good correlation with renal function. Cortical ADC and cortical and medullar FA values show trends to reflect myeloma-specific renal changes measured by proteinuria, serum kappa/lambda-ratio and ß2-microglobulin concentration. Diffusion-weighted MR-imaging could therefore be an important tool for monitoring myeloma-specific renal changes.
SYNOPSIS
Myeloma-specific renal changes are of particular interest for the prognosis and therapy monitoring of patients suffering from multiple myeloma. Here we present initial results for the evaluation of myeloma-specific renal changes by diffusion-weighted MR-imaging. Renal cortical and medullar ADC and FA values of myeloma kidney exhibit a good correlation with renal function. Cortical ADC and cortical and medullar FA values show trends to reflect myeloma-specific renal changes measured by proteinuria, serum kappa/lambda-ratio and ß2-microglobulin concentration. Diffusion-weighted MR-imaging could therefore be an important tool for monitoring myeloma-specific renal changes in patients suffering from multiple myeloma.SUMMARY OF MAIN FINDINGS
Renal ADC and FA show trends to reflect myeloma-specific renal changes measured by proteinuria, serum kappa/lambda-ratio and ß2-microglobulin concentration.INTRODUCTION
The myeloma kidney is a well-defined term and firmly linked to the clinical diagnosis of multiple myeloma. Therefore, renal function is of particular interest for the prognosis and therapy monitoring of patients suffering from multiple myeloma. The aim of this work is to evaluate diffusion-weighted MR-imaging (DWI) for the characterization of myeloma-specific renal changes.METHODS
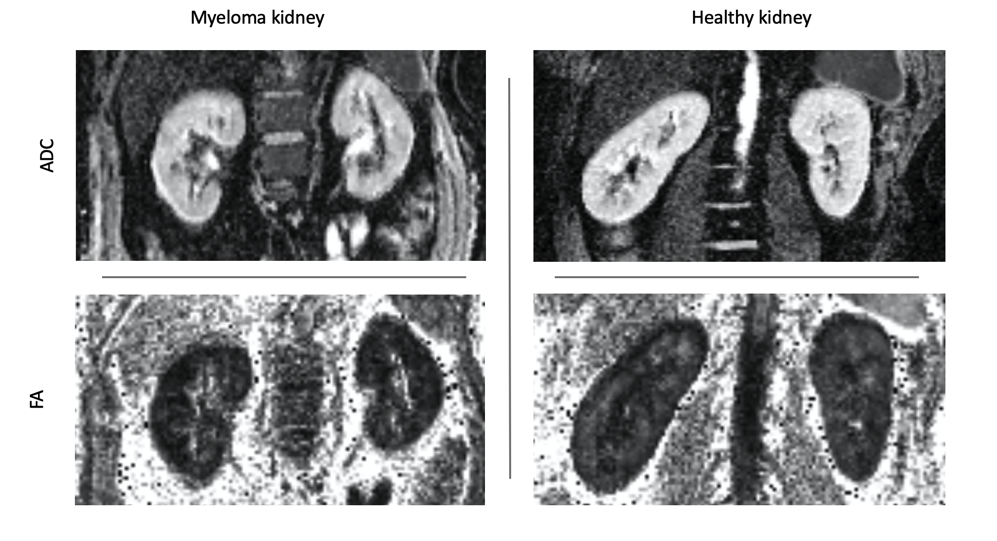
The study protocol was approved by the local ethics committee, and written consent was obtained from all participants. Fifteen myeloma patients (6 females and 9 males, mean age 56.8±7.6 years) were scanned on a 3T MR scanner (MAGNETOM Prisma, Siemens Healthcare, Erlangen, Germany). For renal DWI, a free breathing oblique coronal EPI sequence was acquired with acquisition parameters adapted to recently published technical recommendations [1]: FOV, 399×399 mm; matrix, 176×176; slice thickness, 5 mm, full kidney covering; averages, 1; SPAIR fat-suppression; GRAPPA 2; TR/TE 3000/78 ms; 4 b-values (0, 50, 400, 800 s/mm2) and 6 diffusion directions. Parameter maps for fractional anisotropy (FA) and apparent diffusion coefficient (ADC) were calculated using the vendor software. Mean cortical and medullar FA and ADC values and standard deviations (SD) were calculated after manual ROI placement into the b = 0 s/mm2 images (one continuous cortical ROI and three medullar ROIs). The right kidney was selected for further analysis because of lower potential cardiac artefacts [2]. Relationships between FA, ADC, kidney function and myeloma activity determined by the estimated glomerular filtration rate (eGFR, ml/min/1.73m2), serum kappa/lambda ratio (sLKC), serum beta-2-microglobulin concentration (sß2C) and urinary protein concentration (uPrC) were assessed by using Pearson correlation coefficient. ADC and FA were compared between patients with high myeloma activity (uPrC >1000mg/l; sKLC >100; sß2C >10mg/dl) and patients with low myeloma-specific renal changes by using a student t-test. P<0.05 indicated a statistically significant difference.RESULTS
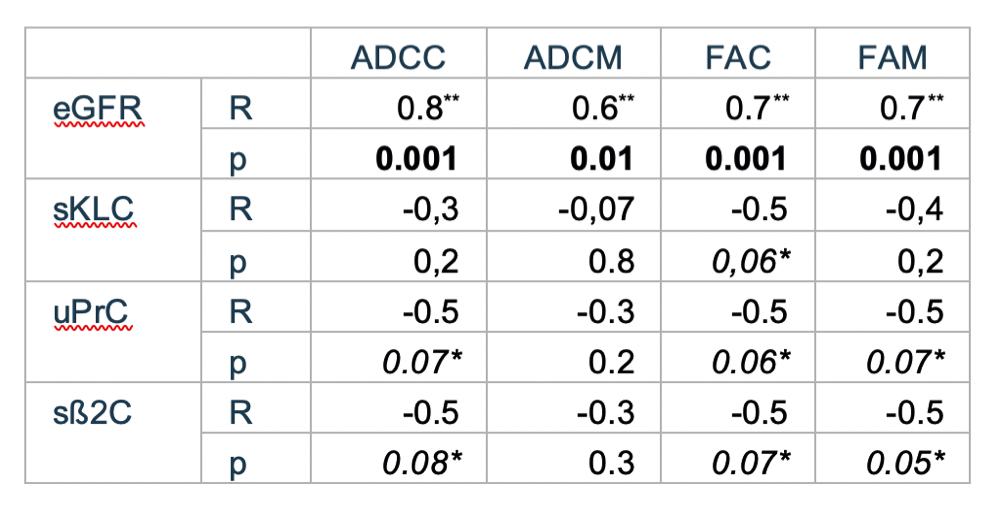
Patients were divided into 3 groups based on their renal function: group 1 (eGFR>60 ml/min/1.73m2) with 9 patients, group 2 (eGFR 60-30 ml/min/1.73m2) with 3 patients, group 3 (eGFR <30 ml/min/1.73m2) with 3 patients. Only 2 patients showed a high proteinuria (uPrC >1000mg/l). 3 patients showed elevated sKLC (>100) and sß2C (>10mg/dl), respectively. Mean cortical and medullar ADC and FA parameters correlated significantly with eGFR values of the patients (p<0.05) (Fig. 1). Besides, cortical and medullar ADC values showed significant difference between patients with high and low myeloma activity (p<0.05). No significant correlation could be identified between ADC and FA values and myeloma activity parameters (sKLC, sß2C and uPrC). However, cortical ADC as well as cortical and medullar FA showed a trend to correlate with myeloma activity parameters (Table 1).DISCUSSION
ADC and FA are known to reflect renal function measured by eGFR [3], which is also reflected in the findings of the current study. Regardless of the trend to assess myeloma activity in the kidney by ADC and FA, no significant correlation was found - probably due to the low number of patients having high myeloma activity in the present study (n=3). Further studies with higher number of patients suffering on myeloma-specific renal changes is therefore needed.CONCLUSION
ADC and FA values in the renal cortex and medulla of myeloma kidney exhibit a good correlation with renal function. Cortical ADC as well as cortical and medullar FA show trends to reflect myeloma activity in the kidney and could therefore be an important tool for monitoring myeloma-specific renal changes.Acknowledgements
No acknowledgement found.References
[1] Mendichovszky I, Pullens P, Dekkers I, Nery F, Bane O, Pohlmann A, et al. Technical recommendations for clinical translation of renal MRI: a consensus project of the Cooperation in Science and Technology Action PARENCHIMA. Magn Reson Mater Phys Biol Med 2019. https://doi.org/10.1007/s10334-019-00784-w.
[2] A. Kido, M. Kataoka, A. Yamamoto, Y. Nakamoto, S. Umeoka, T. Koyama, et al. Diffusion tensor MRI of the kidney at 3.0 and 1.5 Tesla. Acta Radiol 2010;51:1059–63. https://doi.org/10.3109/02841851.2010.504741.
[3] Caroli A, Schneider M, Friedli I, Ljimani A, De Seigneux S, Boor P, et al. Diffusion-weighted magnetic resonance imaging to assess diffuse renal pathology: a systematic review and statement paper. Nephrol Dial Transplant 2018;33:ii29–40. https://doi.org/10.1093/ndt/gfy163.
Figures