4782
Combined DWI and T2 mapping for the Differential Diagnosis of Malignant Liver Tumors1Radiology, the Affiliated Cancer Hospital of Zhengzhou University & Henan Cancer Hospital, Zhengzhou, China, 2Radiology, the Affiliated Cancer Hospital of Zhengzhou University, Zhengzhou, China, 3MR Scientific Marketing, Siemens Healthcare, Shanghai, China, 4MR Scientific Marketing, Siemens Healthcare, Xi'an, China, 5MR R&D Collaboration, Siemens Medical Solutions, Los Angeles, CA, United States
Synopsis
To improve the ability to differentially diagnose malignant liver tumors, quantitative apparent diffusion coefficients (ADCs) and T2 values were evaluated in 117 patients. We also included 59 patients with liver metastases (LMs) from different primary cancers. The results showed combining quantitative ADC and T2 values could make the differential diagnosis of various malignant liver tumors easier. However, this quantitative combination was not effective at improving the ability to diagnose patients with LMs.
Introduction
Although conventional CT and MRI provide a decent amount of information to differentially diagnose malignant liver tumors compared with other imaging techniques, in some special cases, diagnoses remain difficult. Newer techniques provide quantitative information that could enhance our ability to make a diagnosis. The ADC has been assessed in the differential diagnosis of malignant liver tumors1,2; however, to our knowledge, quantitative T2 mapping, in addition to ADC, has have not yet been analyzed. Therefore, we aimed to evaluate ADC and T2 mapping for the differentiation of malignant liver tumors and liver metastases (LMs) from different primary cancers.Materials and Methods
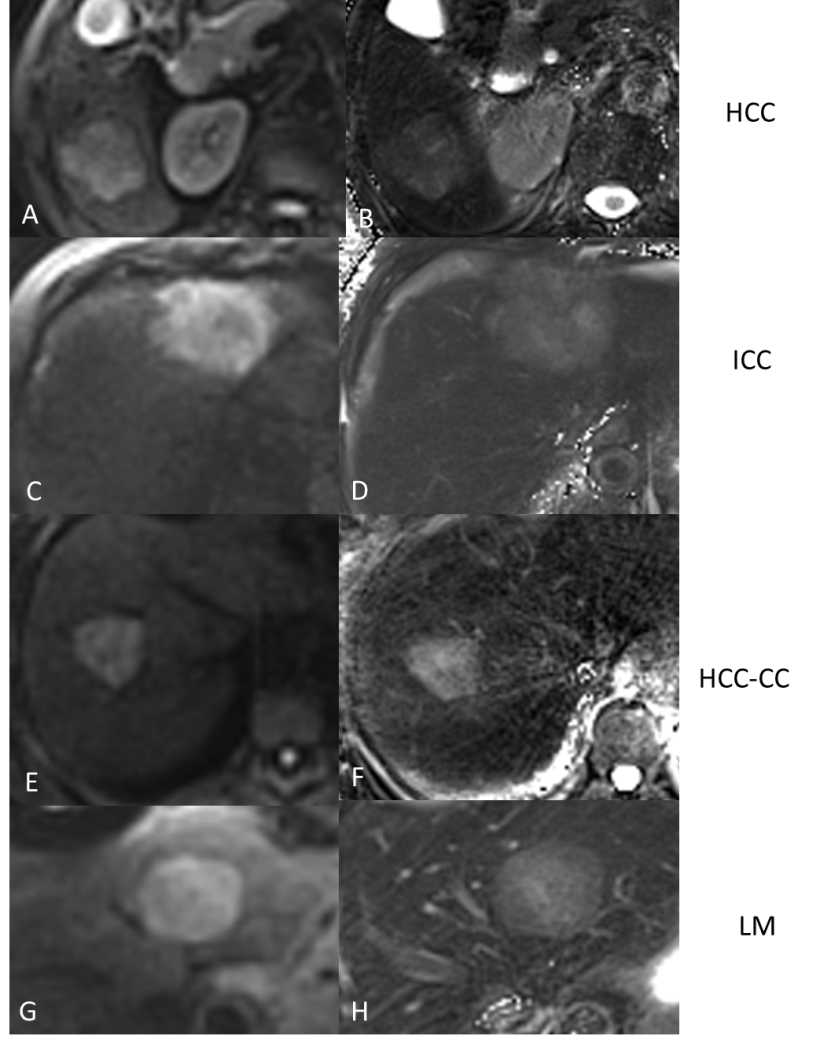
One hundred and thirty-three patients were enrolled in this retrospective study, and 117 patients were proven to have malignant liver tumors on histopathology, including 51 hepatocellular carcinomas (HCCs), 17 intrahepatic cholangiocarcinomas (ICCs), 6 combined HCC-CCs, and 59 LMs. The LM cases were stratified according to the primary tumor types, including 16 breast cancers, 13 colorectal cancers, 13 gastric cancers, 6 esophageal cancers, and 11 lung cancers. DWI and prototypic radial T2 mapping sequences were performed on a 3T MR scanner.The DWI and T2-mapping parameters were for DWI: slice thickness=7 mm, TR/TE=2600 ms/50 ms, matrix=84 ×128, FOV=300 mm, scanning time=47 s, b=0, 700 s/mm2; and for T2 mapping: thickness=7 mm, TR/TE=1400 ms/8.6 ms, matrix=256 ×256, FOV=300 mm, scanning time=38s. Intra-class correlation coefficients (InCC) were used to assess inter-observer agreement. The Kruskal-Wallis test was used to compare intergroup differences between the ADC and T2 values. The ROC curves were used to analyze the diagnostic value of the values.Results
The inter-observer agreements were excellent (InCC >0.75). The ADC and T2 values were statistically different among the four malignant liver tumor groups (P =0.000, P <0.001) (Figure 1). The ADC and T2 values showed significant differences between the HCC and ICC groups (AUC = 0.809 and 0.911, respectively), the ICC and HCC-CC groups (AUC = 0.824 and 0.912, respectively), the HCC and LM groups (AUC = 0.694 and 0.833, respectively). The combined ADC and T2 values showed significant differences between the HCC and ICC groups (AUC =0.934), the ICC and HCC-CC groups (AUC =0.931), the HCC and LM groups (AUC =0.836). However, no significant differences were found between the HCC and HCC-CC groups (P> 0.05). However, the ADC values were significantly different between the HCC-CC and LM groups (AUC =0.802) but were not found to be significantly different using the T2 values (P>0.05). For the LM groupings, a significant difference in ADC values between the breast cancer LM group and colorectal cancer LM group (P =0.032) was found. The T2 values between the colorectal cancer LM group and the gastric cancer LM group were also statistically different (P =0.047).Discussion
Quantitative T2 and ADC values combined with good image quality were effective in differential diagnosing many different malignant liver tumors. Combining these values could offer better performance in differentiating the malignant liver tumor types, but does not appear to be useful for distinguishing metastatic liver disease of multiple primary tumors.Acknowledgements
References
1. Li R, Wu G, Wang R. Application values of 3.0T magnetic resonance diffusion weighted imaging for distinguishing liver malignant tumors and benign lesions. Oncology letters 2018;15(2):2091-96. doi: 10.3892/ol.2017.7565 [published Online First: 2018/02/13]
2. Hennedige TP, Hallinan JT, Leung FP, et al. Comparison of magnetic resonance elastography and diffusion-weighted imaging for differentiating benign and malignant liver lesions. European radiology 2016;26(2):398-406. doi: 10.1007/s00330-015-3835-8 [published Online First: 2015/06/03]
Figures