4780
Automated RECIST Measurement and Therapeutic Response Evaluation in Osteosarcoma using Diffusion Weighted MRI1Centre for Biomedical Engineering, Indian Institute of Technology Delhi, New Delhi, India, 2Department of RadioDiagnosis, All India Institute of Medical Sciences, New Delhi, India, 3Dr. BRA Institute-Rotary Cancer Hospital, All India Institute of Medical Sciences, New Delhi, India
Synopsis
Accuracy and consistency in RECIST(Response evaluation criteria in solid tumors) measurements are crucial as it directly impacts patient treatment options. Manual RECIST measurement, requiring high expertise & attention, is time-expensive, prone-to-error, operator-subjective. we propose an automated tumor segmentation and RECIST score estimation method that uses MRI image slices as input, delineates the tumor in 3D, identifies the MRI slice with maximum-tumor-burden and then measures the tumor-diameter and RECIST1.1 score for treatment response assessment. Proposed method produced reliable and reproducible automated RECIST score measurements in current bone tumor dataset and might be useful as decision support tool saving manual-effort and reading-time.
Purpose
Response evaluation criteria in solid tumors (RECIST) is the standard method to measure and score the tumor growth rates across different time points to evaluate treatment responses in cancer patients (1). Accuracy and consistency in RECIST measurements are crucial as it directly impacts patient treatment options. Manual RECIST measurement, requiring high expertise & attention, is time-expensive, prone-to-error and operator-subjective. The purpose of this study was to develop a computer aided diagnostic (CAD) tool for automated tumor segmentation and RECIST score estimation with reasonable accuracy, consistency and speed.Methods
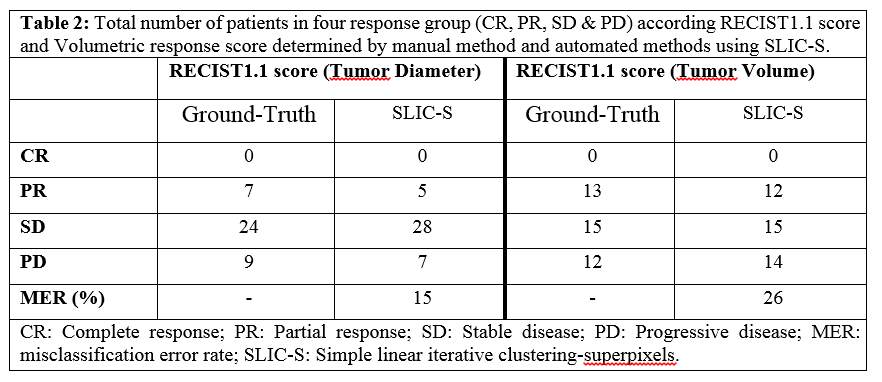
Dataset: To implement and test the performance of proposed CAD tool, bone tumor data of forty patients (N=40;Male:Female=30:10;Age=17.7±5.9years) with biopsy proven Osteosarcoma were used. For each patient diffusion weighted MRI (DWI) was acquired using 1.5T Phillips Achieva MRI scanner before treatment (baseline) and after completion of neoadjuvant chemotherapy (NACT) (follow-up, after 10-12 weeks). DWI was acquired using free breathing Spin-Echo-Echo-Planar Imaging (SP-EPI) with TR/TE=7541/67msec, matrix-size=192×192, field-of-view=250´250mm2, slice-thickness/Gap=5.0mm/0.5mm, voxel-size=1.3/1.3/5.0mm, b-value=0-800s/mm2 with 64 axial-slices.RECIST1.1 score: To assess RECIST1.1 score, tumor-diameter is manually measured in the maximum cross-sectional area of the tumor at different time-points in the course of treatment and the changes in tumor burden is evaluated and scored according to RECIST1.1 criteria. RECIST1.1 scores are defined as, Complete-response (CR): total disappearance of tumor; Partial-response (PR): Minimum 30% decrease in tumor-diameter; Progressive-disease (PD): minimum 20% or 5 mm absolute increase in tumor-diameter; Stable-disease (SD): neither PR nor PD.
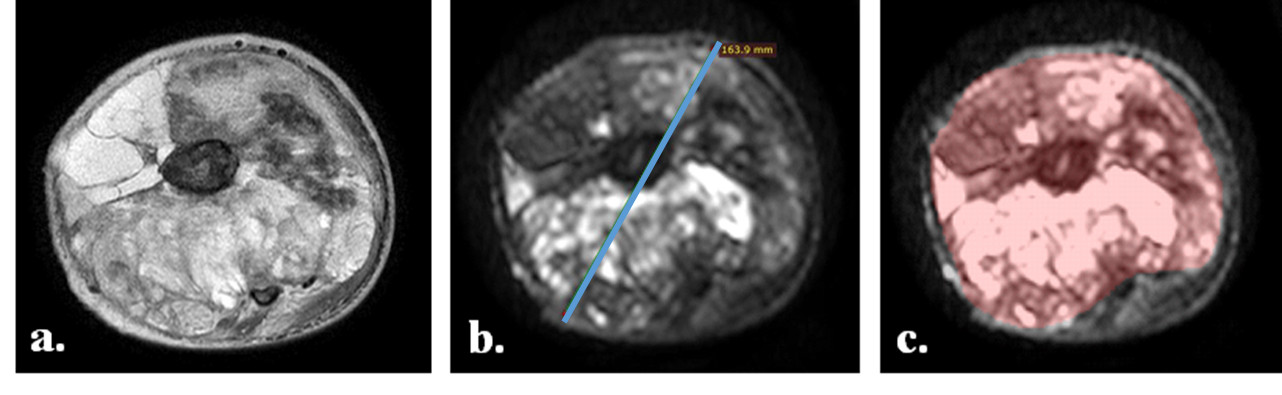
Ground-Truth: Tumor-diameter (in cm) was measured manually on axial b=800s/mm2 DWI slice (DWI800) having the maximum cross-sectional area of tumor. Tumor-diameter was measured using RadiAnt DICOM Viewer 1.9.16version software (www.radiantviewer.com) and the slice-number with maximum tumor burden (max-burden-sliceno) was noted. Manual segmentation and demarcation of tumor Region-of-interest (ROI) was performed on each DWI800 image covering the whole tumor using MRIcron 8/2014 version software (www.nitrc.org). Tumor-volume (in cc) was calculated separately at baseline and follow-up for each patient by accumulating the tumor ROIs across all slices. Illustrative examples of original T2W fat-saturated image and DWI800 image from a representative patient with Osteosarcoma with delineated tumor-diameter and tumor ROI are depicted in Fig1.a, Fig1.b and Fig1.c respectively. Relative percentage changes in tumor-diameter and tumor-volume from baseline to follow-up were calculated and RECIST1.1 score was evaluated for each patient.
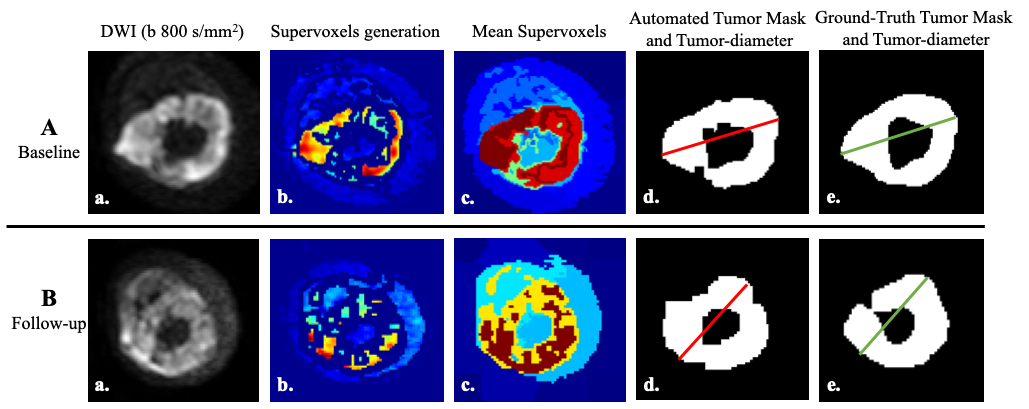
Proposed CAD Tool: 3D image stack of DWI800 were pre-processed by morphological operations to focus only on target anatomical part and were normalized to total 256 grey levels (0-255) to facilitate further operation. Automatic tumor segmentation in 3D was performed using unsupervised clustering based algorithm Simple-linear-iterative-clustering Superpixels (SLIC-S)(2) (Fig.2). Superpixels were generated by clustering voxels based on intensity similarity and proximity in plane. Experimentally the number-of-supervoxels was set to 20 with the compactness of 0.025 and 50 number-of-iterations. Mean intensity of supervoxels were calculated and Histogram analysis was performed in whole tumor volume and four Ostu-thresholds were estimated considering multi-Gaussian distribution. Supervoxels above threshold-3 were selected experimentally and merged followed by morphological operations which gave the best segmentation results. Using connected component analysis (3) length of the major-axis (longest cross-sectional axis) of all components of tumor in each slice were determined and added automatically to obtain the tumor-diameter for that slice. Maximum of the tumor-diameters from all slices was selected programmatically and multiplied with voxel-length 0.13cm to obtain the final tumor-diameter (in cm) and the associated slice-number was noted as max-burden-slice_no. Tumor-volume (in cc) was determined automatically by multiplying the number of voxels in segmented whole tumor region with the voxel-volume 1.3x1.3x5.0x10-3cc. Relative-percentage-changes in tumor-sizes across time-points were scored using RECIST1.1 criteria.
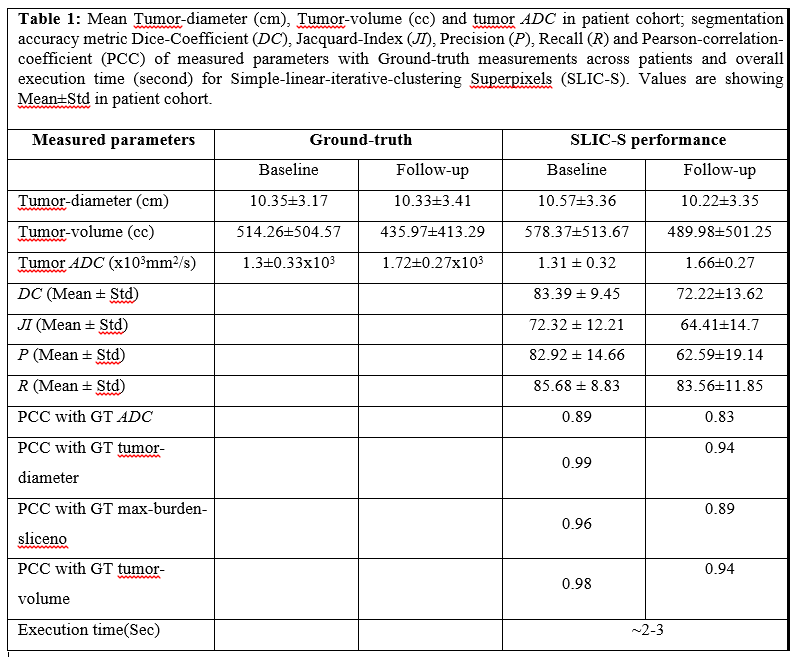
Accuracy metric: Segmentation accuracy was estimated by Dice-coefficient(DC), Jaccard-Index(JI), Precision(P) and Recall(R). Evaluated Apparent-diffusion-coefficient(ADC), tumor-diameter, max-burden-sliceno and tumor-volume in segmented tumor-mask and ground-truth tumor-mask were compared using paired-t-test for statistical significance(p<0.05) and Pearson-correlation-coefficient(PCC). Misclassification error rate (MER) for automated scoring methods for classifying patients in different response group was evaluated as $$MER= \frac{(Total no.of misclassification)}{(Total no.of patients)}$$. Proposed tool was implemented using libraries in Matlab2015b, Philadelphia, USA. Statistical analysis for accuracy calculation was performed using SPSS 16.0 software.
Results
Illustrative examples of tumor segmentation are represented in Fig2.A and Fig2.B from a representative patient. Qualitative SLIC-S produced satisfactory segmentation of tumor in comparison to the ground truth tumor ROI at baseline and follow-up. Table1 shows segmentation accuracy for all patients and average ADC in tumor-volume. At baseline high accuracy was observed (DC:~83%;JI:~72%;P:~83%;R:~86%); while at follow-up it was satisfactory (DC:~72%;JI:~64%;P:~63%;R:~86%). Mean ADC (1.29-1.31x103mm2/s) values in segmented masks were not significantly different (p>0.05) and showed excellent correlation (PCC=0.85-0.89) with the ADC(1.3±0.33x103mm2/s) values of ground-truth mask. Table2 depicted the RECIST1.1 score and volumetric response score in patient cohort using manual and automated methods. Miss-classification rate for proposed CAD tool was for RECIST1.1 and volumetric response score were 15% and 26% respectively. Assessment times were 2-3sec using Intel Xeon CPU E3-1241v3@3.50 GHz processor and 32 GB RAM.Conclusion
The automation of RECIST response evaluation provided considerable saving in manual effort and reading time with reliable and reproducible accuracy. Proposed CAD tool produced promising segmentation and RECIST score measurements in current bone tumor dataset and might be useful as decision support tool helping physicians in improving oncologic readings.Acknowledgements
Authors would like to thanks the nurse and support staff of AIIMS for support in data acquisition and scanning.References
1. Eisenhauer EA, Therasse P, Bogaerts J, et al.: New response evaluation criteria in solid tumours: revised RECIST guideline (version 1.1). Eur J Cancer 2009; 45:228–247.
2. Achanta R, Shaji A, Smith K, Lucchi A, Fua P, Susstrunk S: SLIC Superpixels. IEEE Trans Pattern Anal Mach Intell 2012; 34:2274–2282.
3. He L, Ren X, Gao Q, Zhao X, Yao B, Chao Y: The connected-component labeling problem : A review of state-of-the-art algorithms. Pattern Recognit 2017; 70:25–43.
Figures