4779
Investigation of tumor grade and gadolinium enhancement by tensor-valued diffusion encoding and QTI analysis: an exploratory study of gliomas1Radiology, Brigham and Women's Hospital, Boston, MA, United States, 2Harvard Medical School, Boston, MA, United States, 3Clinical Sciences Lund, Lund University, Lund, Sweden, 4Department of Neurosurgery, Brigham and Women's Hospital, Boston, MA, United States
Synopsis
Diffusion MRI is sensitive to the configuration of cell structures on the microscopic level, and may be a biomarker of tumor grade. High-grade gliomas are hypothesized to be more heterogeneous on a microscopic scale, when compared to low-grade; a feature that should be reflected in the diffusional kurtosis. To explore this premise, we use tensor-valued diffusion encoding to disentangle the isotropic and anisotropic kurtosis and relate them to tumor grade and tumor tissue that is enhancing vs. non-enhancing on post-gadolinium T1 maps.
Introduction
Diffusion MRI (dMRI) is sensitive to subtle changes in tissue microstructure. Such changes can be defining features of tumor malignancy, and may therefore be biomarkers of their progression and grade. Several studies have shown that high grade gliomas exhibit higher diffusional kurtosis, than their low grade counterparts [1-3]. However, diffusional kurtosis estimated by conventional dMRI [4] is also sensitive to microscopic diffusion anisotropy and orientation dispersion, which may be confounding in the interpretation of the parameter.$$$~~~~~$$$In this work, we investigate gliomas by tensor-valued diffusion encoding and q-space trajectory imaging (QTI) [5]. Tensor-valued diffusion encoding and QTI can disentangle microscopic diffusion anisotropy, orientation dispersion and variable isotropic diffusivity within each voxel [5,6]. Thus, QTI may facilitate a non-invasive probe of the heterogeneity of tissue that is less sensitive to the presence of anisotropic tissues, such as white matter, and more specific to heterogeneous cell density and micro-necrosis.
$$$~~~~~$$$We aim to test if any QTI parameter is capable of distinguishing between low and high grade gliomas, and we characterize newly diagnosed vs. recurrent tumors, as well as post-gadolinium-enhancing vs. non-enhancing tumor tissue.
Methods
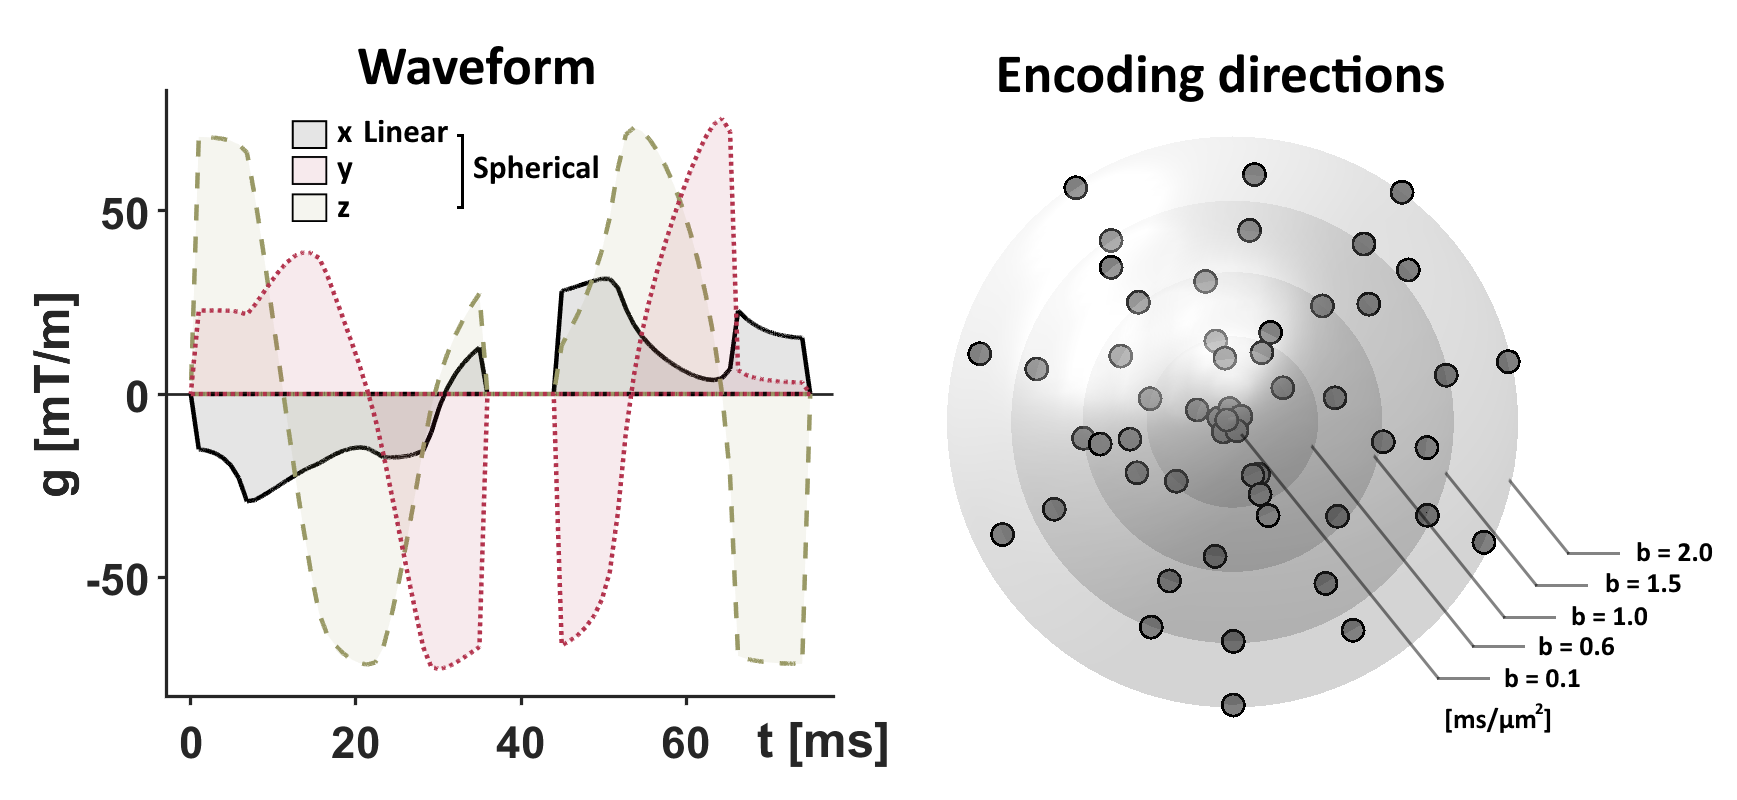
The study included 13 patients with low-grade gliomas (WHO grades I-II) and 18 patients with high-grade gliomas (WHO grades III-IV). Imaging was performed preoperatively and analyzed retrospectively to correlate diffusion parameters with tumor grade reported for the intraoperative tissue samples.$$$~~~~~$$$Tensor-valued diffusion encoding was performed with a prototype spin-echo sequence on a 3T Prisma (Siemens, Erlangen, Germany). Numerically optimized waveforms were used to yield linear and spherical b-tensors [7,8], TE=90 ms, TR=4.2 s, resolution=2×2×4 mm3, FOV=220×220×120 mm3, partial-Fourier factor of 6/8, and in-plane acceleration factor of 2 (GRAPPA) with b-values of 0.1, 0.6, 1.0, 1.5 and 2.0 ms/µm2 executed in multiple directions (Fig.1). The acquisition time was 8 minutes.
$$$~~~~~$$$The data were fitted with the QTI representation [5,9], which describes the signal in terms of the diffusion tensor $$$(\mathbf{D})$$$ and the covariance tensor $$$(\mathbb{C})~$$$[5]
$$S(\mathbf{B})=\exp(-\mathbf{B}:\mathbf{D}+1/2\cdot\mathbf{B}^{\otimes2}:\mathbb{C})$$
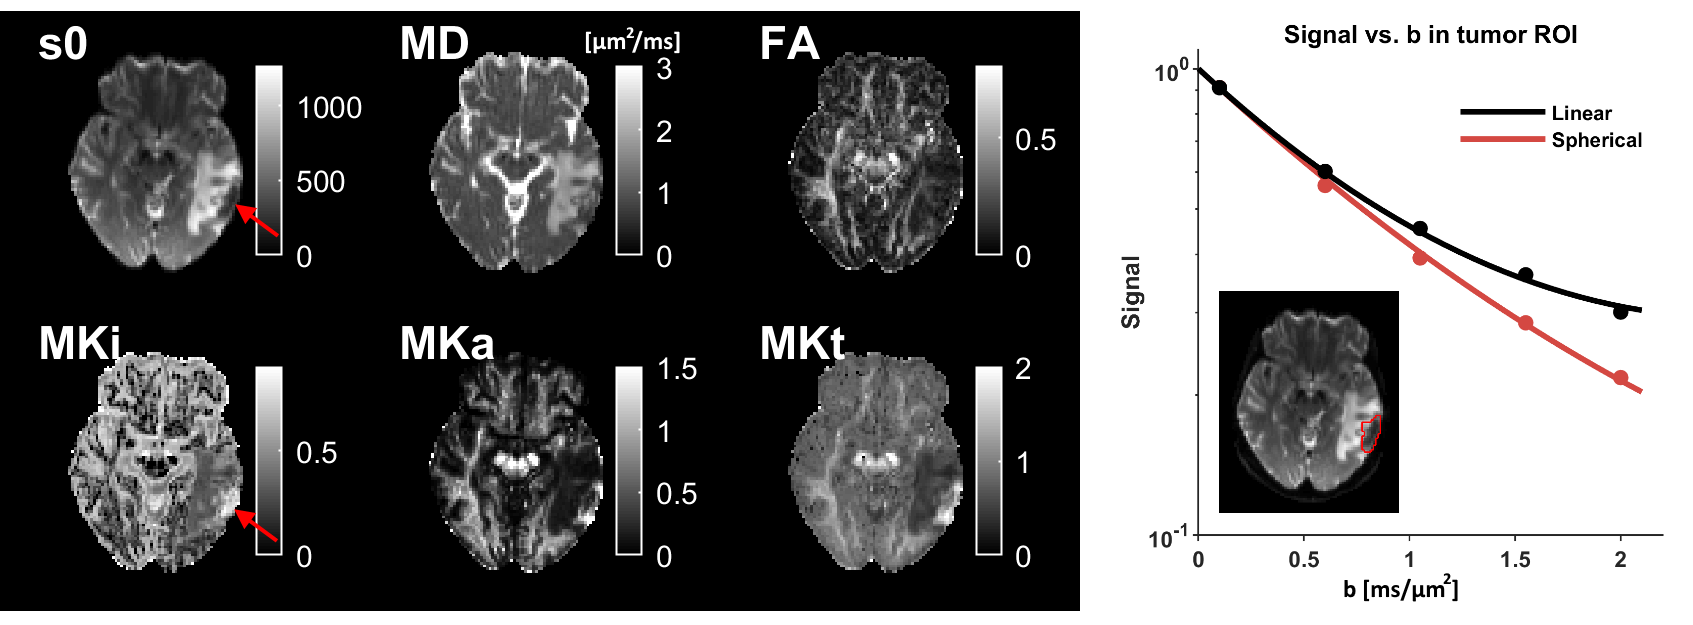
Although it was not used, we highlight the relevant parameters in a 1D-variant of this representation, according to$$S(b,b_{\Delta})=\exp(-b\mathrm{MD}+1/6\cdot b^2\mathrm{MD}^2(b^2_{\Delta}\mathrm{MKa}+\mathrm{MKi}))$$
where bΔ is the b-tensor shape (values are 0 and 1 for spherical and linear encoding) so that MK parameters are parts of the second cumulant and related to the total mean kurtosis (MKt) from DKI [4] such that MKt=MKa+MKi [10] (Fig.2). The mean diffusivity (MD) is hypothesized to reflect average tissue density [11], whereas MKi and MKa reflect tissue heterogeneity in terms of their isotropic diffusivity and microscopic anisotropy, respectively [1,2,6].
$$$~~~~~$$$Regions of interest (ROIs) were defined in the QTI parameter space with support from high-resolution post-gadolinium-T1- and T2-weighted images. Separate regions were marked for any enhancing lesion, non-enhancing lesion, necrotic cavity, cyst, edema, and resection cavity.
$$$~~~~~$$$We performed an exploratory analysis of how QTI parameters (MD, MKi, MKa and MKt) were related to several tissue features; using either a two-tailed t-test or an ROC analysis. First, we tested if QTI parameters could distinguish between low and high tumor grade across the whole material. Second, we performed the same ROC analysis separately for newly diagnosed and recurrent tumors. Finally, we investigated if QTI parameters can distinguish enhancing from non-enhancing lesions.
Results
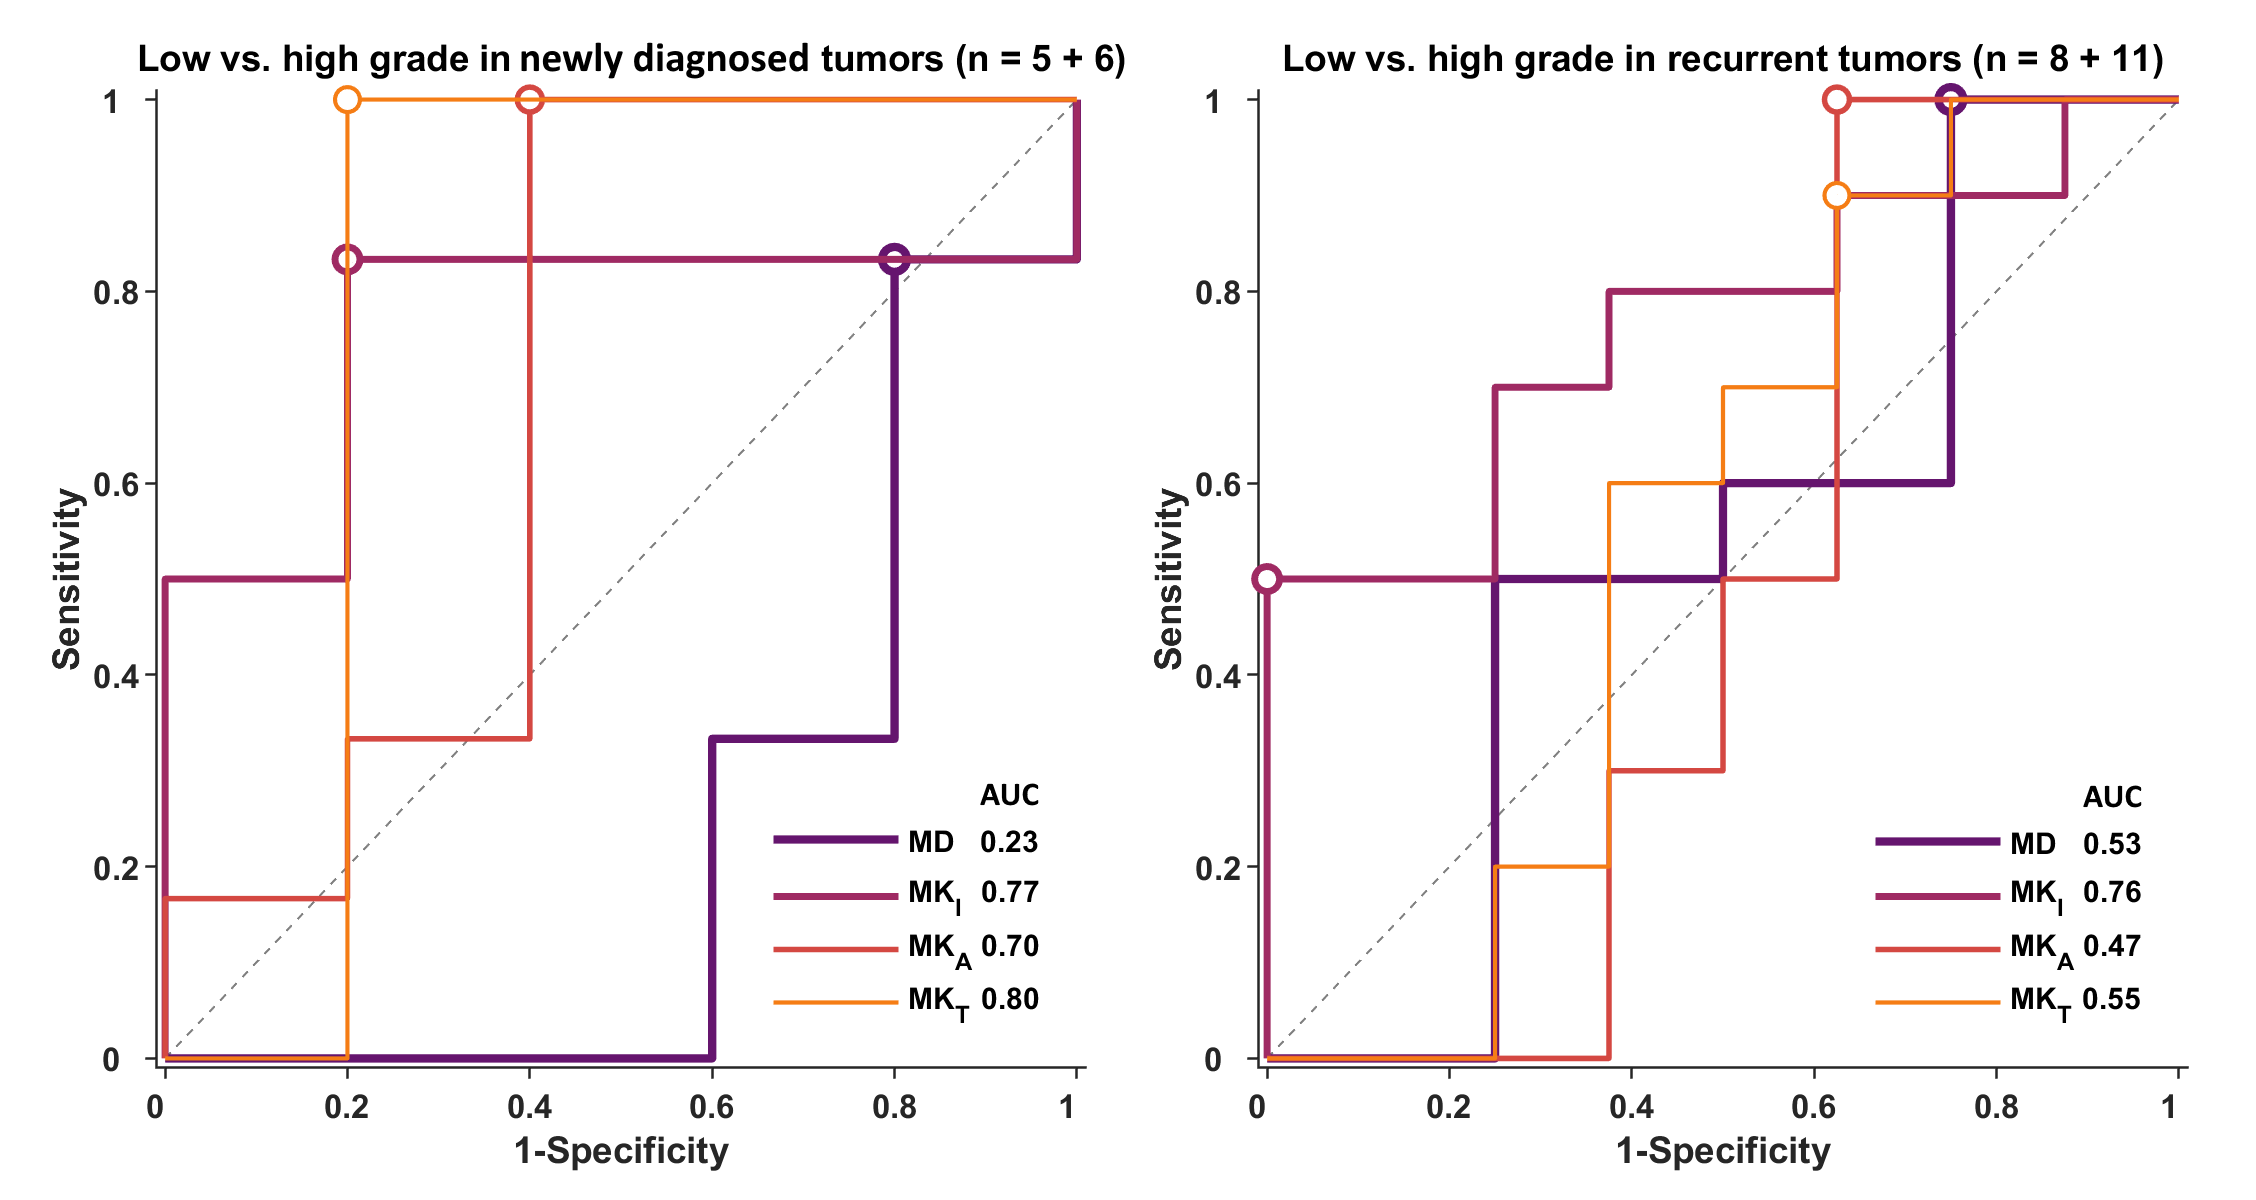
The only parameter reporting a statistically significant difference between grades is MKi where the average±SD in low vs. high grades was 0.31±0.08 vs. 0.38±0.08 (p=0.019, Fig.3). We note that the group distributions are not separated enough to serve as a distinguishing feature on a per-tumor basis (AUC=0.74, Fig.3).$$$~~~~~$$$When separating newly diagnosed and recurrent tumors, we find that MKt and MKi yield the highest AUC of 0.80 and 0.76, respectively (Fig.4).
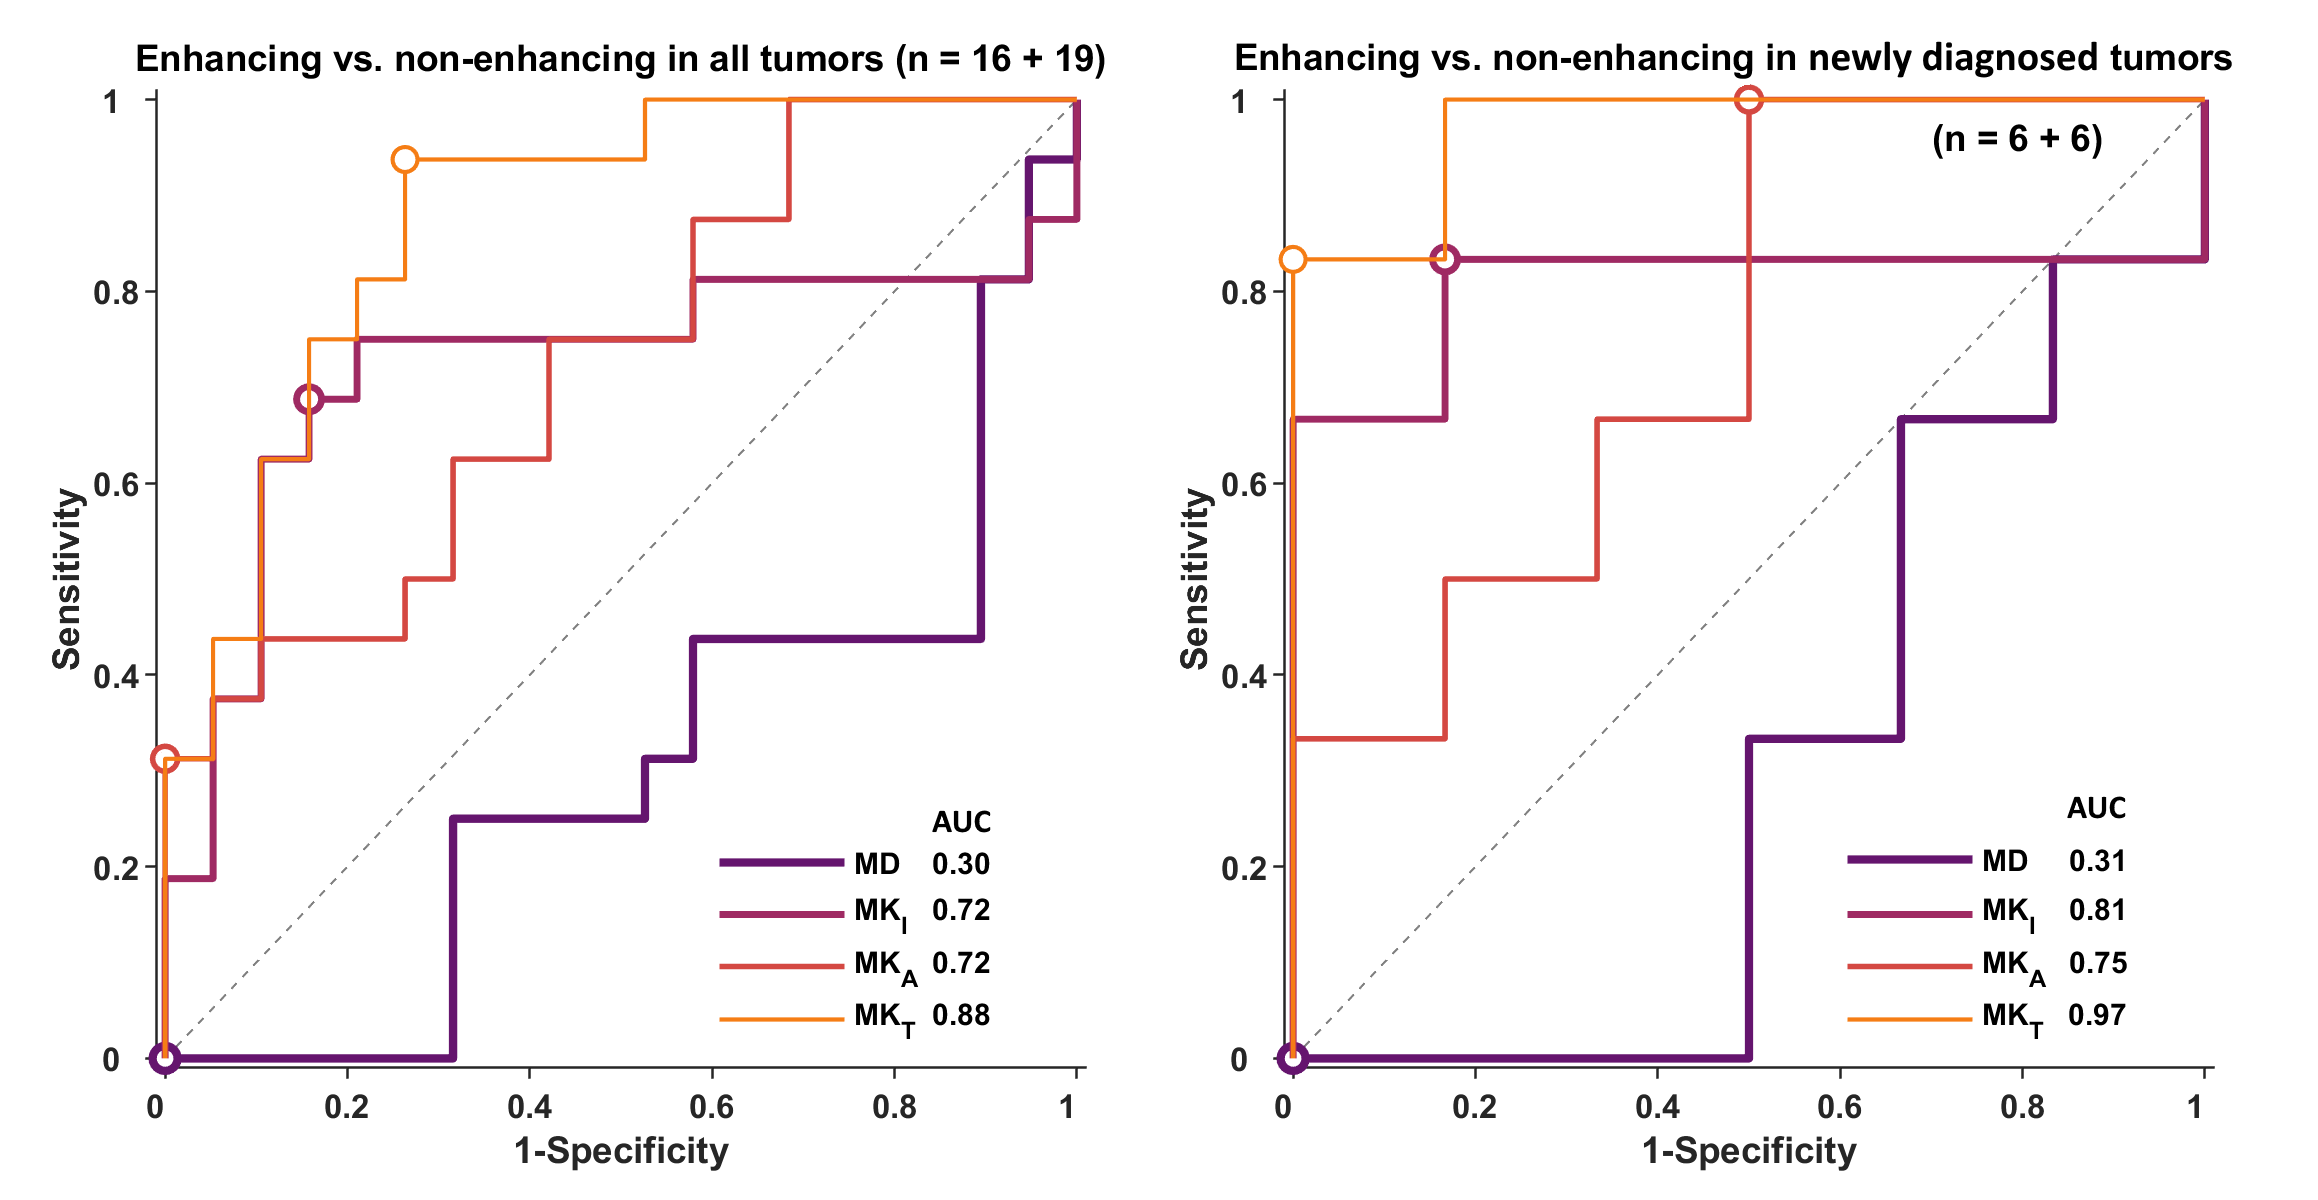
$$$~~~~~$$$A comparison of enhancing vs. non-enhancing tumor tissue shows that MKt has the best performance, especially when isolating the analysis to newly diagnosed tumors (AUC=0.97, Fig.5).
Discussion and conclusions
We have explored QTI parameters in gliomas and performed analysis directed at the differences between tumors of different grades, newly diagnosed vs. recurrent cases, and enhancing vs. non-enhancing tissue. The MKi was the strongest predictor of tumor grade. This corroborates the hypothesis that tumor heterogeneity increases with grade [1,2], however, the separation between groups was insufficient for successful individual diagnosis. We speculate that the MKi is the most powerful because it removes the influence from diffusion anisotropy, whereas metrics that are available by conventional diffusion encoding (such as MKt from DKI) are confounded by the presence of anisotropic tissue [6]. This appears to be especially relevant in the recurrent tumors. Furthermore, high MKi in high grade tumors is consistent with the presence of microscopic necrosis. By contrast, we find that MKt outperforms the other parameters for separation of enhancing and non-enhancing tissue. This feature prompts further investigation of MKt as a substitute for gadolinium injections.$$$~~~~~$$$We note that the current study is limited by its small sample sizes, and that the observations must be tested in independent studies. Furthermore, we note that it is unknown to what degree diffusion time-dependence affects the QTI parameters [12], especially in tumor tissue. Such effects are the focus of ongoing investigations.
Acknowledgements
We acknowledge the following research grants NIH P41EB015902, NIH R01MH074794. This work was supported by grants from Swedish Research Council (2016-03443). We thank Siemens Healthcare (Erlangen, Germany) for access to the pulse sequence programming environment.References
[1] Raab et al. Cerebral gliomas: diffusional kurtosis imaging analysis of microstructural differences. Radiology, 2010.
[2] van Cauter et al. Gliomas: diffusion kurtosis MR imaging in grading. Radiology, 2012.
[3] Falk et al. Glioma grade discrimination with MR diffusion kurtosis imaging: a meta-analysis of diagnostic accuracy. Radiology, 2017.
[4] Jensen et al. Diffusional kurtosis imaging: the quantification of non-gaussian water diffusion by means of magnetic resonance imaging. MRM, 2005.
[5] Westin et al. Q-space trajectory imaging for multidimensional diffusion MRI of the human brain. Neuroimage, 2016.
[6] Szczepankiewicz et al. The link between diffusion MRI and tumor heterogeneity: Mapping cell eccentricity and density by diffusional variance decomposition (DIVIDE). Neuroimage, 2016.
[7] Sjölund et al. Constrained optimization of gradient waveforms for generalized diffusion encoding. JMR, 2015.[8] Szczepankiewicz et al. Maxwell‐compensated design of asymmetric gradient waveforms for tensor‐valued diffusion encoding. MRM, 2019.
[9] Nilsson et al. An open-source framework for analysis of multidimensional diffusion MRI data implemented in MATLAB. Proc. Intl. Soc. Mag. Reson. Med. (26), Paris, France, 2018.
[10] Lasic et al. Microanisotropy imaging: quantification of microscopic diffusion anisotropy and orientational order parameter by diffusion MRI with magic-angle spinning of the q-vector. Front. Phys., 2014.
[11] Chen et al. The correlation between apparent diffusion coefficient and tumor cellularity in patients: a meta-analysis. PLoS One, 2013.
[12] Jespersen et al. Effects of nongaussian diffusion on "isotropic diffusion" measurements: An ex-vivo microimaging and simulation study. JMR, 2019.
Figures