4778
Can fewer diffusion-weighting data points deliver similar diagnostic performance for breast IVIM-MRI?1International School of Beaverton, Aloha, OR, United States, 2Oregon Health & Science University, Portland, OR, United States, 3University of Washington, Seattle, WA, United States
Synopsis
The goal of this study is to compare the diagnostic performance between intravoxel incoherent motion (IVIM) imaging parameters derived from standard biexponential IVIM model fitting and those from direct calculation using only 3 b-values. This was accomplished using Monte Carlo simulations and IVIM data acquisition and analysis from 27 patients with 28 suspicious breast lesions. Results show that at low signal-to-noise ratio, the 3 b-value approach improved parameter accuracy and provided comparable diagnostic performance in benign-malignant classification compared to the biexponential fitting approach.
Introduction
The apparent diffusion coefficient (ADC) from diffusion-weighted MRI (DW-MRI) is a quantitative imaging marker shown capable of improving breast cancer diagnostic accuracy.1 The IVIM (intra-voxel incoherent motion) approach for DW-MRI acquisition and analysis, which quantifies pseudo-random perfusion from capillary bed and “true” random diffusion in the tissue, is an emerging technique for breast lesion characterization.1-3 A recent liver IVIM-MRI study4 proposed to simplify data fitting by using only three b-values for quantifying perfusion fraction (f) and the “slow” diffusion coefficient (D), consequently saving time and cost. The goal of this study is to compare the accuracies of IVIM parameters using simulations and the diagnostic performances for breast cancer between the two approaches of standard biexponential IVIM fitting and 3 b-value calculations.Methods
Simulation: A noiseless biexponential decay curve was created using literature values5 for D* (pseudodiffusivity), D and f. Ten thousand Monte Carlo simulation runs were performed at each signal-to-noise ratio (SNR) with the only difference between runs being the random Gaussian noises added. In each simulation, the IVIM parameters were obtained using the standard biexponential fitting with 12 b-values (0, 10, 25, 50, 75, 100, 150, 250, 450, 800, 1000, and 1200 s/mm2) and using the 3 b-value (0, 200, 800 s/mm2) method.4 Ten SNRs evenly spaced from 10 to 100 were simulated.Human Data: Twenty-seven patients were referred for biopsies due to mammography and/or ultrasound findings of 28 suspicious breast lesions. They underwent a 3T (Siemen) pre-biopsy MRI study, which, in addition to DCE-MRI, included axial bilateral DW-MRI using a single-shot SE EPI sequence with the aforementioned 12 b values applied in three orthogonal directions, 192x192 in-plane matrix, 32-34 cm FOV, 5 mm slice thickness (no gap), and ~8 min acquisition time.
Data Analysis: Clinical reading of the anatomic and DCE images was performed according to the ACR breast MRI BI-RADS lexicon.6 For quantitative analysis, lesion ROIs were drawn on DW-MRI in reference to post-contrast DCE images. The voxel DW-MRI data within the ROIs were analyzed in three ways: 1) biexponential IVIM model1 fitting with all b ≤ 1000 s/mm2 values to extract D, D*, and f; 2) 3 b-value approach4 to extract Dest and fest (est: estimate); 3) monoexponential fitting using two b values (0 and 800 s/mm2) to derive ADC. The lesion mean parameter value was calculated as the average of the voxel values within the ROI.
Pathologically determined malignant/benign lesion status was correlated with the MRI markers. A linear support vector machine7 was used to assess diagnostic performances for individual markers, as well as combined markers constructed by concatenating individual markers to form feature vectors with multiple dimensions. The ROC AUC values were compared with the Hanley and McNeil method.8
Results
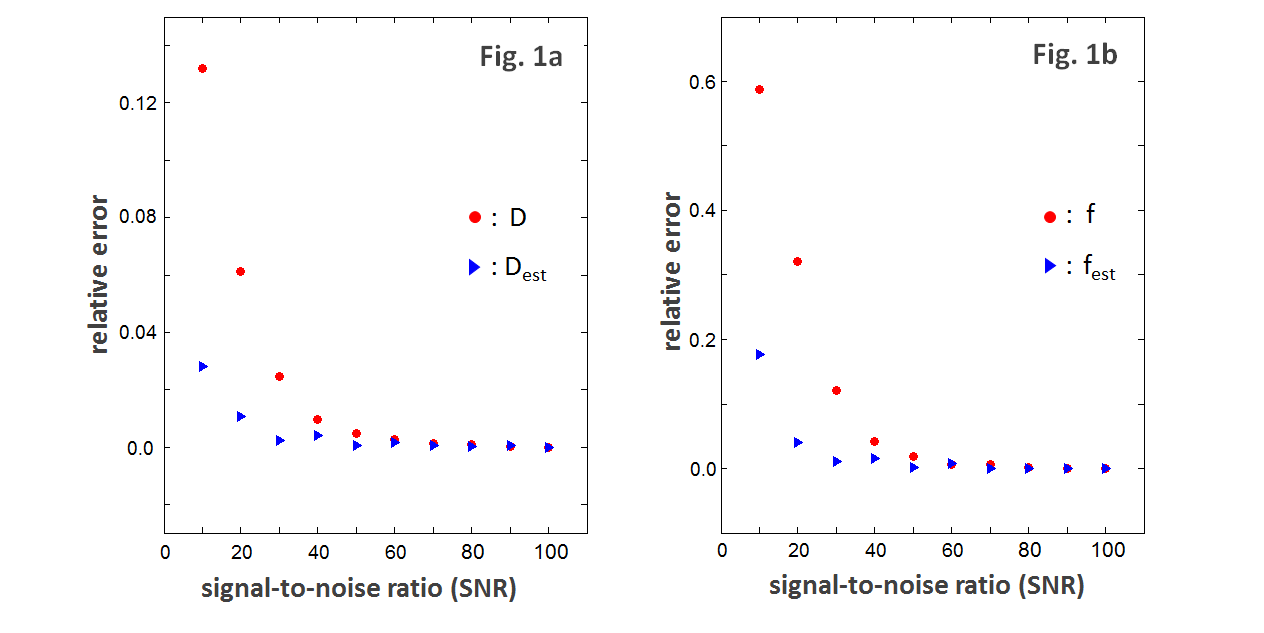
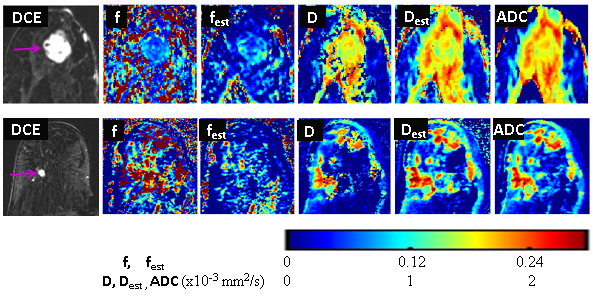
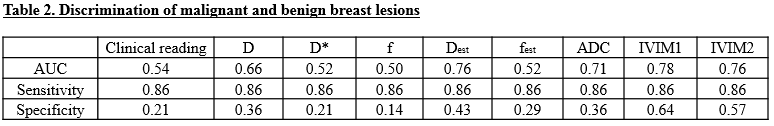
Fig.1 compares the relative mean errors of the IVIM parameters derived in simulations at different SNRs between D and Dest (1a), f and fest (1b), respectively. Relative errors for both sets of parameters decrease with increasing SNR. When SNR ≤ 50, the 12-b value biexponential fit generates larger parameter errors than the 3-b value fit. The errors from the two fitting approaches converge and reach a plateau near zero when SNR ≥ 60.Fourteen lesions were pathologically proven malignant and the other 14 benign. Fig.2 shows post-contrast DCE images and color f, fest, D, Dest, and ADC maps of a benign (top) and malignant (bottom) lesion, where the malignant lesion demonstrated lower D, Dest, and ADC values compared to the benign lesion. The mean ± SD values of the individual markers for the two lesion groups are summarized in Table 1. Significant (P < 0.05) differences were found only in ADC and Dest. Table 2 shows the ROC AUC, sensitivity, and specificity values for breast cancer diagnosis. The clinical MRI reading produced 86% sensitivity and 21% specificity. For fair comparison, the specificities of all the other markers were calculated with cut-off values that generated 86% sensitivity. No statistically significant difference was detected in any pair-wise comparison of AUC values. The AUCs of Dest and fest are comparable to those of D and f, respectively, with Dest showing the highest specificity. Further, the AUCs of the two combinations of IVIM markers, obtained with either of the two modeling approaches, were similar to each other, but higher than those of most individual markers.
Discussion
The measured SNRs for the human breast DW-MRI data ranged 25 to 50. Results from the simulation and human data suggest that, at low SNR, the simple 3 b-value approach4 could deliver characterization and diagnostic performance in breast lesions similar to the conventional IVIM-MRI method employing many more b values. The “ill-conditioned” problem9 for biexponential fitting at low SNR could be the major source of error for parameter estimation. The 3 b-value approach, therefore, can be a simpler, time- and cost-saving alternative for breast IVIM quantification. One drawback of this method is that it doesn’t quantify D*. With a very limited cohort size, the study findings need to be validated in a much larger population.Acknowledgements
Oregon Health & Science University Center for Women’s Health Circle of Giving Award.
Thorsten Feiweier (Siemens) for providing the work-in-progress sequence for IVIM-MRI data acquisition.
References
1. Partridge SC, Nissan N, Rahbar H, Kitsch AE, Sigmund EE. Diffusion-weighted breast MRI: clinical applications and emerging techniques. J Magn Reson Imaging 2017;45:337-355.
2. Iima M, Le Bihan D. Clinical intravoxel incoherent motion and diffusion MR imaging: past, present, and future. Radiology 2016;278:13-32.
3. Bokacheva L, Kaplan JB, Giri DD, Patil S, Gnanasigamani M, Nyman CG, et al. Intravoxel incoherent motion diffusion-weighted MRI at 3.0T differentiates malignant breast lesions from benign lesions and breast parenchyma. J Magn Reson Imaging 2014;40:813-823.
4. Jalnefjord O, Montelius M, Starck G, Ljungberg M. Optimization of b‐value schemes for estimation of the diffusion coefficient and the perfusion fraction with segmented intravoxel incoherent motion model fitting. Magn Reson Med (2019). Epub ahead of print.
5. Liu C, Liang C, Liu Z, Zhang S, Huang B. Intravoxel incoherent motion (IVIM) in evaluation of breast lesions: comparison with conventional DWI. Eur J Radiol 2013; 82:e782-e789.
6. "American College of Radiology. Breast imaging reporting and data system (BI-RADS): breast imaging atlas," Reston, VA: American College of Radiology (2003).
7. Cortes C, Vapnik V. Support-vector networks. Machine Learning 1995;20:273-297.
8. Hanley JA, McNeil BJ. A method of comparing the areas under receiver operating characteristic curves derived from the same cases. Radiology 1983;148:839-843.
9. Kroeker, RM and Henkelman RM. Analysis of Biological NMR Relaxation Data with Continuous Distributions of Relaxation Times. J. Magn. Reson. 1986; 69: 218-235.
Figures