4777
Multi-site evaluation of MR breast phantom with internal MR-visible liquid crystal thermometer: initial temperature and DWI measurements
Lisa J Wilmes1, David C Newitt1, Wen Li1, Evelyn Proctor1, Natsuko Onishi1, Teffany Joy Bareng1, Tom L Chenevert 2, Dariya I Malyarenko2, Patrick J Bolan3, Todor Karaulanov4, Nola M Hylton1, and Kathryn E Keenan5
1University of California San Francisco, San Francisco, CA, United States, 2University of Michigan Medical School, Ann Arbor, MI, United States, 3University of Minnesota Medical School, Minneapolis, MN, United States, 4QalibreMD, Boulder, CO, United States, 5National Institute of Standards and Technology, Boulder, CO, United States
1University of California San Francisco, San Francisco, CA, United States, 2University of Michigan Medical School, Ann Arbor, MI, United States, 3University of Minnesota Medical School, Minneapolis, MN, United States, 4QalibreMD, Boulder, CO, United States, 5National Institute of Standards and Technology, Boulder, CO, United States
Synopsis
A multiparametric breast phantom with an integrated MRI-“visible” liquid crystal (LC) thermometer for real-time monitoring of phantom temperature was evaluated at three imaging sites, on MRI scanners from different vendors. Short-duration MRI acquisitions were optimized for visualization of LC elements and implemented at the sites for temperature measurements before and after DWI acquisitions. MRI-measured temperature differences between different imaging experiments were reflected in different water ADC values, calculated from DWI, that were consistent with the relationship between ADC and temperature described in the literature.
Introduction
Multi-site data acquisition of MRI biomarkers is necessary for clinical trials, and it is especially important to characterize the quality of quantitative MRI measurements across different imaging sites. Previously, a breast MRI phantom was developed that can be used to assess T1 relaxation time measurements, quality of fat suppression, and the accuracy and reproducibility of apparent diffusion coefficients (ADCs) calculated from diffusion-weighted imaging (DWI)1,2. Especially in the case of ADC, the temperature at the time of the measurement is necessary to assess the accuracy and reproducibility, because diffusion is a thermally-dependent process. Previous multi-site diffusion studies have successfully used ice-water to control the temperature of the diffusion measurement3,4. An integrated liquid crystal thermometer was developed that enables MRI-based measurement of temperature5. We compared ADC measurements across multiple sites, taking into account the temperature at the time of measurement.Methods
Breast phantom and integrated thermometerThree breast phantoms were constructed containing water and polyvinylpyrrolidone (PVP) elements to mimic the range of human breast ADC values expected for healthy tissue, benign tumor and malignant tumor tissues as previously described1. In this updated version, a liquid crystal (LC) thermometer5 was included in the center of each of three breast phantoms, which were sent to participating imaging sites. The liquid crystal thermometer contained ten vials with LCs of different transition temperatures. A “visual calibration ” of the LC thermometer was conducted by the manufacturer, QalibreMD, and the transition temperatures of the ten consecutive LC vials ranged from 15.5C to 25.5C in approximately 1C increments with +/-0.5C uncertainty (Figure 1) To determine the temperature from the MR image, the viewer determines the first “on” or visible vial. Then, the recorded temperature is the temperature of that vial +/- 0.5C uncertainty.
MRI methodsMRI data were acquired at three different sites on 3 T MRI scanners from the three main MRI vendors (GE, Philips, Siemens). Dedicated 8- or 16-channel breast coils were used at all sites. MRI data consisted of optimized 2D GRE and 2D FSE MRI thermometer measurements (acquisition time ~1 minute) acquired before and after multiple DWI acquisitions. DWI data were acquired using a standard two b-value (0,800 mm2/s) single shot echo planar imaging sequence at all sites. MRI data from all sites were centrally analyzed. Temperature was visually assessed on the central slice of MRI thermometer images, and ADC maps were calculated from DWI data using in-house software (Exelis Visual Information Solutions, Boulder, CO).
Temperature correction of ADCAt all sites, temperature was also measured using an external method in addition to the integrated thermometer (e.g. alcohol thermometer, liquid crystal thermometer strip on the exterior of the phantom, or a thermistor). Then, based on the work of Holz et al.6 to fit empirical data with the Speedy-Angel power law, the estimated water ADC was determined from:ADC = ADC0[(T/TS)-1]γ,where ADC0 = (1.635 x 10⁻⁸ +/- 2.242 x 10⁻¹¹) m2 s-1, TS = (215.05 +/- 1.20) K, and γ = 2.063 +/- 0.051. The parameters determined by Holz et al are appropriate for water between 0 and 100 C.
Results
MR images of the integrated thermometer showed that the temperature at all three imaging sites did not change from pre- to post- ADC acquisitions (Figure 1). A representative ADC map showing the ROI in the water vial is shown (Figure 2). All three sites had water ADC measurements that agreed with the Holz-model-predicted values (Table 2, Figure 3). The temperature determined by the integrated thermometer did not always agree within the uncertainty with the alternate external temperature measurement. However, the range of predicted ADC values using the integrated thermometer or the alternative temperature measurement did overlap.Discussion
This work demonstrated the feasibility of imaging the integrated LC thermometer at multiple imaging sites with different scanner configurations, using two different commercial imaging sequences, with acquisitions times on the order of one minute. When the relationship between MRI measured temperature and water ADC was evaluated, all sites measured ADC values consistent with the range of ADCs predicted for the measured temperature. It was also noted that the integrated phantom MRI thermometer measurement did not always agree with the alternative temperature measurement, which could be due to the different location of the temperature measurements (internal vs. external surface), or the temporal differences in measurements (alternative temperature measurements happened outside the scan room prior to or after the entire imaging session).Conclusion
It is important to account for temperature when comparing DWI measurements across imaging sites. The real-time temperature monitoring of phantom studies using the LC thermometer may help improve the reproducibility of DWI data acquisition, by improving corrections for ADC temperature dependenceAcknowledgements
Support: National Institutes of Health Grants: U01CA225427, 1R44CA235820, U01CA166104, P41 EB027061, R01 CA 190299References
- Keenan KE, Wilmes LJ, Aliu SO, Newitt DC, Jones EF, Boss MA, Stupic KF, Russek SE, Hylton NM. 2016. Design of a breast phantom for quantitative MRI. Journal of Magnetic Resonance Imaging, 44(3):610-619.
- Keenan KE, Peskin AP, Wilmes LF, Aliu SO, Jones EF, Li W, Kornak J, Newitt DC, Hylton NM. 2016. Variability and bias assessment in breast ADC measurement across multiple systems. Journal of Magnetic Resonance Imaging, 44(4):846-855.
- Chenevert TL, Galbán CJ, Ivancevic MK, Rohrer SE, Londy FJ, Kwee TC, Meyer CR, Johnson TD, Rehemtulla and Ross Brian D. 2011. Diffusion coefficient measurement using a temperature controlled fluid for quality control in multi-center studies. Journal of Magnetic Resonance Imaging, 34(4): 983–987.
- Malyarenko DI, Swanson SD, Konar AS, LoCastro E, et al. 2019. Multicenter Repeatability Study of a Novel Quantitative Diffusion Kurtosis Imaging Phantom. Tomography, 5:36-43.
- Keenan KE, Mirowski E, Snow M, Stupic KF, Russek SE, 2018. Liquid Crystal Magnetic Resonance Visible Thermometer. Proceedings of the International Society of Magnetic Resonance in Medicine 25th Scientific Meeting. Paris, France.
- Holz M, Heil SF, Sacco A. 2000. Temperature-dependent self-diffusion coefficients of water and six selected molecular liquids for calibration in accurate 1H NMR PFG measurements. Physical Chemistry Chemical Physics, 2: 4740-4742.
Figures

Figure 1. Schema of visual interpretation of LC MRI visible thermometer that is in the middle of the diffusion subunit of the bilateral multiparametric MRI breast phantom. The number of bright vials indicates the temperature with +/- 0.5 °C. This example indicates 20.9 +/- 0.5 °C
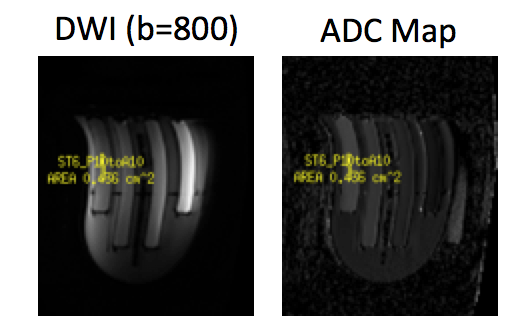
Figure 2. Representative DWI (b=800) and ADC map
showing the ROI in the water vial of the breast phantom DWI sub-unit is shown.

Figure 3. MR images (2dGRE and 2dSE) that were optimized to
visualize the MR-visible integrated phantom thermometer show that the
temperature at all three imaging sites did not change from pre- to post- DWI
acquisitions. The MRI thermometer measured temperature estimates for the
phantoms at each site are: Sites 1 and 2 (6 vials bright) 20.9C +/- 0.5; Site 3
(8 vials bright) 23.4 C +/- 0.5

Figure 4. Plot of water ADC values vs. temperature (C), for measured and calculated values.

Table 1. Summary of measured and calculated ADC values