4776
Repeatability of ADC histogram metrics from the ACRIN6698 breast cancer therapy response trial1Radiology and Biomedical Imaging, University of California, San Francisco, CA, United States, 2Radiology, University of Michigan Medical School, Ann Arbor, MI, United States, 3Radiology, University of Washington, Seattle, WA, United States
Synopsis
Repeatability of quantitative imaging metrics is important for establishing precision of diagnostic and prognostic measurements. In the multi-center ACRIN6698 trial, mean apparent diffusion coefficient (ADC) of breast tumors showed excellent repeatability but only moderate predictive power for breast cancer therapy response. Previous single-center studies have shown improved predictive performance using alternative ADC histogram metrics related to dense tumor volume. This study evaluates repeatability for a variety of alternative ADC histogram metrics to establish confidence intervals and inform predictive models for future breast cancer therapy response analysis.
Introduction
Apparent diffusion coefficient (ADC) has been shown to improve specificity and positive predictive value of breast MRI1,2. Previous findings from the multi-center ACRIN6698 trial3 indicate excellent repeatability4, but moderate predictive power for treatment outcome by breast tumor mean ADC 3. Other single-center research indicated improved tumor characterization using alternative histogram metrics5-7, as well as potential relation of volume-based metrics7 to clinical RECIST criteria8. This study analyzes repeatability of ADC histogram characteristics to establish confidence intervals (CIs) for corresponding biomarkers, and to illustrate a workflow for selection of robust metrics for predictive models.Methods
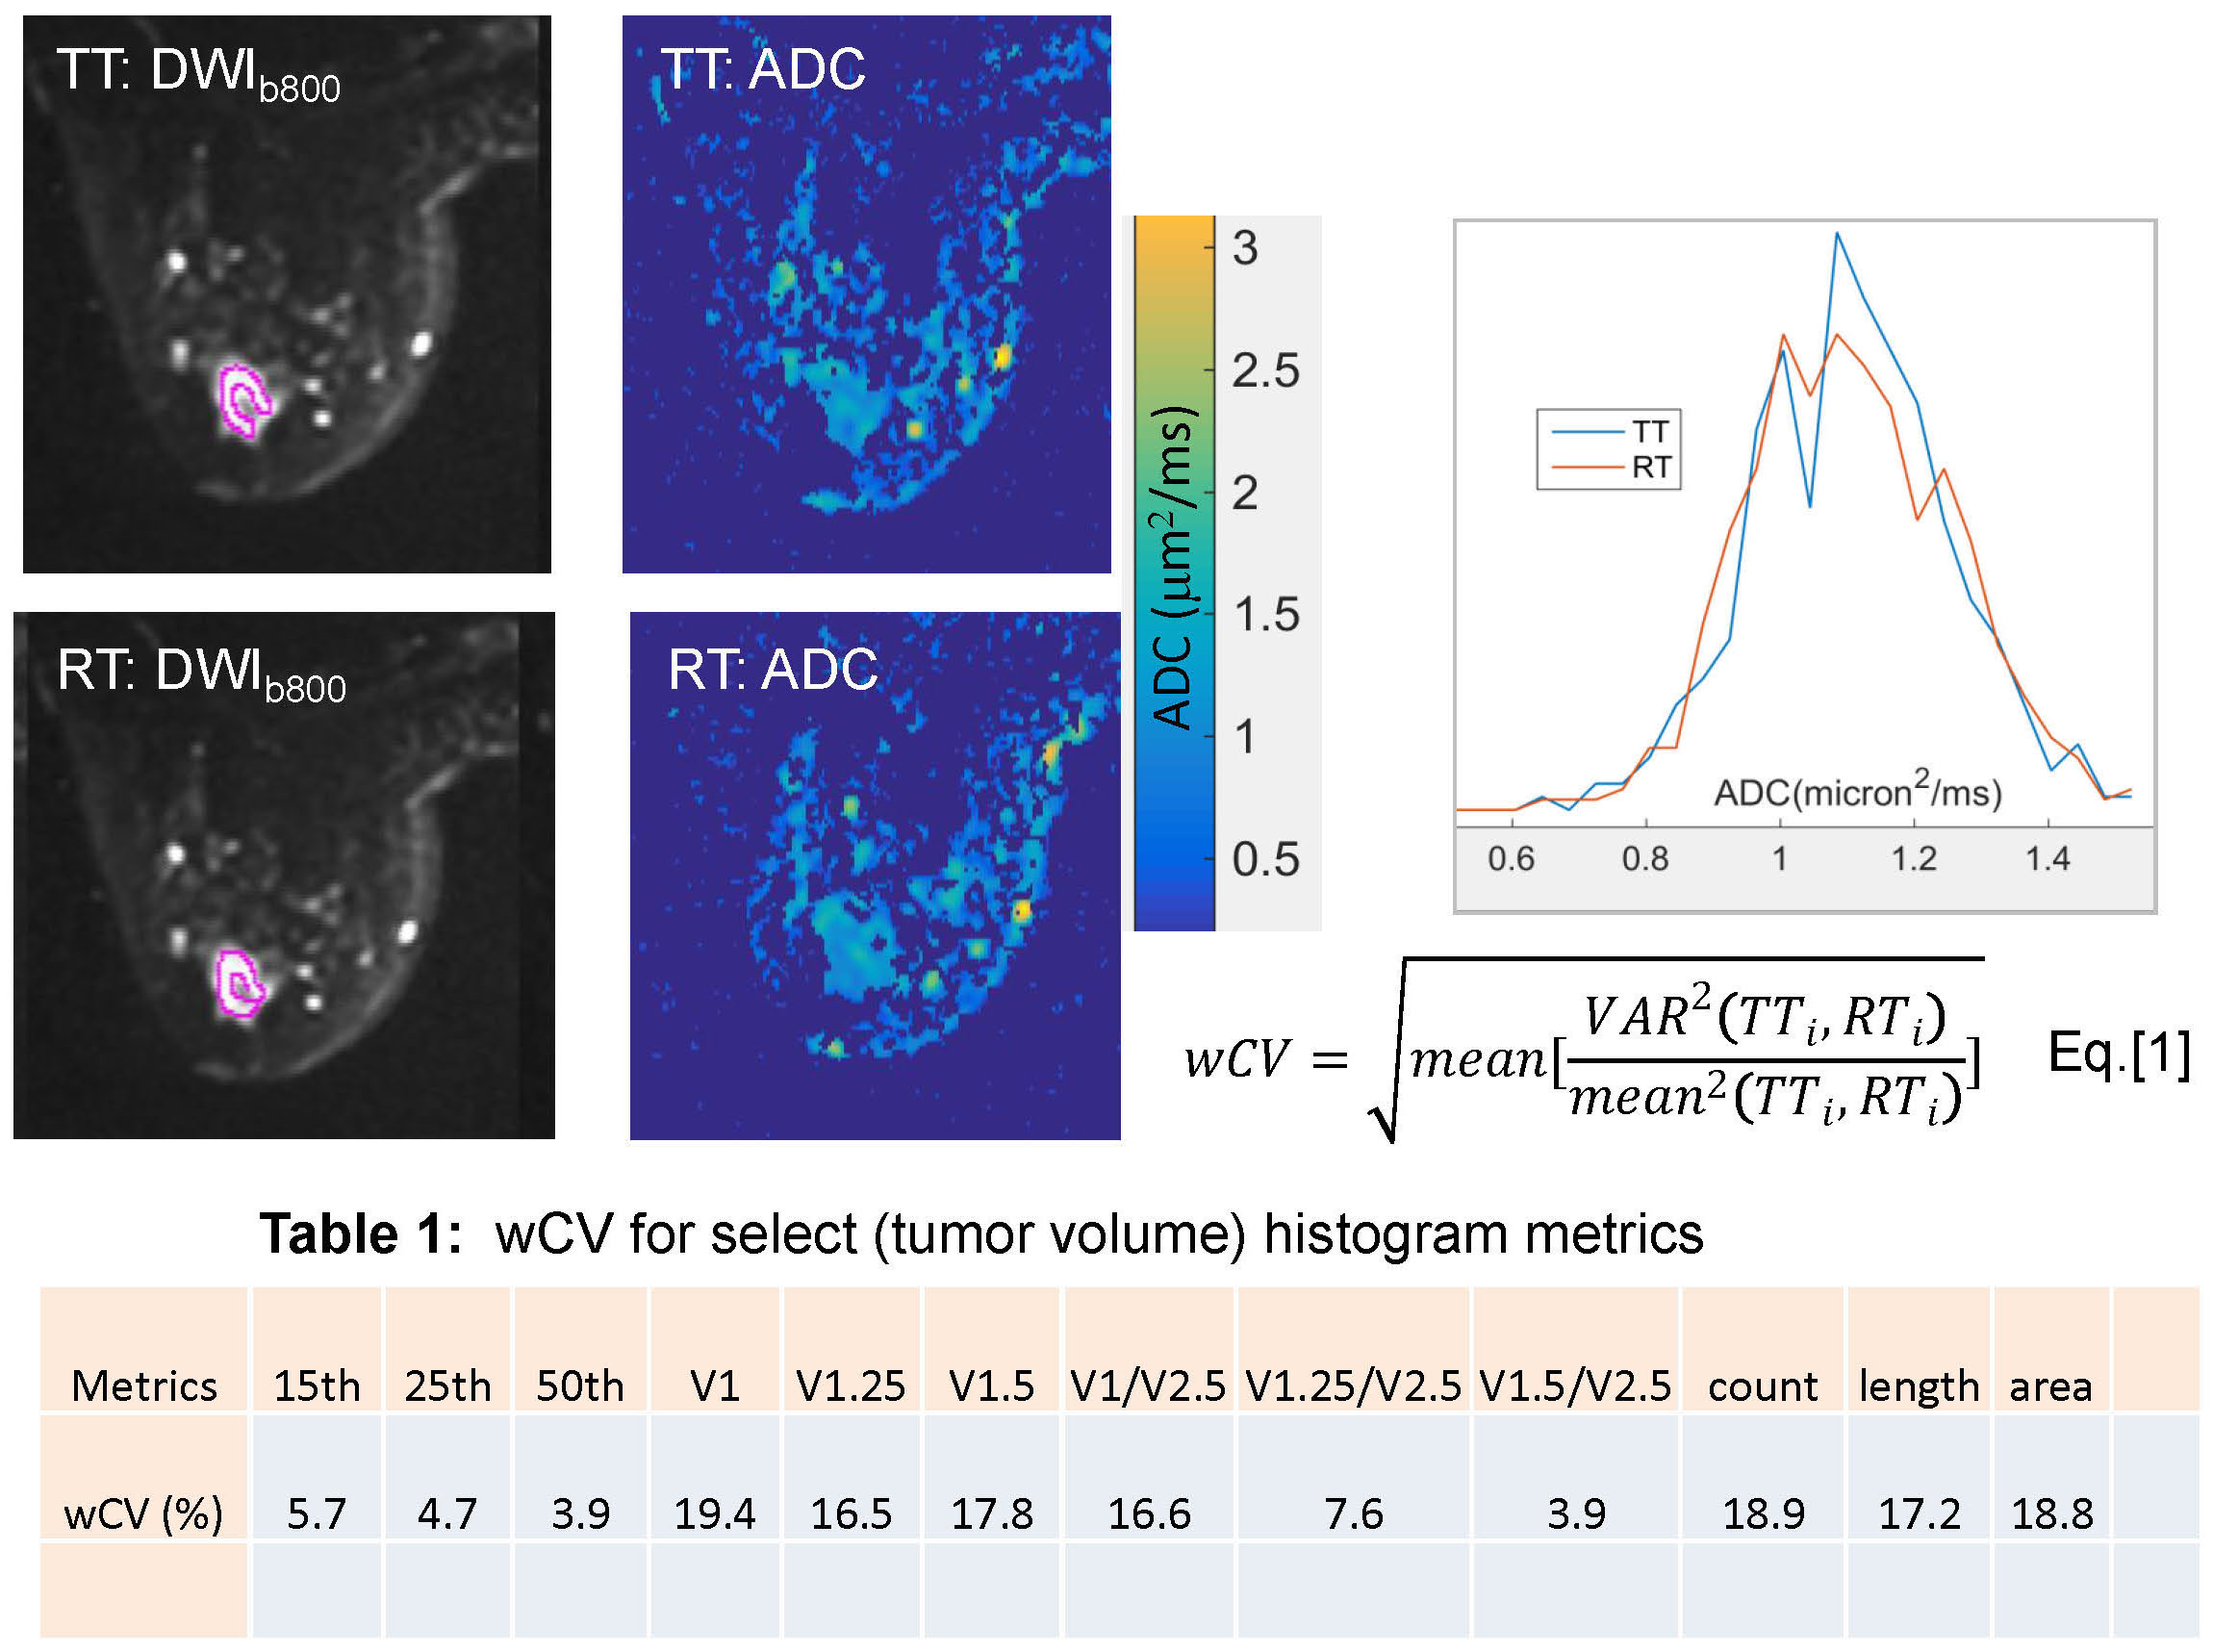
Test (TT) and re-test (RT) DWI scans were performed for 60 subjects with biopsy-confirmed malignancies (stage II & III) at baseline (before treatment) as part of the ACRIN6698 multi-center trial3,4. Three direction DWI scans were acquired twice for each subject during the same imaging session, before and after repositioning, using b = 0, 100, 600, 800 s/mm2. TT and RT ADC maps were calculated using a mono-exponential model. Multi-slice ROIs encompassing the whole observed solid tumor were manually defined independently for TT and RT on b = 800 s/mm2 images, referencing DCE subtraction images for tumor localization and avoiding high-ADC necrotic areas4. Segmented tumor volume maps were then applied to the corresponding ADC maps and used to define subject-specific TT and RT histograms.Standard tumor ADC histogram statistics, including mean, standard deviation, skew, kurtosis, median, ranges, and percentiles (5th, 15th, 25th, 50th, 75th, and 95th), were generated. Low ADC tumor volumes (VADC) were calculated using cumulative sums for histogram voxels with ADC < 0.5, 0.75, 1, 1.25, 1.5, 2, and 2.5 μm2/ms, multiplied by image voxel volume. Normalized low ADC volumes were calculated by dividing VADC by V2.5, the full ROI volume. The measurement repeatability of each metric across subjects was quantified using within-subject coefficient of variance9.
Bland-Altman (BA) plots were used to assess 95% limits of agreement (LOA) for lower percentiles and low ADC volumes compared to mean histogram metrics. The sources of variability for select metrics were analyzed from population-wise distributions and inter-subject Pearson correlation, R, with ROI parameters (counts, extent, area). All image and statistical analysis was automated using home-built IDL software (Exelis Visual Information Solutions, Boulder, CO) and MATLAB R2015b toolboxes (Mathworks, Natick MA).
Results and Discussion
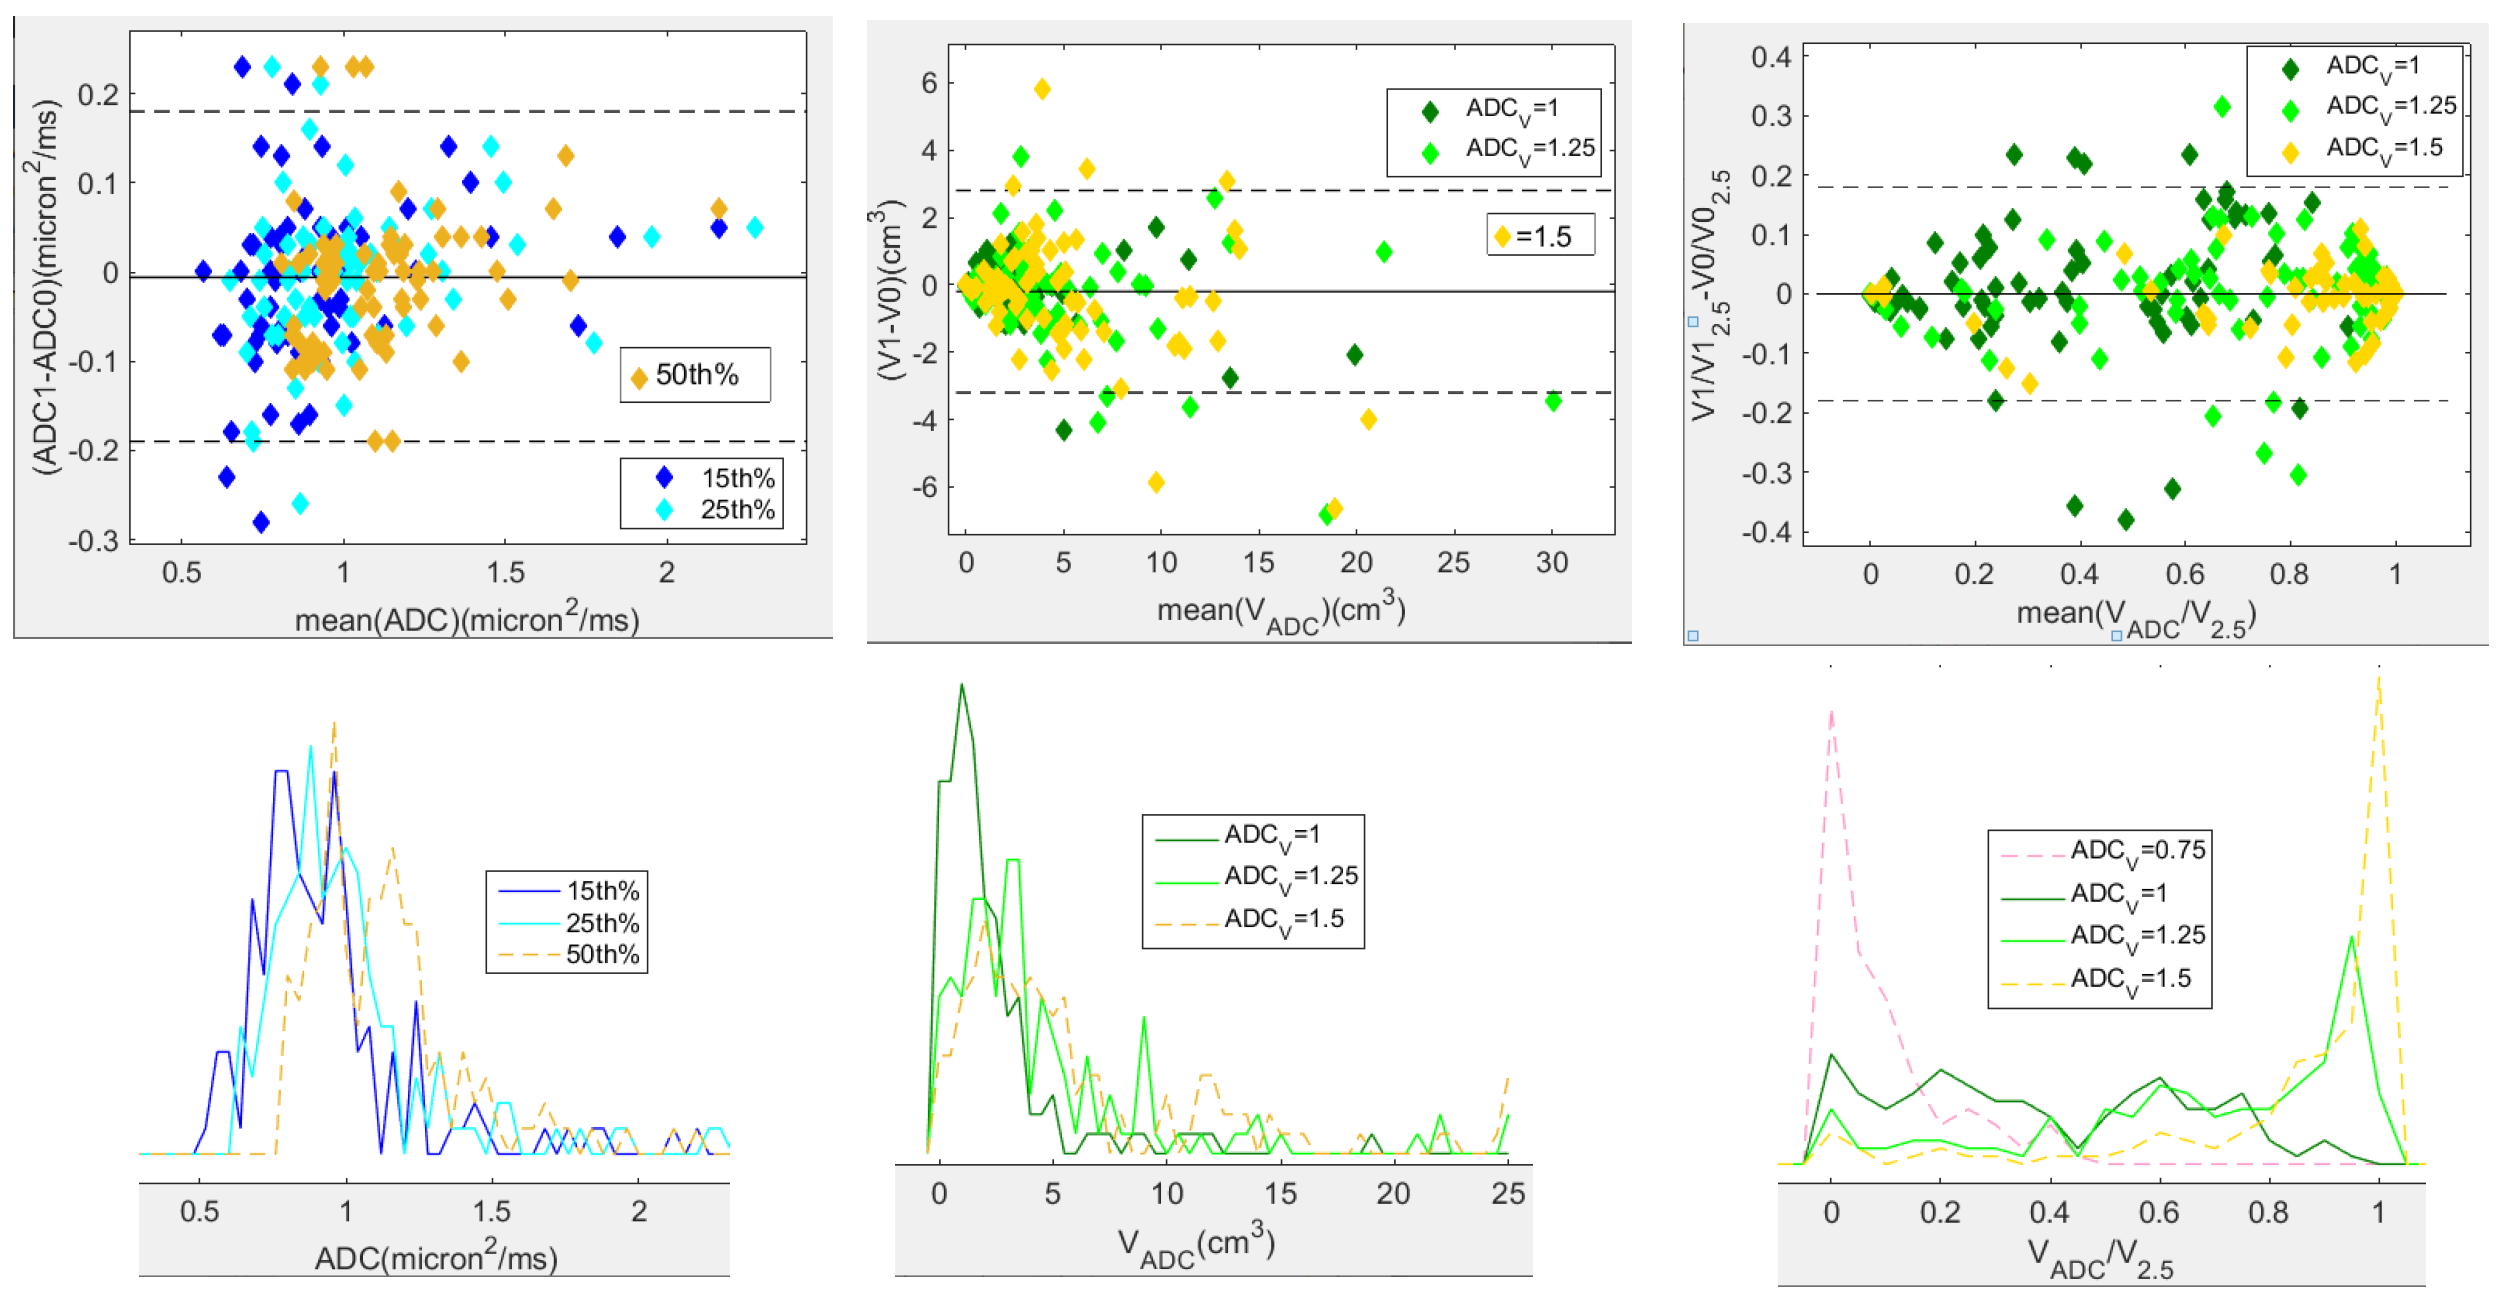
Figure 1 shows differences in high-b images, tumor ROI segmentations, and ADC maps for TT and RT on a typical subject, with the associated whole tumor ADC histograms. The wCV (%) for select tumor ADC histogram metrics are shown in Table 1. Highest precision (lowest wCV) was observed for 50th percentile (median), The median population distribution overlapped with that for mean, consistent with Gaussian measurement noise as a main source of observed TT-RT variations for this ADC histogram metric. Precision decreased for lower percentiles and for VADC metrics to values comparable to ROI measures, suggesting segmentation differences as the main contributor to these TT-RT variations. Total volume normalization improved repeatability and increased correlation with low histogram percentiles for ADC thresholds of 1.25-1.5 μm2/ms informing selection of robust thresholds for normalized solid tumor volume changes.BA plot for percentiles (Figure 2, left) illustrates consistent repeatability patterns for 15th , 25th and 50th percentiles. 90% of the subjects had lower histogram percentiles (15th and 25th) with ADC < 1.1±0.1 μm2/ms. The mean histogram for the 50th percentile appears to have a bi-modal distribution (dashed orange line), which may indicate partial volume contribution from necrotic tumor or normal fibroglandular tissue with higher ADC. The LOA for VADC (Figure 2, center) exceeded ±3 cm3, exceeding median detected tumor volumes, consistent with low repeatability of these metrics. For normalized volumes (VADC/V2.5, ADC = 1.0, 1.25, 1.5 μm2/ms, Figure 2, right) the LOA were comparable to those of the 25th percentile, confirming low percentiles as a possible representation of solid tumor volume fraction. For ADC thresholds 1.0 and 1.25 μm2/ms normalized volumes were distributed fairly uniformly across the range from 0-1 (dark and light green).
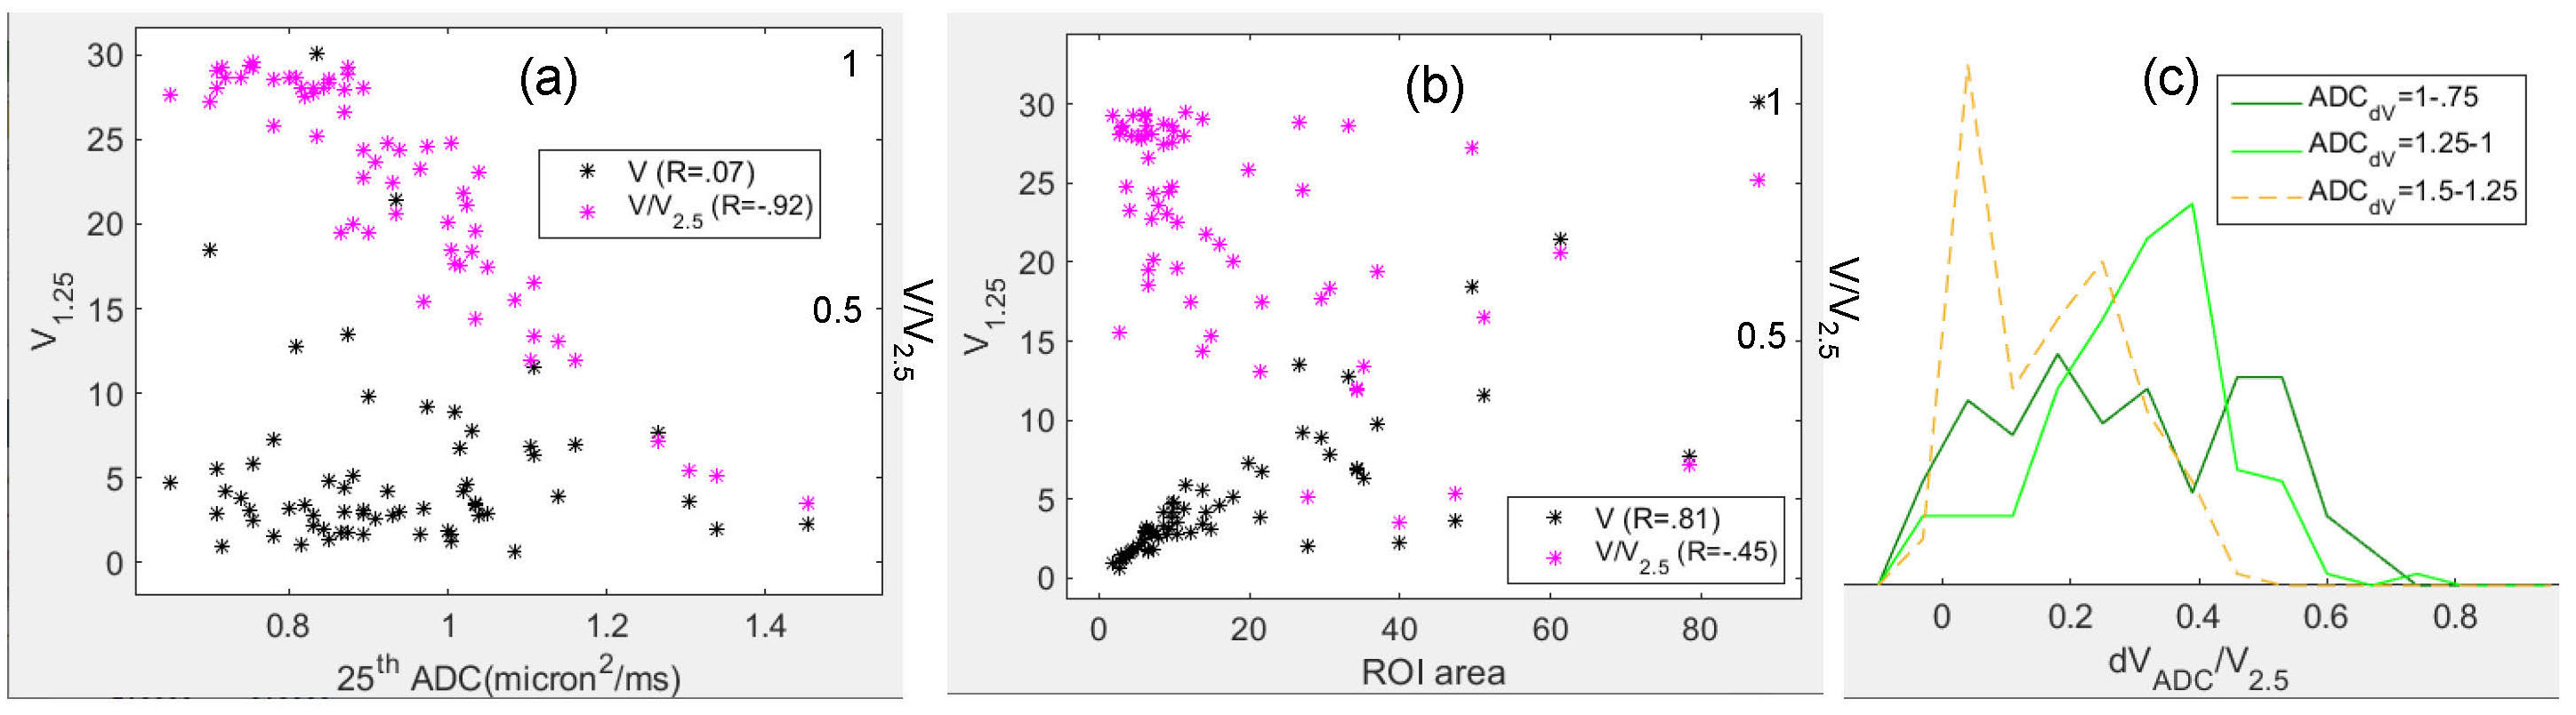
The effects of normalization on correlations of low ADC volumes to histogram percentiles and ROI area are further illustrated in Figure 3 (a,b). High VADC/V2.5 correlation to percentile changes (Figure 3a, magenta, V1.25 to 25th percentile) reflects adequate 25th percentile sensitivity to changes in dense (low ADC) tumor volumes. Lower correlation to ROI area (Figure 3(b), magenta) shows reduced sensitivity to segmentation errors. Figure 3c shows population distributions for difference in VADC/V2.5 for pairs of thresholds [ 1.0:0.75 ], [ 1.25:1.0 ] and [ 1.5:1.25 ] μm2/ms. [ 1.25:1.0 ] showed the greatest change for a majority of subjects, peaking at 0.4.
Conclusion
Tumor segmentation was the main source of test-retest error for volume-based ADC histogram metrics. Compared to volumes, low ADC percentiles (15th and 25th) showed 3-fold better repeatability and lower sensitivity to segmentation errors. When normalized to V2.5 , low ADC volume repeatability improved for ADC > 1.0 μm2/ms thresholds and V1.25/V2.5 showed a high correlation to the 25th percentile indicating functional equivalence of these measures. Both low percentile distribution and volume-change analysis suggest using a threshold between 1 and 1.25 μm2/ms to quantify changes in dense tumor volume as a potential reliable DWI marker of breast cancer treatment response.Acknowledgements
Support: National Institutes of Health Grants: U01CA225427,R01 CA132870, U01CA166104, R01CA190299, P01CA085878and P30 CA008748.
ACRIN receives funding from the NCI through the grants U01 CA079778, U01 CA080098, U24 CA180803
References
1 Zhang et al. DCE+DWI Meta-Analysis for diagnostics. Acta Radiologica 2016, 57(6): 651–660
2 Rahbar H, Zhang Z, Chenevert TL, Romanoff J, Kitsch AE, Hanna LG, Harvey SM, Moy L, DeMartini WB, Dogan B, Yang WT, Wang LC, Joe BN, Oh KY, Neal CH, McDonald ES, Schnall MD, Lehman CD, Comstock CE, Partridge SC. Utility of Diffusion-weighted Imaging to Decrease Unnecessary Biopsies Prompted by Breast MRI: A Trial of the ECOG-ACRIN Cancer Research Group (A6702). Clin Cancer Res. 2019;25(6):1756-65.
3 Partridge SC, Zhang Z, Newitt DC, Gibbs JE, Chenevert TL, Rosen MA, Bolan PJ, Marques HS, Romanoff J, Cimino L, Joe BN, Umphrey HR, Ojeda-Fournier H, Dogan B, Oh K, Abe H, Drukteinis JS, Esserman LJ, Hylton NM, Team AT, Investigators IST. Diffusion-weighted MRI Findings Predict Pathologic Response in Neoadjuvant Treatment of Breast Cancer: The ACRIN 6698 Multicenter Trial. Radiology. 2018;289(3):618-27.
4 Newitt DC, Zhang Z, Gibbs JE, Partridge SC, Chenevert TL, Rosen MA, Bolan PJ, Marques HS, Aliu S, Li W, Cimino L, Joe BN, Umphrey H, Ojeda-Fournier H, Dogan B, Oh K, Abe H, Drukteinis J, Esserman LJ, Hylton NM, Team AT, Investigators IST. Test-retest repeatability and reproducibility of ADC measures by breast DWI: Results from the ACRIN 6698 trial. J Magn Reson Imaging. 2019;49(6):1617-28.
5 Spick C, Bickel H, Pinker K, Bernathova M, Kapetas P, Woitek R, Clauser P, Polanec SH, Rudas M, Bartsch R,Thomas Helbich TH, Baltzer PA. Diffusion‐weighted MRI of breast lesions: a prospective clinical investigation of the quantitative imaging biomarker characteristics of reproducibility, repeatability, and diagnostic accuracy. NMR Biomed. 2016; 29: 1445–1453
6 Bickelhaupt S, Jaeger PF, Laun FB, Lederer W, Daniel H, Kuder TA, Wuesthof L, Paech D, Bonekamp D, Radbruch A, Delorme S, Schlemmer HP, Steudle FH, Maier-Hein KH. Radiomics Based on Adapted Diffusion Kurtosis Imaging Helps to Clarify Most Mammographic Findings Suspicious for Cancer. Radiology. 2018;287(3):761-70.
7 Craig J. Galbán1, Bing Ma1, Dariya Malyarenko1, Martin D. Pickles5, Kevin Heist1, Norah L. Henry2, Anne F. Schott2, Colleen H. Neal1, Nola M. Hylton6, Alnawaz Rehemtulla3, Timothy D. Johnson4, Charles R. Meyer1, Thomas L. Chenevert1, Lindsay W. Turnbull5, Brian D. Ross1 Multi-Site Clinical Evaluation of DW-MRI as a Treatment Response Metric for Breast Cancer Patients Undergoing Neoadjuvant Chemotherapy. PLoS ONE, 2015 10(3): e0122151.
8 Eisenhauer EA, Therasse P, Bogaerts J, Schwartz LH, Sargent D, Ford R, et al.New response evaluation criteria in solid tumours: revised RECIST guideline (version 1.1). Eur J Cancer, 2009; 45: 228–247.
9 Raunig DL, McShane LM, Pennello G, Gatsonis C, Carson PL, Voyvodic JT, et al. Quantitative imaging biomarkers: A review of statistical methods for technical performance assessment. Statistical methods in medical research. 2014.
Figures